Most people who die at home are found within a day. Some people who live alone die at home and are not found for days, weeks or months, because no one was expecting to hear from them. Japan calls these lonely deaths kodokushi, South Korea godoksa; elsewhere they surface as unattended deaths in coroners' records, as death certificates with no known cause, or as funerals that no relative arranged. This page collects every published figure we could verify: how many people die alone at home, how long it takes before they are found, who finds them, whether it is becoming more common, and what follows.
01 / How many
How many people die alone at home?
In 2025, 76,941 people in Japan who lived alone died at home and were handled by police, 37.6% of 204,562 police-handled bodies, up from 76,020 in 2024.[1]
Japan is the only country that counts every person living alone who dies at home, because its police handle those deaths. South Korea counts lonely deaths under a law of its own, Sweden counts people found a week or a month after death, and most other countries count nothing at all: there the nearest numbers are death certificates with no cause and funerals that no relative arranged. The figures below are the largest verified counts in each place; the section on comparing countries explains why they cannot be added up or ranked.
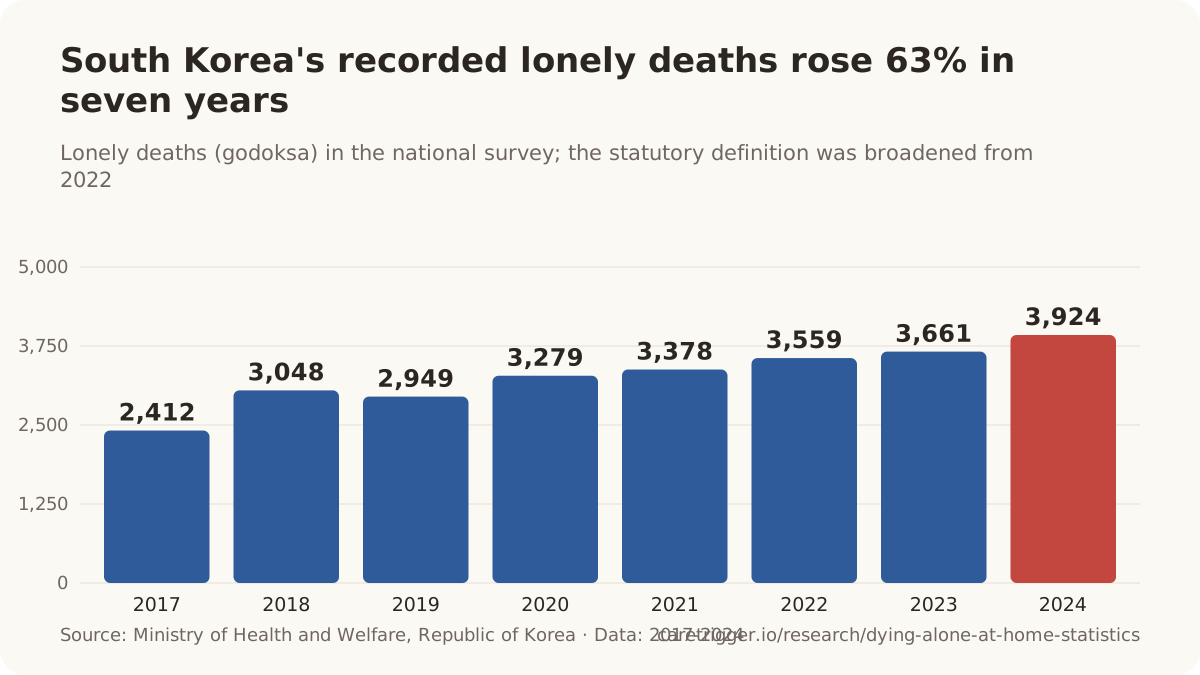
- South Korea's lonely deaths rose 7.2% to 3,924 in 2024 (from 3,661 in 2023), 1.09% of all deaths and 7.7 per 100,000 population.[5]
- About 11 lonely deaths a day were recorded in South Korea in 2024 (3,924 in the year, 10.7 a day) (Ministry of Health and Welfare, 2025; derived).[5]
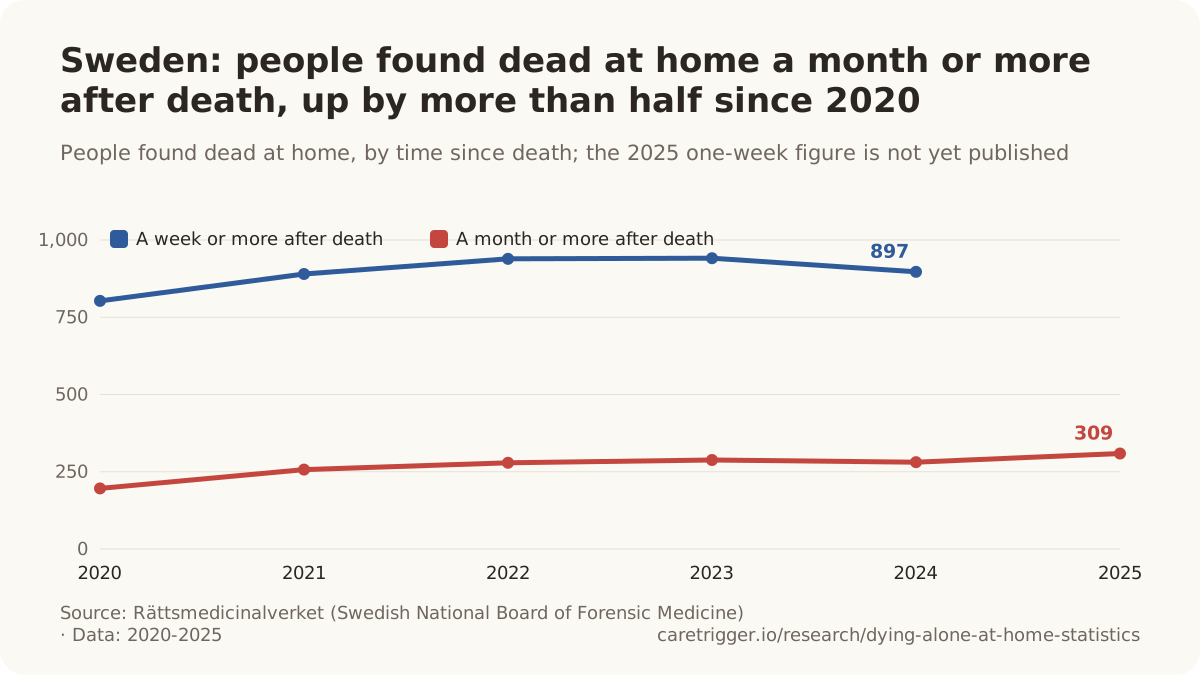
- In 2024, 897 people in Sweden were found dead in their homes a week or more after they died, down from a peak of 941 in 2023 (Rättsmedicinalverket, 2025).[10]
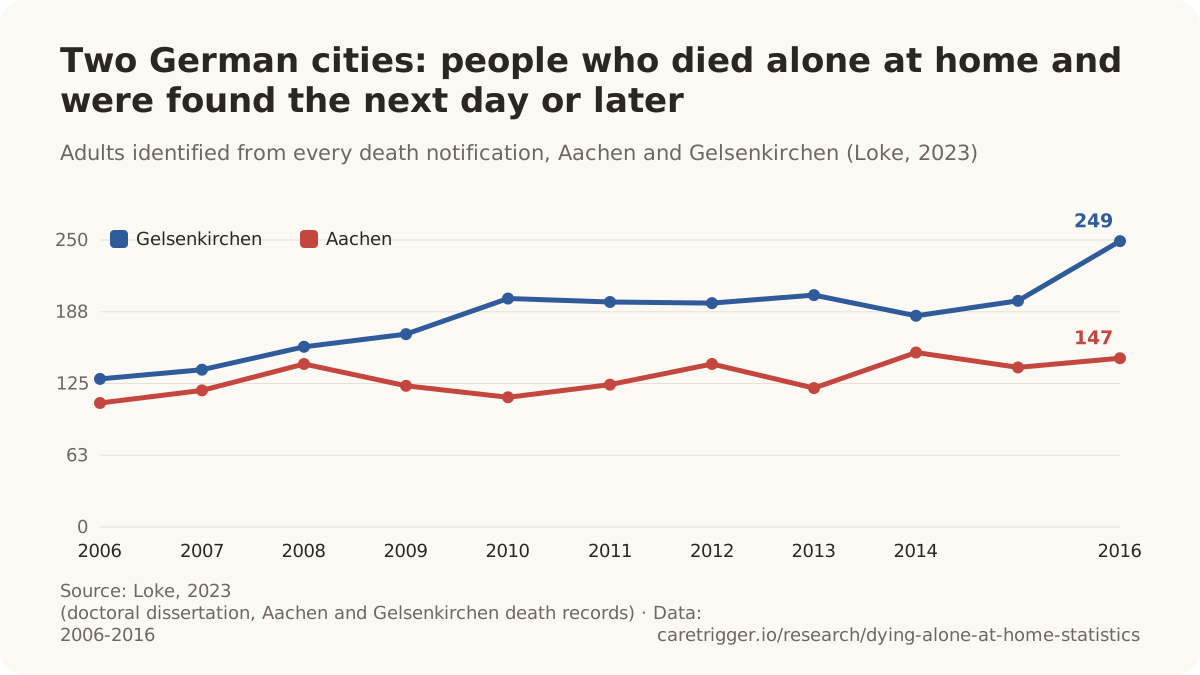
- At least 1 in 5 people who died at home in two German cities had died alone and was found only the next day or later: 18.7% of home deaths in Aachen and 23.2% in Gelsenkirchen on average over 2006-2016 (Loke, 2023).[11]
- 3,434 adults in two German cities died alone at home and were not found until the next day or later over 2006-2016 (Aachen 1,423; Gelsenkirchen 2,011), identified in a full survey of about 71,000 death notifications (Loke, Ruhr-Universitaet Bochum dissertation, 2023).[11]
- 5.0% of all deaths at home in the German city of Münster in 2017 (29 of 576) were 'lonely deaths' in which the body was found showing signs of decomposition (Dasch et al., Deutsches Ärzteblatt International, 2025).[12]
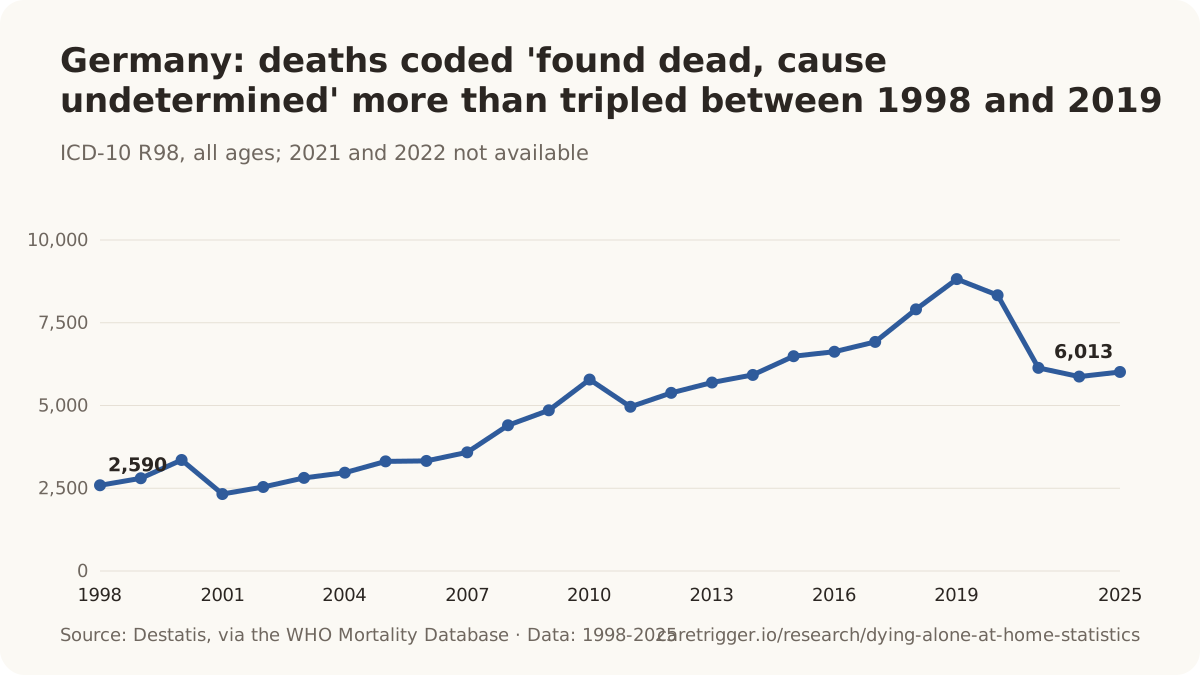
- In 2025, 6,013 deaths in Germany were coded R98, 'found dead, cause of death undetermined', 0.60% of all 1,006,588 deaths (Destatis, 2026).[13]
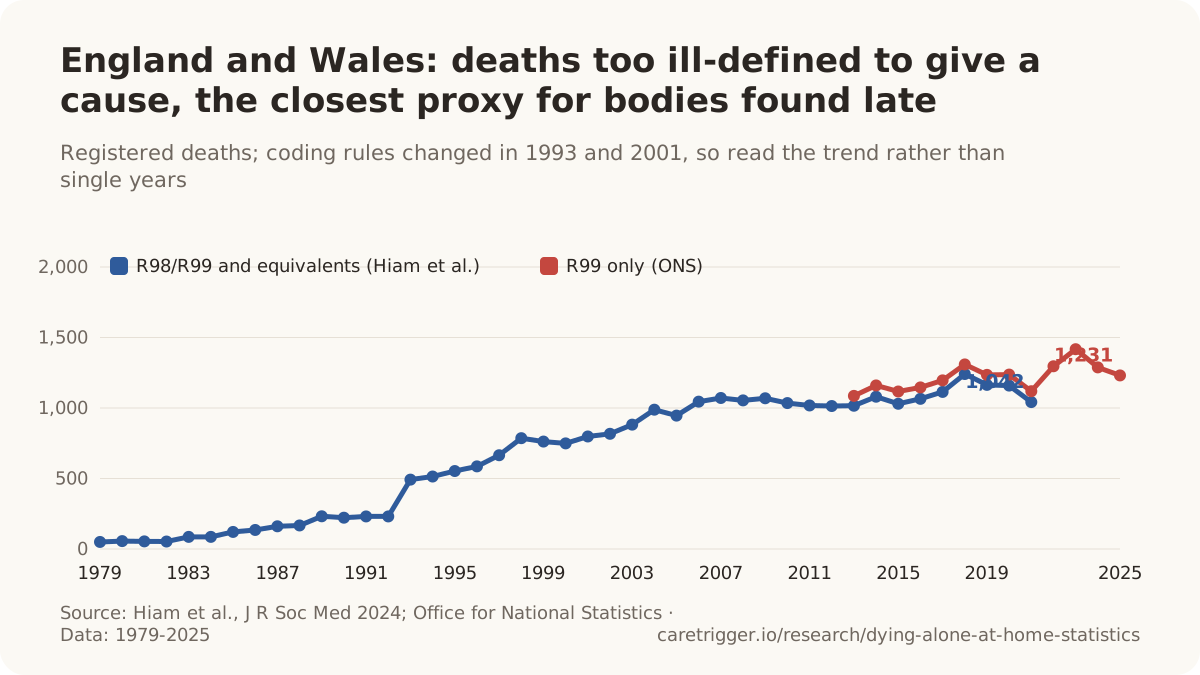
- 1,231 deaths of England and Wales residents registered in 2025 had 'other ill-defined and unspecified causes' (ICD-10 R99) as the underlying cause, the code used for bodies too decomposed to diagnose as well as other unknown causes: 848 men and 383 women (Office for National Statistics).[14]
- In Amsterdam, bodies lying unnoticed at home for two weeks or more occurred at 5.3 per 100,000 person-years (379 cases) versus 1.4 per 100,000 in surrounding municipalities (58 cases); all but three of the 437 people lived alone, and among people living alone the rate was 2.7 times higher in the city.[15]
- 417 people aged 65+ who lived alone were found dead at home in Spain's Valencian Community over 2015-2017: 159 in 2015, 135 in 2016 and 123 in 2017 (Esteve-Esteve et al., Revista Española de Salud Pública, 2021).[16]
- 262 people aged over 65 died alone at home in 2024 in the Portuguese cities and towns policed by the PSP (PSP data via Lusa, 2025).[17]
- In 2025, 54,797 people who lived alone died in the Netherlands, 31.6% of all 173,494 deaths, up from 41,722 in 2011 (Statistics Netherlands, 2026).[18]
- 47,842 people aged 65 and over who lived alone died in the Netherlands in 2025, 31.3% of all 152,847 deaths at 65+ (Statistics Netherlands, 2026).[18]
By region and city
- 46,313 people living alone died at home in Tokyo's 23 wards in 2016-2023 and were examined by the Tokyo Medical Examiner's Office (any age, cause or interval); 69.8% were men, with a median age of 70 for men and 80 for women (Ninomiya et al., Journal of Epidemiology, 2026).[26]
- 894 of South Korea's 3,924 lonely deaths in 2024 occurred in Gyeonggi Province (22.8%), 784 in Seoul (20.0%) and 367 in Busan (9.4%), the three largest regional counts (Ministry of Health and Welfare, 2025).[5]
- 9.8 lonely deaths per 100,000 people were recorded in Busan in 2021, the highest of South Korea's 17 regions, against a national average of 6.6; Daejeon (8.8), Incheon (8.5) and South Chungcheong (8.3) followed (Ministry of Health and Welfare, 2022).[27]
- 77 people in Stockholm County were found dead at home in 2025 a month or more after death, up from 60 in 2024, the largest increase of any Swedish county (Rättsmedicinalverket, 2026).[3]
- 237 people aged over 65 died alone at home in 2023 in the Portuguese cities and towns policed by the PSP (PSP data via Lusa, 2025).[17]
- 258 people aged over 65 died alone at home in 2022 in the Portuguese cities and towns policed by the PSP (PSP data via Lusa, 2025).[17]
- 13 people in Teruel province who lived alone were found dead at home after dying unnoticed, part of a rise flagged by the provincial forensic institute (Fiscalía General del Estado annual report, 2019).[28]
- 46 people in Berlin-Mitte were counted as having died alone ('einsam verstorben') in 2024, aged 38 to 91; with no relatives or means, they were buried by the district without a funeral service (Bezirksamt Mitte, 2024).[29]
| Period | Bodies | Scope | Source |
|---|---|---|---|
| 2014 | 166,353 bodies | All bodies handled by police (crime-related, unnatural and other deaths reported to police; traffic deaths excluded) · Japan | [30] |
| 2015 | 162,881 bodies | All bodies handled by police (crime-related, unnatural and other deaths reported to police; traffic deaths excluded) · Japan | [30] |
| 2016 | 161,407 bodies | All bodies handled by police (crime-related, unnatural and other deaths reported to police; traffic deaths excluded) · Japan | [31] |
| 2017 | 165,837 bodies | All bodies handled by police (crime-related, unnatural and other deaths reported to police; traffic deaths excluded) · Japan | [31] |
| 2018 | 170,174 bodies | All bodies handled by police (crime-related, unnatural and other deaths reported to police; traffic deaths excluded) · Japan | [31] |
| 2019 | 167,808 bodies | All bodies handled by police (crime-related, unnatural and other deaths reported to police; traffic deaths excluded) · Japan | [31] |
| 2020 | 169,496 bodies | All bodies handled by police (crime-related, unnatural and other deaths reported to police; traffic deaths excluded) · Japan | [31] |
| 2021 | 173,220 bodies | All bodies handled by police (crime-related, unnatural and other deaths reported to police; traffic deaths excluded) · Japan | [31] |
| 2022 | 196,103 bodies | All bodies handled by police (crime-related, unnatural and other deaths reported to police; traffic deaths excluded) · Japan | [31] |
| 2023 | 198,664 bodies | All bodies handled by police (crime-related, unnatural and other deaths reported to police; traffic deaths excluded) · Japan | [31] |
| 2024 | 204,184 bodies | All bodies handled by police (crime-related, unnatural and other deaths reported to police; traffic deaths excluded) · Japan | [31] |
| 2025 | 204,562 bodies | All bodies handled by police (crime-related, unnatural and other deaths reported to police; traffic deaths excluded) · Japan | [31] |
Numbers we will not publish. Several figures circulate without a source that supports them. "Between 60,000 and 150,000 unattended deaths a year in the United States" misreads research on unclaimed bodies: an unclaimed body is one no relative takes, not one nobody noticed. "One in five deaths in England and Wales happens alone" is attributed to the Office for National Statistics, which says it holds no data on how many people die alone. "Thirty thousand kodokushi a year" is a 2011 estimate by a life insurer's research institute of people found two or more days after death, long since replaced by police counts. We found no source for "one in three Japanese men over 65 will die alone by 2030" or for "20 to 30 percent of older Americans die alone", and the "8,000 to 9,000 people a year found a week after death in the UK" attributed to a 2024 study is not in that study. South Korea's law never set a 72-hour rule: it said "after a certain period" until that clause was deleted in 2024. And the "average of 17 days" comes from Japanese insurers' claims on rental tenants, not from any national count. If you have a source for any of these, tell us through the support page.
02 / Time to discovery
How long until someone finds them?
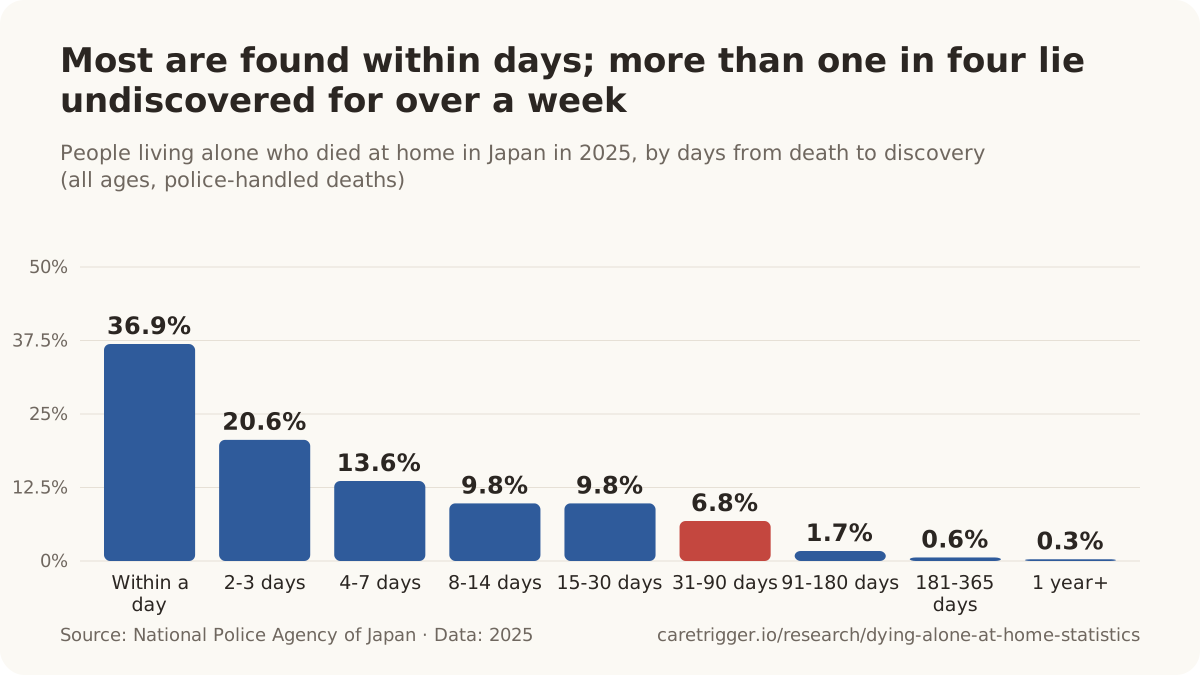
In 2025, 7,148 people who died alone at home in Japan (9.3%) were not found for a month or more.[2]
Most people who die alone at home are found within a few days, usually by someone who expected to hear from them. The long tail is the story: weeks or months pass when no one is checking, and every country that measures it finds the same shape. Japan's police record the days between death and discovery in every case; elsewhere the figures come from forensic and coroners' files.
- 5 days was the median interval between death and examination for men who died alone at home in Tokyo's 23 wards in 2016-2023 (interquartile range 2-16 days), versus 3 days for women (2-7 days) (Ninomiya et al., Journal of Epidemiology, 2026).[26]
- 295 of the 897 people found dead at home in Sweden in 2024 a week or more after death (32.9%) had lain dead 7-13 days; 231 (25.8%) 14-30 days, 117 (13.0%) 31-90 days, 26 (2.9%) 91-365 days and 1 more than a year, while 227 (25.3%) had only a month of death on record (Rättsmedicinalverket, 2025).[10]
- 143 of the 309 people found dead at home in Sweden in 2025 at least a month after death had lain dead 31-90 days; 35 had lain dead 91-365 days and 1 more than a year, while 130 had only a month of death on record (Rättsmedicinalverket, 2026).[34]
- 26.6 days was the mean time from death to discovery among 128 lonely deaths identified in 664 forensic autopsies in South Korea (2017-2021), ranging from 3 to 220 days; 62.5% (80) were found a week or more after death, after a mean 39.9 days (Na, Health and Social Welfare Review, 2023).[35]
- 43.0% of 128 lonely deaths at forensic autopsy in South Korea (2017-2021) were found between one week and one month after death (55), 37.5% within a week (3 to 7 days; 48), 16.4% after one to six months (21) and 3.1% after six months or more (4) (Na, Health and Social Welfare Review, 2023).[35]
- 21 days, on average, had passed between death and discovery for older South Australians found decomposed at home in 2019-2023, double the 10.7 days of 2000-2004; some were found up to 240 days after death (Byard, J Forensic Leg Med, 2025).[36]
- 47.4% of 1,423 people in Aachen (Germany) who died alone at home over 2006-2016 were found on day 1, 67.2% within 3 days, 81.2% within a week, 90.0% within 2 weeks, 96.1% within 4 weeks and 99.2% within 100 days; Gelsenkirchen's distribution was almost identical (Loke, 2023).[11]
- Just under half (245 of 491) of people found dead at home and autopsied in Homburg (Germany) in 2014-2018 were found within 24 hours, just under 90% within two weeks, and 3 more than a year after death (Umstaetter, 2025).[37]
- 41% of 88 people aged 65+ found decomposed after non-traumatic deaths at home in Trabzon, Turkey (2014-2023) had been dead 10 days or more: post-mortem interval 3-5 days in 22, 6-9 days in 30, 10-14 days in 24 and 15-30 days in 12 (Vural and Kalkan, BMC Geriatrics, 2026).[38]
- 11.1 days on average (range 3-27) had passed since people aged 65+ found decomposed at home in Trabzon, Turkey, in 2014-2023 were last seen alive, among the 71 of 88 cases with this information (Vural and Kalkan, BMC Geriatrics, 2026).[38]
- 8.5 days was the median time that people buried by the Gelsenkirchen (Germany) authorities after dying undiscovered at home had lain dead (58 cases with known lying time, March 2011 to January 2014; range 2-131 days); 78% were men and their mean age was 59.8 (Geser, Henke and Loke, 2014).[39]
- 25.7% of 637 solitary deaths autopsied in Wakayama, Japan (164 cases) were found between 7 days and a month after death, the second of two peaks; the first peak was within a day of death (28.6%, 182 cases) (Hashizume et al., Legal Medicine, 2025).[40]
- 45.5% of adults living alone whose deaths were investigated in Kyoto's largest forensic database in 2012-2015 were found more than a week after death (107 of 235) (Miyamori et al., BMC Public Health, 2022).[41]
- 23.2% of suspected-unnatural deaths at home in Yokohama in 2013 that could be matched to ambulance records (349 of 1,503) were found 3 or more days after death, the authors' threshold for a 'solitary death' (Kakiuchi et al., Environmental Health and Preventive Medicine, 2019).[42]
- 49% of people aged 65+ living alone who died unexpectedly in Yamagata Prefecture, Japan, in 2002-2007 were found more than a day after death, while 87% of all 3,387 older unexpected deaths studied were found within a day (Ito et al., BMJ Open, 2012).[44]
- 1.61 days was the median time to discovery for people aged 65-74 living alone who died unexpectedly in Yamagata Prefecture in 2002-2007, versus 0.99 day at 75-84 and 0.61 day at 85+ (Ito et al., BMJ Open, 2012).[44]
- 4.2 days was the average interval between death and discovery for men among 582 forensic autopsy cases at the Osaka Medical Examiner's Office in 2010-2012, against 1.3 days for women (Morita et al., Prilozi, 2015).[45]
- 4,849 days, about 13 years, was the longest interval between death and examination recorded for a woman who died alone at home in Tokyo's 23 wards in 2016-2023; the longest for a man was 4,429 days (Ninomiya et al., Journal of Epidemiology, 2026).[26]
- A review of 1,714 decomposition cases at the Allegheny County (Pittsburgh) Medical Examiner's Office over 2007-2016 found reported post-mortem intervals ranging from 1 to 2,920 days, with 'last known social contact' the main basis for the interval in 82% of US cases.[47]
- Of 58,044 people aged 65+ who lived alone and were found dead at home in Japan in 2024, 22,734 (39.2%) were found within one day of death, while 4,538 (7.8%) were not found for more than 30 days (National Police Agency of Japan, 2025).[20]
| Measure, population and year | Figure | Scope | Source |
|---|---|---|---|
| Japan, all ages: not found for a month or more (2025) | 7,148 | People living alone who died at home, found >=31 days after death (all ages) · Japan · 2025 | [2] |
| Japan, 65+: found 8 or more days after death (2025) | 15,911 people | People aged 65+ living alone who died at home, bodies handled by police, found 8+ days after death (any cause) · Japan · 2025 | [2] |
| Japan, under 65: found 8 or more days after death (2025) | 34.6% | People under 65 living alone who died at home, bodies handled by police, found 8+ days after death · Japan · 2025 | [2] |
| Tokyo, men living alone: found 8 or more days after death (2021) | 41.8% | Unnatural deaths at home examined by Tokyo ME office, single-person vs multi-person households, by gender · Tokyo, Japan (23 special wards) · 2021 | [32] |
| Kobe, people living alone: found more than a week after death (2023) | 38.3% | People living alone who died at home, cases examined by the Hyogo Prefectural Medical Examiner's Office · Kobe, Japan (Hyogo ME office jurisdiction) · 2023 | [33] |
| Aachen, Germany: undiscovered for 8 days or more (2006-2016) | 18.8% | Adults (18+) who died alone in their own home or its immediate surroundings (cellar, garage, garden) and were found the next day or later, with at least 12 hours between last sighting and discovery ('unentdeckte Tode'); all causes including suicide · Aachen and Gelsenkirchen (North Rhine-Westphalia), Germany · 2006-2016 | [11] |
| Sweden: of people found a week or more after death, share found after a month (2024) | 31.3% | People found dead in a private home in Sweden whose death was investigated by RMV for the police, found at least one week after death (all ages, any manner of death) · Sweden · 2024 | [10] |
| South Korea, lonely deaths at forensic autopsy: mean time to discovery (2017-2021) | 26.6 days | Unwitnessed deaths found 3+ days after death among forensic autopsies performed by one forensic pathologist (Pusan National University) · South Korea · 2017-2021 | [35] |
| South Australia, people 60+ found decomposed: mean time to discovery (2019-2023) | 21 days (mean post-mortem interval) | Autopsied people aged 60+ who died at home with moderate to marked decomposition (67 cases) · South Australia (Forensic Science SA, Adelaide) · 2019-2023 (vs 2000-2004) | [36] |
| Japan, insured tenants who died alone: average time to discovery (2015-2025) | 19 days | Tenants of rental housing covered by members' 'lonely death' insurance who died alone in the unit and were found after death (claims Apr 2015-Mar 2025) · Japan (insured rental housing) · claims April 2015 to March 2025 | [46] |
Why Kobe's totals differ. The Hyogo Medical Examiner's Office report counts 843 people who lived alone and died at home in Kobe in 2023 in its table of time to discovery, 841 in its table of who found them and 842 in its table of causes of death. Each Kobe figure on this page uses the total of its own table.
When the person is found alive
31% of the 387 times people living alone were found helpless or dead at home in San Francisco in 1993 (120 events) came after an estimated time incapacitated of more than 12 hours: 72 of 297 found alive and 48 of 90 found dead (Gurley et al., NEJM, 1996; derived from Table 1).[49]
- Among the 90 people found dead at home in the San Francisco study, paramedics estimated 29% had been down for more than 72 hours (median 18 hours), versus a median of 2 hours for those found alive, of whom 31% had been helpless under an hour.[49]
- The median estimated time spent incapacitated was 4.5 hours across all events; 2 hours for those found alive and 18 hours for those found dead (Gurley et al., NEJM, 1996; San Francisco, 1993).[49]
- 10% of people found helpless or dead at home had been unable to summon help for more than three days, and only 38% of that group survived (Gurley et al., NEJM, 1996; San Francisco, 1993).[49]
03 / Who
Who dies alone at home and is found late?
52.6% of Japan's 22,222 estimated isolated deaths in 2025 (11,694) were men aged 60 to 79; men outnumbered women in every age band, and the two came close only at 85+ (956 men, 874 women) (Cabinet Office of Japan, 2026).[9]
Lonely deaths are overwhelmingly men's deaths, and not only among the very old. In Japan most are men in their sixties and seventies, in South Korea men in their fifties and sixties, in Sweden and Germany men of every age. What they share is less an age than a set of circumstances: living alone, unmarried or divorced, often poor, often ill, and out of touch with family.
- 3,205 of South Korea's 3,924 lonely deaths in 2024 were men (81.7%), against 605 women (15.4%) and 114 whose gender was not recorded (2.9%) (Ministry of Health and Welfare, 2025).[5]
- 78% of people aged 60+ found decomposed at home and autopsied in South Australia in 2000-2004 and 2019-2023 were men (73 of 94), most of whom died of ischaemic heart disease (Byard, Journal of Forensic and Legal Medicine, 2025).[36]
- 77.9% of people found 3 or more days after dying at home in Yokohama in 2013 were men (272 of 349), versus 59.9% of those found sooner (691 of 1,154) (Kakiuchi et al., Environmental Health and Preventive Medicine, 2019).[42]
- 74% of 637 solitary deaths autopsied in Wakayama, Japan were men (471), with cases rising from age 40 in men and from age 60 in women (Hashizume et al., Legal Medicine, 2025).[40]
- Of 88 decomposed bodies from non-traumatic in-home deaths of older people examined in Turkey, 85.2% had lived alone, 83.0% were men and the mean age was 70.9.[51]
- 7.4% of men who died at home in Münster in 2017 (22 of 299) were found decomposed, about three times the share among women (2.5%, 7 of 277) (Dasch et al., Deutsches Ärzteblatt International, 2025).[12]
- 2.40 times the odds of women: men aged 65+ who died at home in Spain's Valencian Community in 2015-2017 were more likely to be a solitary death, living alone and found dead (adjusted OR 2.40, 95% CI 1.87-3.06) (Esteve-Esteve et al., Revista Española de Salud Pública, 2021).[16]
- About 3 times higher for men than women: age-standardised rates of 'undefined' deaths (ICD-10 R98/R99, a proxy for bodies too decomposed to establish a cause) in both working-age (20-59) and older (60+) groups in England and Wales, 1979-2020 (Hiam et al., Journal of the Royal Society of Medicine, 2024).[52]
- Men were 66.1% (3,975) of the 6,013 deaths in Germany coded R98 'found dead, cause undetermined' in 2025, and people aged 65+ were 63.5% (3,817) (Destatis, 2026).[13]
- 102.5 per 100,000 men in Tokyo's 23 wards died alone at home in 2023 and were examined by the Tokyo Medical Examiner's Office, up from 69.3 in 2016 (crude rate of solitary deaths; Ninomiya et al., Journal of Epidemiology, 2026).[26]
- 41.4 per 100,000 women in Tokyo's 23 wards died alone at home in 2023 and were examined by the Tokyo Medical Examiner's Office, up from 29.7 in 2016 (crude rate of solitary deaths; Ninomiya et al., Journal of Epidemiology, 2026).[26]
- About three times as many men as women were among 211 people found dead in private homes at least 24 hours after death and autopsied in Giessen (Germany) in 2005-2011; mean age at death was 50.1 for men and 57.8 for women (Merz et al., 2012).[53]
- 4.5% of 1,390 forensic autopsies in Aydin, Turkey (2004-2008) were of decomposed bodies (62); 91.9% were men, 38.7% had lived alone and 57.9% were found at home (Erel et al., Ulusal Travma ve Acil Cerrahi Dergisi, 2011).[54]
Age
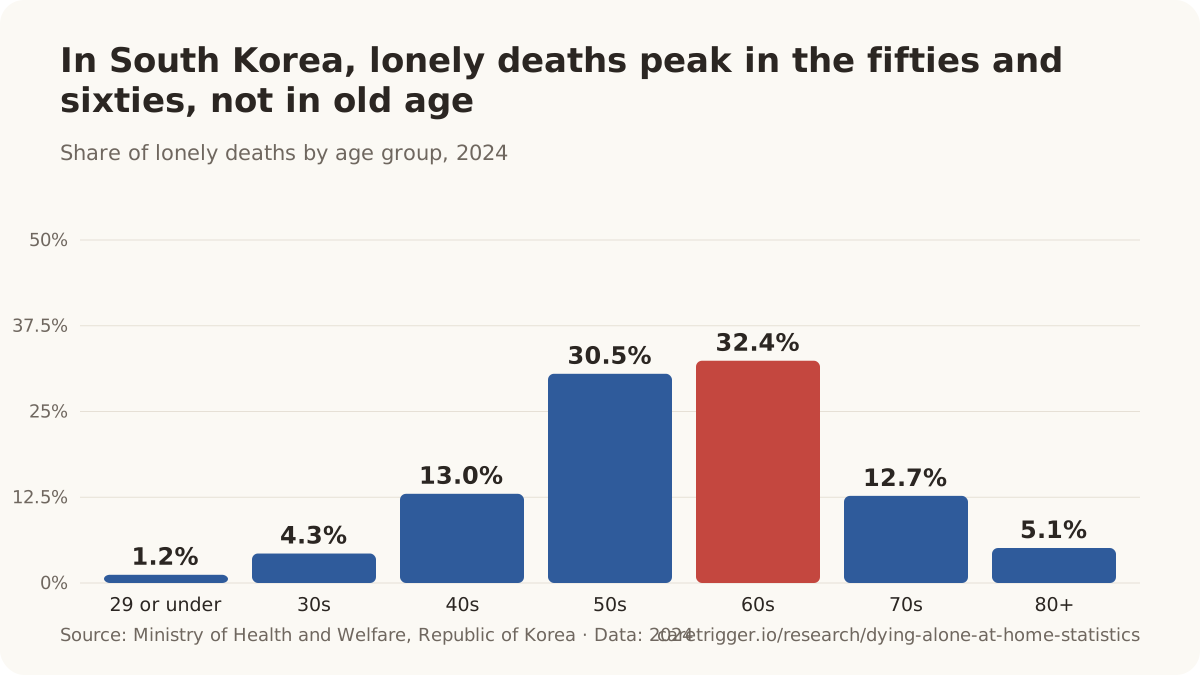
- 32.4% of South Korea's lonely deaths in 2024 were people in their 60s (1,271), 30.5% in their 50s (1,197), 13.0% in their 40s (509), 12.7% in their 70s (497), 5.1% aged 80+ (202), 4.3% in their 30s (171) and 1.2% aged 29 or under (47) (Ministry of Health and Welfare, 2025).[5]
- 16.6 lonely deaths per 100,000 people in their 60s were recorded in South Korea in 2024, the highest of any age group, ahead of people in their 50s (13.9), 70s (12.2) and 80+ (8.4); the all-age rate was 7.7 (Ministry of Health and Welfare, 2025).[5]
- 49.2% of people in Gelsenkirchen and 46% in Aachen (Germany) who died alone at home and were found late were aged 65 or younger (median age 66 and 67), far younger than the general dying population (Loke, 2023).[11]
- 553 of the 1,231 R99 deaths of England and Wales residents in 2025 (44.9%) were people aged 40-64, more than the 470 (38.2%) aged 65 or over, so this closest official proxy for bodies found too decomposed to diagnose is concentrated in middle age rather than among the oldest (Office for National Statistics, derived from Nomis).[56]
- 11.8% of people under 60 who died at home in Münster in 2017 (11 of 93) were found decomposed, versus 3.7% of those aged 60 or over (18 of 483) (Dasch et al., Deutsches Ärzteblatt International, 2025).[12]
- 25% of kodokushi cases in Tokyo in 2016, people living alone who died at home, were under 60 (Toyama and Poudyal, SN Social Sciences, 2021).[57]
Living alone, family and marriage
- 3.73 was the adjusted hazard ratio for being found later after an unexpected death among people aged 65+ living alone versus those living with family in Yamagata Prefecture (2002-2007), the strongest predictor studied; median time to discovery was 1.00 day versus 0.08 day (Ito et al., BMJ Open, 2012).[44]
- About 19% of people aged 65+ who lived with family and were found dead or critically ill at home (forensic autopsies, Kyoto, 2009-2013) had gone more than three days before anyone found them, up from about 7% in 1989-1993 (Nomura et al., Science & Justice, 2016).[59]
- About 7% of people aged 65+ who lived with family and were found dead or critically ill at home (forensic autopsies, Kyoto, 1989-1993) had gone more than three days before anyone found them (Nomura et al., Science & Justice, 2016).[59]
- 23% of people found 3 or more days after dying at home in Okayama University forensic autopsy cases (56 of 244) lived with family or acquaintances rather than alone (Yamasaki et al., Legal Medicine, 2026).[60]
- 100% of the markedly decomposed bodies of people who died at home in a central London coronial autopsy series had lived alone, as reported by Estrin-Serlui and Osborn and quoted by Hiam et al. (J R Soc Med, 2024).[52]
- In eastern Attica (Greece), 217 decomposing bodies were found indoors over 2012-2021; the typical case was a Greek man over 65, single, childless and living alone, found by relatives or neighbours within a month of death, with a natural cause.[61]
- 3.05 times the odds of being found 3 or more days after death: never-married people who died at home in Yokohama in 2013, compared with married, divorced or widowed people (95% CI 2.27-4.10); men had 1.80 times and people with liver disease 2.48 times the odds (Kakiuchi et al., Environmental Health and Preventive Medicine, 2019).[42]
- 29.25 times the odds of married people: divorced people aged 65+ who died at home in Spain's Valencian Community in 2015-2017 were more likely to be a solitary death (never married 23.23; widowed 7.14) (Esteve-Esteve et al., Revista Española de Salud Pública, 2021).[16]
- 83% of men in Gelsenkirchen (Germany) found 8 or more days after dying alone at home were single (50%) or divorced/separated (33%); only 8% were widowed and 7% married (Loke, 2023).[11]
- 7.4% of US decedents aged 51 and over (2002-2015) had no spouse, partner or children at the end of life, and these kinless decedents were more likely to have lived alone (Plick et al., J Am Geriatr Soc, 2021).[62]
Poverty, illness and alcohol
- 14.2 times the adjusted odds of a lonely death: people in Korea's lowest income group (Medical Aid recipients) compared with the highest income group, in a national case-control study of all 3,122 lonely deaths in 2021 (aOR 14.19, 95% CI 12.00-16.77) (Koo et al., Journal of Korean Medical Science, 2025).[64]
- 30.8% of South Korea's lonely deaths in 2021 were Medical Aid recipients, against 4.0% of matched controls, and 54.5% were in the lowest income group, against 19.2% (Koo et al., Journal of Korean Medical Science, 2025).[65]
- 30.8% of the 3,122 people who died lonely deaths in Korea in 2021 were Medical Aid recipients, a group that makes up only 2.9% of the population (Bai et al., Journal of Preventive Medicine and Public Health, 2025).[66]
- 19.6% of people who died a lonely death in Korea in 2021 had a diagnosed mental or behavioural disorder due to alcohol, against 1.5% of matched controls (adjusted OR 5.48) (Koo et al., Journal of Korean Medical Science, 2025).[64]
- 32.7% of people who died a lonely death in Korea in 2021 had been diagnosed with a mood disorder in the previous five years, against 13.3% of matched controls (Koo et al., Journal of Korean Medical Science, 2025).[64]
- 20.1% of South Korea's identifiable lonely deaths in 2021 had a history of hypertension, 18.0% diabetes, 12.3% alcohol-related disorders and 11.1% a severe illness such as cancer, stroke or heart disease (Ministry of Health and Welfare, 2023).[67]
- 61.8% of people living alone with alcohol abuse whose deaths were investigated in Kyoto in 2012-2015 lay undiscovered for more than a week (42 of 68), versus 38.9% of those without (65 of 167); adjusted proportion ratio 1.50 (Miyamori et al., BMC Public Health, 2022).[41]
- 79.3% of men (2,209 of 2,785) and 89.5% of women (1,062 of 1,187) who died alone at home of disease in Tokyo's 23 wards in 2015 were not employed (Kanawaku and Ohno, Journal of Nippon Medical School, 2020).[68]
- 3 to 8 days was the median interval between death and examination for non-employed people who died alone at home of disease in Tokyo's 23 wards in 2015 (by age and gender group), 1 to 5 days longer than for employed people; some were found after more than 100 days (Kanawaku and Ohno, Journal of Nippon Medical School, 2020).[68]
- 61% of 138 people who died in hoarding environments and were investigated by the Cook County (Chicago) Medical Examiner in 2017-2018 were found decomposed; 86% had lived alone (Waters et al., American Journal of Forensic Medicine and Pathology, 2022).[69]
Suicide and natural causes
- 90.9% of the people found dead at home in Sweden in 2025 a month or more after death died of natural causes (281 of 309); 28 deaths were accidents or suicides (Rättsmedicinalverket, 2026).[3]
- 61.4% more non-suicide lonely deaths were recorded in South Korea in 2023 than in 2017 (3,145 against 1,949) (Ministry of Health and Welfare, 2024; derived).[50]
Housing
- 48.9% of South Korea's lonely deaths in 2024 occurred in houses (detached, multi-household or villa; 1,920), 19.7% in apartments (774), 19.6% in studio flats or officetels (769), 4.8% in gosiwon (189) and 4.2% in motels or inns (163) (Ministry of Health and Welfare, 2025).[5]
Heatwaves
- 56% of the 619 people who died of heat in British Columbia in summer 2021 (347) lived alone; 30% lived with a spouse or family (BC Coroners Service, 2022).[73]
- In 98% of British Columbia's 619 heat deaths in summer 2021, the heat injury occurred indoors in a residence (BC Coroners Service, 2022).[73]
- 67% (415) of the 619 people who died of heat in British Columbia in summer 2021 were aged 70 or older (BC Coroners Service, 2022).[73]
- At least 48 of the 68 stably housed people who died of heat in Multnomah County (Portland, Oregon) in 2021 lived alone (71%) (Multnomah County Health Department, 2022).[74]
- 68 of the 72 people who died of heat in Multnomah County in 2021 (94%) died in their own residence (Multnomah County Health Department, 2022).[74]
- 69% of the people who died at home or in the community from probable heat-related causes in Montreal's 2018 heat wave (38 of 55) lived alone, and none had working air conditioning (Montreal Regional Public Health Department, 2019).[75]
- People who lived alone had 2.3 times the odds of heat-related death in the July 1995 Chicago heat wave (multivariate odds ratio), one of the two strongest risk factors alongside being confined to bed (Semenza et al., NEJM, 1996).[76]
- People who did not leave home each day had 6.7 times the odds of heat-related death in the 1995 Chicago heat wave (univariate analysis) (Semenza et al., NEJM, 1996).[76]
- 2.34 times the odds in summer as in spring: deaths at home of people aged 65+ in Spain's Valencian Community in 2015-2017 were more likely to be solitary deaths (living alone, found dead) in summer, with winter at 1.93 and autumn at 1.82 (Esteve-Esteve et al., Revista Española de Salud Pública, 2021).[16]
04 / Who finds them
Who finds them, and how?
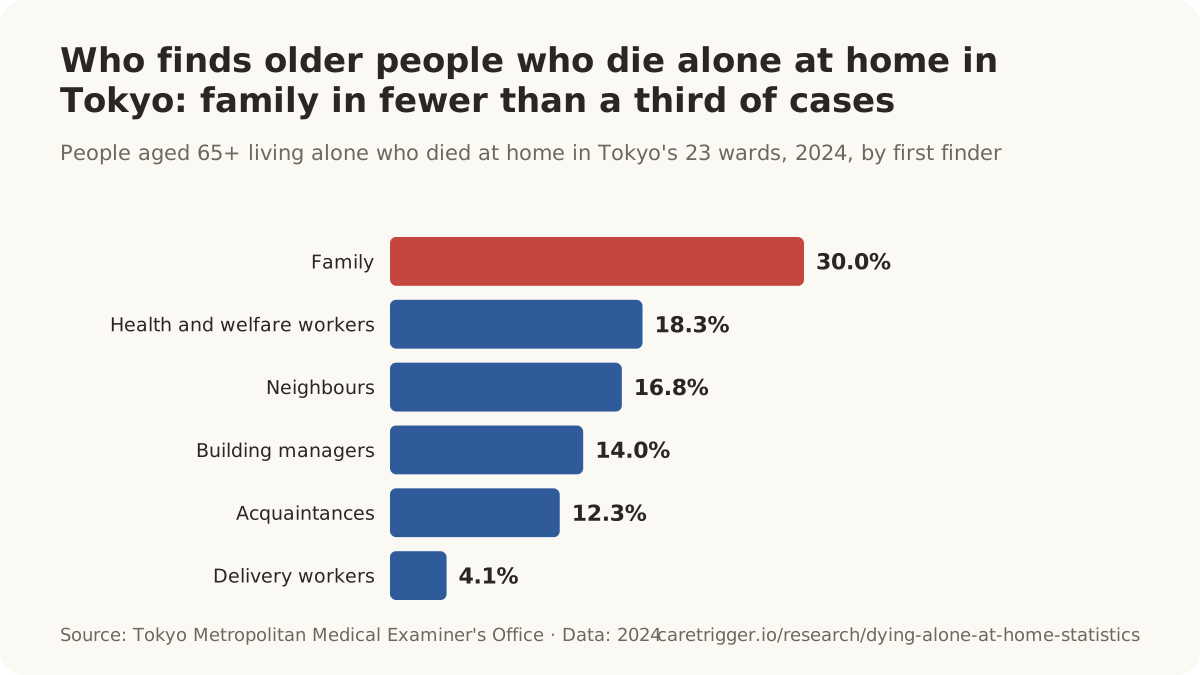
30.0% of the 5,302 people aged 65+ who lived alone and died at home in Tokyo's 23 wards in 2024 were found by family; health and welfare workers found 18.3%, neighbours 16.8%, building managers 14.0%, acquaintances 12.3% and delivery workers 4.1% (Tokyo Medical Examiner's Office, 2026).[70]
The person who finds a body is usually the person who noticed something was wrong: a relative who could not get through, a care worker at the door, a neighbour, a building manager, a courier. The share found by family is falling in both Japan and South Korea, and the longer it is before anyone looks, the more often the alarm is a smell or unpaid rent.
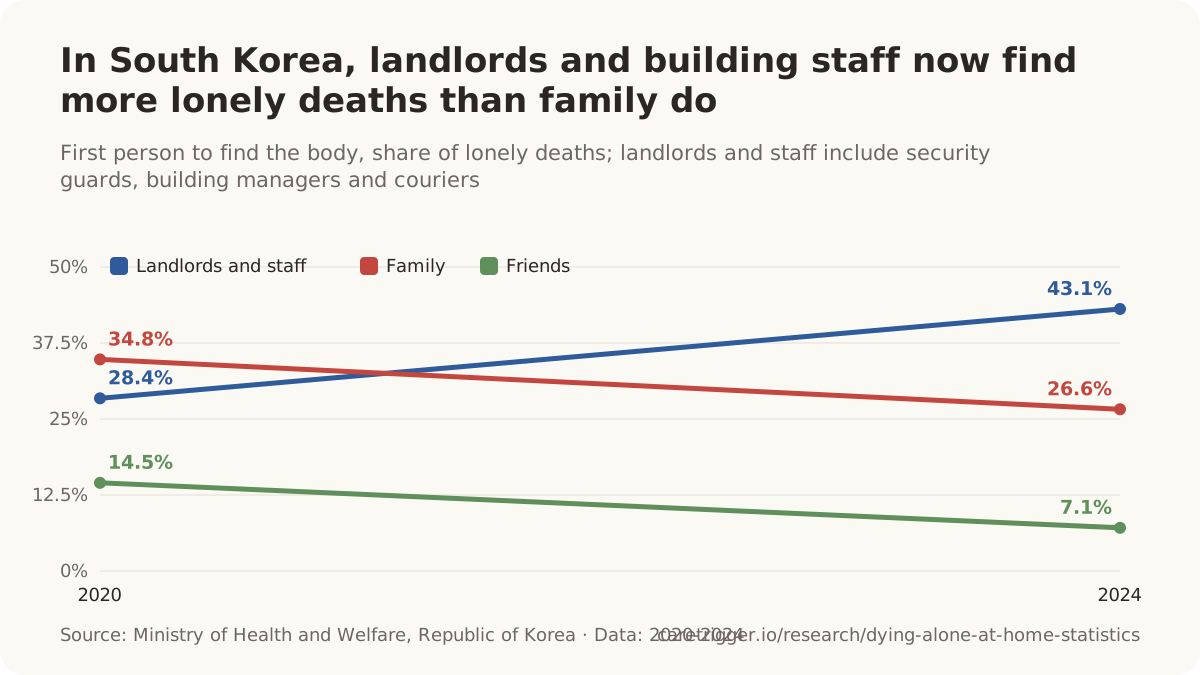
- 43.1% of South Korea's lonely deaths in 2024 were first found by landlords, security guards, building managers or couriers, up from 28.4% in 2020, while the share found by family fell from 34.8% to 26.6% and by friends or acquaintances from 14.5% to 7.1% (Ministry of Health and Welfare, 2025).[5]
- In South Korea in 2024, lonely-death bodies were most often found by a landlord, security guard or building manager (43.1%), then family (26.6%), neighbours (12.0%) and health/welfare workers (7.7%); in 2023 the shares were 34.5%, 26.2%, 19.3% and 7.0%.[5]
- 159 of South Korea's 3,378 lonely deaths in 2021 (4.7%) were first found by delivery couriers, up from 81 (3.4%) in 2017; siblings (758, 22.4%) and landlords (740, 21.9%) were the most common first finders (Ministry of Health and Welfare, 2022).[27]
- About 2 weeks on average passed before people living alone with no one checking on them were found, typically because of an odour or unpaid rent, versus 3 days when family, friends, colleagues or carers found them and 7 days when piled-up newspapers raised the alarm (Osaka, 2010-2012; Morita et al., Prilozi, 2015).[45]
- 50.9% of 128 lonely deaths at forensic autopsy in South Korea (65) were found by neighbours reporting a smell or by building managers and landlords collecting fees or rent, after a mean 29.7 days, against a mean 17.6 days when family found the body (Na, Health and Social Welfare Review, 2023).[35]
- 51% of people aged 65+ living alone who died unexpectedly in Yamagata Prefecture in 2002-2007 were found by someone outside their family (337 of 659), against 17% of older people who lived with family (466 of 2,728) (Ito et al., BMJ Open, 2012).[44]
- 135 of 491 people found dead at home and autopsied in Homburg (Germany) in 2014-2018 were found because they were missed or could not be reached; 52 were noticed because of a smell, 19 because of an overflowing mailbox and 3 because shutters did not move (Umstaetter, 2025).[37]
- 195 of 491 people found dead at home and autopsied in Homburg (Germany) in 2014-2018 were found by a family member or partner; police found 91 and the fire brigade 82, with friends, colleagues, carers, caretakers and landlords finding fewer (Umstaetter, 2025).[37]
- Only 11% of people found helpless or dead at home in the San Francisco study were found by family; carers, visiting nurses and home aides (76), friends (41), neighbours (36) and landlords (3) found most others, and calls from landlords were linked to the longest time down (median >72 hours).[49]
- 50% of the 619 people who died of heat in British Columbia in summer 2021 (308) were found during a wellness check by family, friends, support or health workers or police; 32% were found during routine contact (BC Coroners Service, 2022).[73]
- 68% of indoor heat-related deaths in Maricopa County, Arizona, in 2024 were discovered during a welfare check (Maricopa County Department of Public Health, 2025).[77]
- 48% of indoor heat-related deaths in Maricopa County (Phoenix), Arizona, in 2025 (53 of 111) were discovered during a welfare check by a neighbour, family member or emergency medical services (Maricopa County Department of Public Health, 2026).[78]
- 62 older people were found dead inside their homes by Madrid city firefighters during 605 door openings between 11 March and 11 May 2020, versus 27 in the same period of 2019 (Madrid City Council, 2020).[79]
- 69.9% of the 196 deaths at home in Münster in 2017 that an emergency physician attended (34.0% of all 576 home deaths) were people already dead when the physician arrived (Dasch et al., Deutsches Ärzteblatt International, 2025).[12]
- Dutch police ask the Netherlands Forensic Institute two to three times a week, on average, to identify by DNA a person found dead with no crime suspected, most often someone who died alone and unnoticed (NFI, undated).[80]
| Period | Found by family | Scope | Source |
|---|---|---|---|
| 2002 | 38.8% | People aged 65+ living alone who died at home, ME-examined cases; share first found by family · Tokyo, Japan (23 special wards) | [81] |
| 2012 | 35.6% | People aged 65+ living alone who died at home, ME-examined cases; share first found by family · Tokyo, Japan (23 special wards) | [82] |
| 2024 | 30 percent | People aged 65+ living alone who died at home, ME-examined cases; first discoverer · Tokyo, Japan (23 special wards) | [70] |
05 / Over time
Is dying alone at home becoming more common?
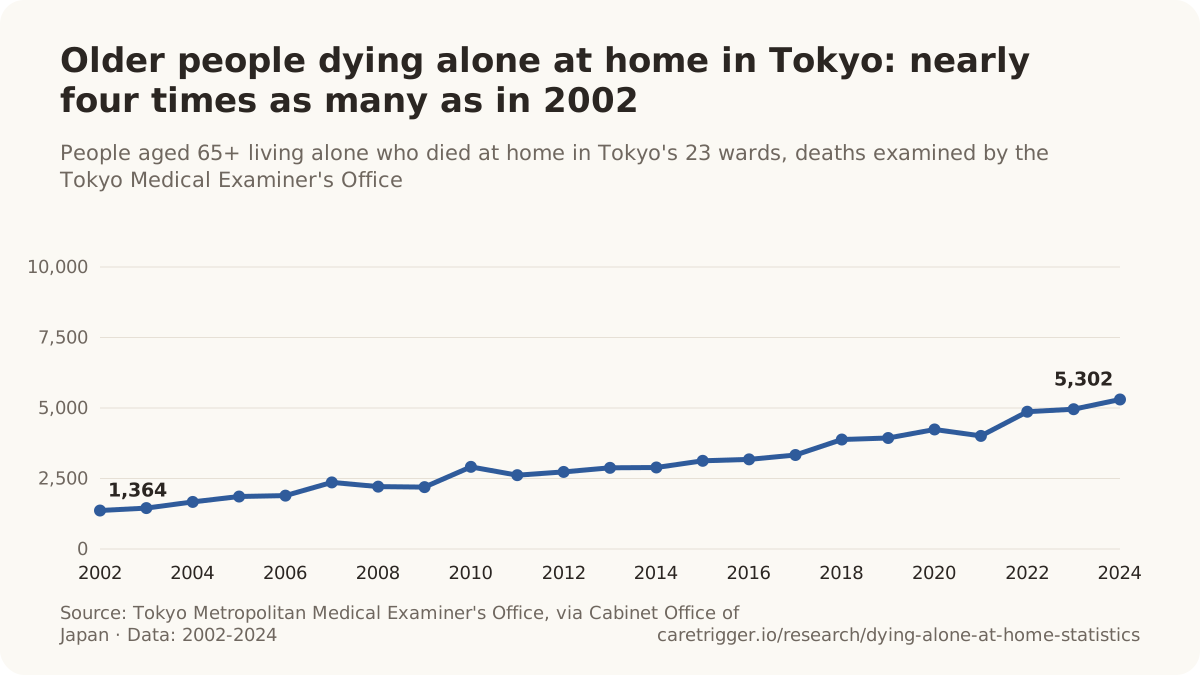
5,302 people aged 65+ who lived alone died at home in Tokyo's 23 wards in 2024, 3.7 times the 1,451 recorded in 2003 (deaths handled by the Tokyo Medical Examiner's Office; Cabinet Office of Japan, 2026).[4]
Every long series points the same way. Counts of older people dying alone at home have risen year after year in Tokyo and Osaka, South Korea's national count has climbed since it began, and the share found late has grown in Kyoto and Tokyo. In Europe, the closest proxies, death certificates with no cause and forensic caseloads of decomposed bodies, have risen too. The pandemic made it worse for a while; the number of older people living alone makes it likely to keep rising.
- 63% more lonely deaths were recorded in South Korea in 2024 than in 2017 (3,924 against 2,412), and the rate rose from 4.7 to 7.7 per 100,000 people (Ministry of Health and Welfare, 2022 and 2025; derived).[5]
- The number of people found dead at home in Sweden a month or more after death rose 57.7% between 2020 and 2025, from 196 to 309 (Rättsmedicinalverket, 2026).[3]
- About 48% of people aged 65+ who lived alone and were found dead or critically ill at home (forensic autopsies, Kyoto, 2009-2013) had gone more than three days before anyone found them, up from about 14% in 1989-1993 (Nomura et al., Science & Justice, 2016).[59]
- About 14% of people aged 65+ who lived alone and were found dead or critically ill at home (forensic autopsies, Kyoto, 1989-1993) had gone more than three days before anyone found them (Nomura et al., Science & Justice, 2016).[59]
- 40.7% of men who died alone at home in Tokyo's 23 wards in 2016-2023 were found within 3 days of death, down from 51.8% in 2005 (Ninomiya et al., Journal of Epidemiology, 2026).[26]
- 51.8% of men who died alone at home in Tokyo's 23 wards in 2005 were found within 3 days of death (Kanawaku et al. 2010, as cited by Ninomiya et al., Journal of Epidemiology, 2026).[26]
- 57.1% of women who died alone at home in Tokyo's 23 wards in 2016-2023 were found within 3 days of death, down from 67.3% in 2005 (Ninomiya et al., Journal of Epidemiology, 2026).[26]
- 67.3% of women who died alone at home in Tokyo's 23 wards in 2005 were found within 3 days of death (Kanawaku et al. 2010, as cited by Ninomiya et al., Journal of Epidemiology, 2026).[26]
- 69.3 per 100,000 men in Tokyo's 23 wards died alone at home in 2016 and were examined by the Tokyo Medical Examiner's Office (crude rate of solitary deaths; Ninomiya et al., Journal of Epidemiology, 2026).[26]
- 29.7 per 100,000 women in Tokyo's 23 wards died alone at home in 2016 and were examined by the Tokyo Medical Examiner's Office (crude rate of solitary deaths; Ninomiya et al., Journal of Epidemiology, 2026).[26]
- 67 people aged 60 and over who died at home and were found with moderate to marked decomposition were autopsied by Forensic Science SA in 2019-2023, 9.6% of its 696 autopsies and up from 27 in 2000-2004 (Byard, J Forensic Leg Med, 2025).[36]
- 27 people aged 60 and over who died at home and were found with moderate to marked decomposition were autopsied by Forensic Science SA in 2000-2004, 1.6% of its 1,673 autopsies (Byard, J Forensic Leg Med, 2025).[36]
- A 93% rise in undiscovered deaths at home was recorded in Gelsenkirchen (Germany) between 2006 and 2016 (129 to 249 a year) while total deaths in the city stayed nearly flat; in Aachen they rose about 36%, in line with total deaths (Loke, 2023).[11]
- 59 people in Gelsenkirchen (Germany) who died alone at home were found 8 or more days after they were last seen alive in 2016, almost three times the 21 of 2006 (Loke, 2023).[11]
- In 2019, 8,819 deaths in Germany were coded R98, 'found dead, cause of death undetermined' (5,698 men, 3,121 women), 0.94% of all 939,520 deaths (Destatis data in the WHO Mortality Database).[86]
- In 1998, 2,590 deaths in Germany were coded R98, 'found dead, cause of death undetermined' (1,541 men, 1,049 women), 0.30% of all 852,382 deaths (Destatis data in the WHO Mortality Database).[86]
- 56% more deaths in England and Wales were coded R98/R99 (a proxy for bodies found too decomposed to establish a cause) in 2018 than in 2001, 1,241 versus 798, within the same ICD-10 coding period (Hiam et al., J R Soc Med, 2024).[87]
- In England and Wales, age-standardised rates of deaths coded R98/R99 ('unattended' / 'ill-defined and unknown cause', a proxy for bodies found too decomposed to ascertain cause) rose from 1979 to 2020 while all other mortality fell; by the 2000s the male rate was more than double the female rate.[52]
- 5.6% a year was the average growth of South Korea's lonely deaths in 2019-2023, down from 8.8% a year in 2017-2021, the period of the first survey (Ministry of Health and Welfare, 2024).[50]
- 1 week: Swedish forensic researchers define an 'isolated death' as one with at least a week between death and discovery; in Stockholm County in 1992-2000 such deaths rose only slightly, and a record of mental disorder was more common among them than among other medicolegal cases (Thiblin et al., Journal of Forensic Sciences, 2004).[88]
- In Vienna, 320 people were found decomposed or mummified at home in 1993-1997 (versus 412 in 1963-1967), with a significantly higher share aged over 64 in the 1990s and a suicide rate nearly three times higher.[89]
- 24,432 men who lived alone died in the Netherlands in 2025, 46.8% more than the 16,639 in 2011; deaths of women living alone rose 21.1% (25,083 to 30,365) (Statistics Netherlands, 2026).[18]
- In 2011, 41,722 people who lived alone died in the Netherlands, 30.7% of all 135,741 deaths (Statistics Netherlands, 2026).[18]
| Period | Lonely deaths | Scope | Source |
|---|---|---|---|
| 2017 | 2,412 deaths | Deaths classified as lonely deaths (고독사) by the national survey of police death-scene records (all ages, any cause including suicide) · South Korea | [27] |
| 2018 | 3,048 deaths | Deaths classified as lonely deaths (고독사) by the national survey of police death-scene records (all ages, any cause including suicide) · South Korea | [27] |
| 2019 | 2,949 deaths | Deaths classified as lonely deaths (고독사) by the national survey of police death-scene records (all ages, any cause including suicide) · South Korea | [27] |
| 2020 | 3,279 deaths | Deaths classified as lonely deaths (고독사) by the national survey of police death-scene records (all ages, any cause including suicide) · South Korea | [5] |
| 2021 | 3,378 deaths | Deaths classified as lonely deaths (고독사) by the national survey of police death-scene records (all ages, any cause including suicide) · South Korea | [27] |
| 2022 | 3,559 deaths | Deaths classified as lonely deaths (고독사) by the national survey of police death-scene records (all ages, any cause including suicide) · South Korea | [50] |
| 2023 | 3,661 persons | Deaths meeting the statutory godoksa definition (all ages) · South Korea | [50] |
| 2024 | 3,924 | Deaths meeting the statutory godoksa definition (all ages) · South Korea | [5] |
| Period | Rate | Scope | Source |
|---|---|---|---|
| 2017 | 4.7 per 100,000 | Deaths classified as lonely deaths (고독사) by the national survey of police death-scene records (all ages, any cause including suicide) · South Korea | [27] |
| 2018 | 5.9 per 100,000 | Deaths classified as lonely deaths (고독사) by the national survey of police death-scene records (all ages, any cause including suicide) · South Korea | [27] |
| 2019 | 5.7 per 100,000 | Deaths classified as lonely deaths (고독사) by the national survey of police death-scene records (all ages, any cause including suicide) · South Korea | [27] |
| 2020 | 6.4 per 100,000 | Deaths classified as lonely deaths (고독사) by the national survey of police death-scene records (all ages, any cause including suicide) · South Korea | [5] |
| 2021 | 6.6 per 100,000 | Deaths classified as lonely deaths (고독사) by the national survey of police death-scene records (all ages, any cause including suicide) · South Korea | [5] |
| 2022 | 6.9 per 100,000 | Deaths classified as lonely deaths (고독사) by the national survey of police death-scene records (all ages, any cause including suicide) · South Korea | [5] |
| 2023 | 7.2 per 100,000 | Deaths classified as lonely deaths (고독사) by the national survey of police death-scene records (all ages, any cause including suicide) · South Korea | [5] |
| 2024 | 7.7 per 100,000 | Deaths classified as lonely deaths (고독사) by the national survey of police death-scene records (all ages, any cause including suicide) · South Korea | [5] |
| Period | Share of deaths | Scope | Source |
|---|---|---|---|
| 2017 | 0.84 per 100 deaths | Deaths classified as lonely deaths (고독사) by the national survey of police death-scene records (all ages, any cause including suicide); denominator: all deaths (KOSTAT cause-of-death statistics) · South Korea | [50] |
| 2018 | 1.02 per 100 deaths | Deaths classified as lonely deaths (고독사) by the national survey of police death-scene records (all ages, any cause including suicide); denominator: all deaths (KOSTAT cause-of-death statistics) · South Korea | [50] |
| 2019 | 1.00 per 100 deaths | Deaths classified as lonely deaths (고독사) by the national survey of police death-scene records (all ages, any cause including suicide); denominator: all deaths (KOSTAT cause-of-death statistics) · South Korea | [50] |
| 2020 | 1.08 per 100 deaths | Deaths classified as lonely deaths (고독사) by the national survey of police death-scene records (all ages, any cause including suicide); denominator: all deaths (KOSTAT cause-of-death statistics) · South Korea | [5] |
| 2021 | 1.06 per 100 deaths | Deaths classified as lonely deaths (고독사) by the national survey of police death-scene records (all ages, any cause including suicide); denominator: all deaths (KOSTAT cause-of-death statistics) · South Korea | [5] |
| 2022 | 0.95 per 100 deaths | Deaths classified as lonely deaths (고독사) by the national survey of police death-scene records (all ages, any cause including suicide); denominator: all deaths (KOSTAT cause-of-death statistics) · South Korea | [5] |
| 2023 | 1.04 per 100 deaths | Deaths classified as lonely deaths (고독사) by the national survey of police death-scene records (all ages, any cause including suicide); denominator: all deaths (KOSTAT cause-of-death statistics) · South Korea | [5] |
| 2024 | 1.09 per 100 deaths | Deaths classified as lonely deaths (고독사) by the national survey of police death-scene records (all ages, any cause including suicide); denominator: all deaths (KOSTAT cause-of-death statistics) · South Korea | [5] |
| Period | People | Scope | Source |
|---|---|---|---|
| 2020 | 196 people | People found dead in a private home in Sweden whose death was investigated by RMV for the police, found at least one month after death (all ages, any manner of death) · Sweden | [3] |
| 2021 | 257 people | People found dead in a private home in Sweden whose death was investigated by RMV for the police, found at least one month after death (all ages, any manner of death) · Sweden | [34] |
| 2022 | 279 people | People found dead in a private home in Sweden whose death was investigated by RMV for the police, found at least one month after death (all ages, any manner of death) · Sweden | [34] |
| 2023 | 288 people | People found dead in a private home in Sweden whose death was investigated by RMV for the police, found at least one month after death (all ages, any manner of death) · Sweden | [34] |
| 2024 | 281 people | People found dead in a private home in Sweden whose death was investigated by RMV for the police, found at least one month after death (all ages, any manner of death) · Sweden | [34] |
| 2025 | 309 | People found dead in a private home in Sweden whose death was investigated by RMV for the police, found at least one month after death (all ages, any manner of death) · Sweden | [3] |
| Period | People | Scope | Source |
|---|---|---|---|
| 2020 | 803 people | People found dead in a private home in Sweden whose death was investigated by RMV for the police, found at least one week after death (all ages, any manner of death) · Sweden | [10] |
| 2021 | 890 people | People found dead in a private home in Sweden whose death was investigated by RMV for the police, found at least one week after death (all ages, any manner of death) · Sweden | [10] |
| 2022 | 939 people | People found dead in a private home in Sweden whose death was investigated by RMV for the police, found at least one week after death (all ages, any manner of death) · Sweden | [10] |
| 2023 | 941 people | People found dead in a private home in Sweden whose death was investigated by RMV for the police, found at least one week after death (all ages, any manner of death) · Sweden | [10] |
| 2024 | 897 people | People found dead in a private home in Sweden whose death was investigated by RMV for the police, found at least one week after death (all ages, any manner of death) · Sweden | [10] |
| Period | People | Scope | Source |
|---|---|---|---|
| 2017 | 1,077 people | People living alone who died at home and were found 4+ days after death, cases handled by the Osaka ME office · Osaka City, Japan (Osaka Medical Examiner's Office cases) | [83] |
| 2018 | 1,240 people | People living alone who died at home and were found 4+ days after death, cases handled by the Osaka ME office · Osaka City, Japan (Osaka Medical Examiner's Office cases) | [83] |
| 2019 | 1,171 people | People living alone who died at home and were found 4+ days after death, cases handled by the Osaka ME office · Osaka City, Japan (Osaka Medical Examiner's Office cases) | [83] |
| 2020 | 1,314 people | People living alone who died at home and were found 4+ days after death, cases handled by the Osaka ME office · Osaka City, Japan (Osaka Medical Examiner's Office cases) | [83] |
| 2021 | 1,307 people | People living alone who died at home and were found 4+ days after death, cases handled by the Osaka ME office · Osaka City, Japan (Osaka Medical Examiner's Office cases) | [83] |
| 2022 | 1,489 people | People living alone who died at home and were found 4+ days after death, cases handled by the Osaka ME office · Osaka City, Japan (Osaka Medical Examiner's Office cases) | [83] |
| 2023 | 1,493 people | People living alone who died at home and were found 4+ days after death, cases handled by the Osaka ME office · Osaka City, Japan (Osaka Medical Examiner's Office cases) | [83] |
| 2024 | 1,591 people | People living alone who died at home and were found 4+ days after death, cases handled by the Osaka ME office · Osaka City, Japan (Osaka Medical Examiner's Office cases) | [83] |
| 2025 | 1,624 people | People living alone who died at home and were found 4+ days after death, cases handled by the Osaka ME office · Osaka City, Japan (Osaka Medical Examiner's Office cases) | [83] |
| Period | Deaths | Scope | Source |
|---|---|---|---|
| 2013 | 1,086 deaths | Deaths of usual residents of England and Wales registered in the year, underlying cause ICD-10 R99, all ages · England and Wales (usual residents) | [14] |
| 2014 | 1,160 deaths | Deaths of usual residents of England and Wales registered in the year, underlying cause ICD-10 R99, all ages · England and Wales (usual residents) | [14] |
| 2015 | 1,117 deaths | Deaths of usual residents of England and Wales registered in the year, underlying cause ICD-10 R99, all ages · England and Wales (usual residents) | [14] |
| 2016 | 1,146 deaths | Deaths of usual residents of England and Wales registered in the year, underlying cause ICD-10 R99, all ages · England and Wales (usual residents) | [14] |
| 2017 | 1,196 deaths | Deaths of usual residents of England and Wales registered in the year, underlying cause ICD-10 R99, all ages · England and Wales (usual residents) | [14] |
| 2018 | 1,309 deaths | Deaths of usual residents of England and Wales registered in the year, underlying cause ICD-10 R99, all ages · England and Wales (usual residents) | [14] |
| 2019 | 1,235 deaths | Deaths of usual residents of England and Wales registered in the year, underlying cause ICD-10 R99, all ages · England and Wales (usual residents) | [14] |
| 2020 | 1,237 deaths | Deaths of usual residents of England and Wales registered in the year, underlying cause ICD-10 R99, all ages · England and Wales (usual residents) | [14] |
| 2021 | 1,119 deaths | Deaths of usual residents of England and Wales registered in the year, underlying cause ICD-10 R99, all ages · England and Wales (usual residents) | [14] |
| 2022 | 1,296 deaths | Deaths of usual residents of England and Wales registered in the year, underlying cause ICD-10 R99, all ages · England and Wales (usual residents) | [14] |
| 2023 | 1,417 deaths | Deaths of usual residents of England and Wales registered in the year, underlying cause ICD-10 R99, all ages · England and Wales (usual residents) | [14] |
| 2024 | 1,288 deaths | Deaths of usual residents of England and Wales registered in the year, underlying cause ICD-10 R99, all ages · England and Wales (usual residents) | [14] |
| 2025 | 1,231 deaths | Deaths of usual residents of England and Wales registered in the year, underlying cause ICD-10 R99, all ages · England and Wales (usual residents) | [14] |
| Period | Deaths | Scope | Source |
|---|---|---|---|
| 2011 | 135 deaths | Deaths registered in Scotland with underlying cause ICD-10 R96-R99, all ages · Scotland | [90] |
| 2012 | 136 deaths | Deaths registered in Scotland with underlying cause ICD-10 R96-R99, all ages · Scotland | [90] |
| 2013 | 115 deaths | Deaths registered in Scotland with underlying cause ICD-10 R96-R99, all ages · Scotland | [90] |
| 2014 | 180 deaths | Deaths registered in Scotland with underlying cause ICD-10 R96-R99, all ages · Scotland | [90] |
| 2015 | 202 deaths | Deaths registered in Scotland with underlying cause ICD-10 R96-R99, all ages · Scotland | [90] |
| 2016 | 182 deaths | Deaths registered in Scotland with underlying cause ICD-10 R96-R99, all ages · Scotland | [90] |
| 2017 | 190 deaths | Deaths registered in Scotland with underlying cause ICD-10 R96-R99, all ages · Scotland | [90] |
| 2018 | 236 deaths | Deaths registered in Scotland with underlying cause ICD-10 R96-R99, all ages · Scotland | [90] |
| 2019 | 191 deaths | Deaths registered in Scotland with underlying cause ICD-10 R96-R99, all ages · Scotland | [90] |
| 2020 | 202 deaths | Deaths registered in Scotland with underlying cause ICD-10 R96-R99, all ages · Scotland | [90] |
| 2021 | 198 deaths | Deaths registered in Scotland with underlying cause ICD-10 R96-R99, all ages · Scotland | [90] |
| 2022 | 214 deaths | Deaths registered in Scotland with underlying cause ICD-10 R96-R99, all ages · Scotland | [90] |
| 2023 | 235 deaths | Deaths registered in Scotland with underlying cause ICD-10 R96-R99, all ages · Scotland | [90] |
| 2024 | 203 | Deaths registered in Scotland with underlying cause ICD-10 R96-R99, all ages · Scotland | [90] |
| Period | Deaths | Scope | Source |
|---|---|---|---|
| 1995 | 326 deaths | All registered deaths in Japan with underlying cause ICD-10 R98 (unattended death) · Japan | [85] |
| 2005 | 1,211 deaths | All registered deaths in Japan with underlying cause ICD-10 R98 (unattended death) · Japan | [91] |
| 2015 | 2,433 deaths | All registered deaths in Japan with underlying cause ICD-10 R98 (unattended death) · Japan | [92] |
| 2025 | 4,415 deaths | All registered deaths in Japan with underlying cause ICD-10 R98 (unattended death) · Japan | [84] |
The pandemic
- At a central London mortuary, markedly decomposed bodies among coronial autopsies rose 70.5% in the year after the first UK lockdown (23 March 2020) versus the year before, alongside a 38% rise in home deaths and a 52.4% fall in hospital deaths coming to autopsy.[93]
- 12% of coronial autopsies in the London area in the months after the March 2020 lockdown (35 of 290) showed advanced decomposition, up from 5.1% (15 of 290) in the months before (Bates, Academic Forensic Pathology, 2023).[94]
- 105,211 more deaths from causes other than COVID-19 than expected occurred in private homes in England and Wales from March 2020 to December 2022, 29.1% above the five-year average, while hospitals recorded 77,718 fewer (Office for National Statistics, 2023).[95]
- 5,813 more deaths than expected from 'symptoms, signs and ill-defined conditions' occurred in private homes in England and Wales from March 2020 to December 2022, 50.1% above the five-year average (Office for National Statistics, 2023).[95]
- 41,321 more deaths than the 2015-2019 average were registered in private homes in England and Wales in 2020 (166,576 in total, 33% above average); private homes were the only place where deaths stayed above average in every month from January 2020 to June 2021 (Office for National Statistics, 2021).[96]
- 27% more people died at home in Italy in March-April 2020 than the 2015-2019 average for those months, while deaths in care homes rose 155% and in hospitals 46% (ISTAT, 2021).[97]
The next twenty years
- 4,961,000 South Korean households are projected to be a person aged 65+ living alone in 2052, 2.6 times the 1,923,000 of 2022 (Statistics Korea household projections, 2024).[99]
- 973,000 people aged 85 and over in England are projected to live alone in 2032, up 40% from 693,000 in 2022 (ONS 2022-based household projections, 2025).[100]
- 21.1 million white and Black Americans aged 50+ could have no living partner or children by 2060, up from 14.9 million in 2015, according to demographic microsimulation (Verdery & Margolis, PNAS, 2017).[101]
- 6.3 million white and Black Americans aged 50+ could have no living partner, children, siblings or parents by 2060, up from 1.8 million in 2015 (Verdery & Margolis, PNAS, 2017).[101]
- 6.6% of US adults aged 55 and over had neither a living spouse nor biological children in 1998-2010, and 1% had no partner, children, siblings or parents at all (Margolis & Verdery, Journals of Gerontology: Series B, 2017).[102]
- 15,784,869 U.S. adults aged 65 and over lived alone in 2024 (U.S. Census Bureau, American Community Survey 2024 1-year estimates, Table B09021).[103]
- 31.26 million people aged 65+ in the EU-27 lived alone (one adult, no resident children) in 2025, out of 97.18 million aged 65+ - 32.2% (Eurostat LFS, lfst_hhindws).[104]
- 4.25 million people aged 65 and over lived alone in the UK in 2025 (ONS Labour Force Survey, Families and households Table 6).[105]
- 2,456,000 South Korean households were a person aged 65+ living alone on 1 November 2025, 10.9% of all 22,495,000 ordinary households and up 7.3% in one year (2025 register-based census).[107]
- 1,698,970 Canadians aged 65 and over lived alone in 2021, 25.8% of the 6,586,870 people aged 65+ in private households (Statistics Canada, 2021 Census, 2022).[108]
- 27.6% of Australians aged 65 and over living in households lived alone in 2022 (ABS Survey of Disability, Ageing and Carers, 2024).[109]
- 25.3% of New Zealanders aged 65 and over lived alone in 2023, down from 28.8% in 2013 (Stats NZ, 2023 Census, 2024).[110]
- About 192,200 New Zealanders aged 65 and over lived alone in 2023, two-thirds of them women (127,536) (Stats NZ, 2023 Census, 2024).[110]
- 2,089,175 households in Spain consisted of one person aged 65 or over living alone on 1 January 2021, 22.2% more than in 2011; 70.8% were women (INE Census 2021, 2023).[111]
- 88,400 Singapore residents aged 65 and over lived alone in 2025, 11.5% of the 768,800 residents of that age in resident households (Singapore Department of Statistics, 2026; derived share).[112]
- 63,800 Singapore residents aged 65 and over lived alone in 2020, 10.2% of the 622,900 residents of that age in resident households (Singapore Department of Statistics, 2026; derived share).[112]
- 41,200 Singapore residents aged 65 and over lived alone in 2015, 8.9% of the 460,900 residents of that age in resident households (Singapore Department of Statistics, 2026; derived share).[112]
- 27,900 Singapore residents aged 65 and over lived alone in 2010, 8.2% of the 340,700 residents of that age in resident households (Singapore Department of Statistics, 2026; derived share).[112]
- Around 87,000 Singapore residents aged 65 and above were living alone in 2024, according to the Ministry of Health's reply to a parliamentary question on preventing seniors from dying alone.[113]
- 188,569 people aged 65 and over in Hong Kong lived alone in 2021, 13.0% of all older persons (Census and Statistics Department, 2023).[114]
- 119,376 people aged 65 and over lived alone in Hong Kong in 2011 (one-person households), against 188,569 in 2021 (Census and Statistics Department, 2023).[115]
- 594,300 one-person households existed in Hong Kong in 2024, up 38.4% from 429,500 in 2015, and more than half of them (52.9%) were people aged 60 or over (LegCo Research Office, 2025, from Census and Statistics Department data).[116]
- 571,074 people aged 65 and over in Taiwan lived alone in 2020, 15.6% of the 65+ population and 63.0% more than in 2010 (Directorate-General of Budget, Accounting and Statistics, 2021).[117]
- 350,264 people aged 65 and over in Taiwan lived alone in 2010, 14.3% of the 65+ population (Directorate-General of Budget, Accounting and Statistics, 2021).[117]
- 299,328 people aged 65 and over in Taiwan lived alone in 2000, 15.9% of the 65+ population (Directorate-General of Budget, Accounting and Statistics, 2021).[117]
- 976,925 people aged 65 and over in Taiwan were registered as the only member of their household at the end of June 2023, 23.3% of 4,188,314 people aged 65+ (Ministry of the Interior, 2024).[118]
- 29,938,548 households in mainland China consisted of one person aged 65 or over living alone in 2020, 22.5% of the 132,865,245 family households with a member aged 65+ and about twice the 14,439,685 of 2010 (National Bureau of Statistics, 2020 census; derived share).[119]
- 14,439,685 households in mainland China consisted of a single person aged 65 or over (单身老人户) in 2010 (National Bureau of Statistics, 2010 census).[120]
06 / Comparing countries
How do countries compare, and why do their numbers differ?
Only 14 US deaths in 2022 were assigned ICD-10 R98 ('unattended death') as the underlying cause; the code was used 10 to 19 times a year in 2018-2022 and fewer than 10 times a year in 2023-2024 (CDC WONDER, NCHS, 2026).[122]
Each country counts something different. Japan's police count every person living alone who dies at home, whatever the cause and however soon they are found; the Cabinet Office narrows that to people found after eight days or more. South Korea's law counts people who lived socially isolated lives, whenever they were found. Sweden counts bodies found a week or a month after death, whether or not the person lived alone. Elsewhere, statisticians can only see deaths that ended with no known cause, which catches some bodies found late and misses the rest.
| Country and measure | Latest figure | Scope | Source |
|---|---|---|---|
| Japan: everyone living alone who died at home and was handled by police, any cause (2025) | 76,941 | People living alone who died at home, all ages, all causes (police-handled bodies) · Japan · 2025 | [1] |
| Japan: the same deaths found 8 or more days later (Cabinet Office estimate, 2025) | 22,222 | People living alone who died at home and were found >=8 days after death (all ages) · Japan · 2025 | [9] |
| South Korea: lonely deaths under the 2021 Act, socially isolated in life, any interval (2024) | 3,924 | Deaths meeting the statutory godoksa definition (all ages) · South Korea · 2024 | [5] |
| Sweden: found dead at home a month or more after death, whether or not living alone (2025) | 309 | People found dead in a private home in Sweden whose death was investigated by RMV for the police, found at least one month after death (all ages, any manner of death) · Sweden · 2025 | [3] |
| Sweden: found dead at home a week or more after death (2024) | 897 people | People found dead in a private home in Sweden whose death was investigated by RMV for the police, found at least one week after death (all ages, any manner of death) · Sweden · 2024 | [10] |
| Germany: deaths coded R98, found dead with the cause undetermined (2025) | 6,013 deaths coded R98 | All deaths registered in Germany with underlying cause ICD-10 R98 (unattended death: body found, cause not established) · Germany · 2025 | [13] |
| Germany, two cities: died alone at home, found the next day or later (2006-2016) | about 1 in 20 deaths | Adults (18+) who died alone in their own home or its immediate surroundings (cellar, garage, garden) and were found the next day or later, with at least 12 hours between last sighting and discovery ('unentdeckte Tode'); all causes including suicide; denominator: all deaths registered by the city registry office · Aachen and Gelsenkirchen (North Rhine-Westphalia), Germany · 2006-2016 | [11] |
| England and Wales: deaths coded R99, cause ill-defined or unknown (2025) | 1,231 deaths | Deaths of usual residents of England and Wales registered in the year, underlying cause ICD-10 R99, all ages · England and Wales (usual residents) · 2025 | [14] |
| Scotland: deaths coded R96-R99, cause ill-defined or unknown (2024) | 203 | Deaths registered in Scotland with underlying cause ICD-10 R96-R99, all ages · Scotland · 2024 | [90] |
| Amsterdam: bodies unnoticed at home for 14 days or more | 5.3 per 100,000 a year | Domestic-setting corpses with post-mortem interval >=14 days · Amsterdam and surrounding municipalities, Netherlands · study period per forensic register (published 2019) | [15] |
| Valencian Community, Spain: people 65+ living alone found dead at home (2017) | 13.2 per 100,000 aged 65+ | Residents aged 65+ living alone whose bodies were found at home, any interval after death · Valencian Community, Spain · 2017 | [16] |
| Portugal, cities policed by the PSP: people over 65 who died alone at home (2024) | 262 | People aged over 65 who died alone at home, known to the PSP · Portugal (PSP area: cities and larger towns) · 2024 | [17] |
| South Australia: people 60+ found decomposed at home, autopsied (2019-2023) | 67 | Autopsies of people aged 60+ who died at home with moderate to marked decomposition · South Australia (Forensic Science SA, Adelaide) · 2019-2023 | [36] |
| United States: deaths coded R98, unattended death (2022) | 14 | Deaths of US residents with underlying cause ICD-10 R98 ('Unattended death') · United States · 2022 | [122] |
Why raw counts mislead. Set side by side, Japan's count looks twenty times South Korea's, but the two measure different things: Japan's includes everyone living alone who died at home, found within the hour or after a year, while South Korea's requires a socially isolated life and excludes people with regular contact. Sweden's counts every body found late, whether the person lived alone or not. The coding proxies in England, Wales, Scotland and Germany see only deaths that ended with no known cause, and a coroner can often still find a cause in a body found late, so those series run well below the real number. Compare each country with itself over time, not with the others.
Definitions
- South Korea's statutory definition of a lonely death: 'a person who lived in social isolation, cut off from family, relatives and others around them, dying by suicide, illness or other cause', with no minimum days-to-discovery.[5]
- Since 6 February 2024, South Korea's legal definition of a lonely death no longer requires the body to be found 'after a certain period of time'; a June 2023 amendment had already replaced 'living alone' with 'living in social isolation' (Ministry of Health and Welfare, 2024).[50]
- In force since 1 April 2021, South Korea's Act on the Prevention and Management of Lonely Deaths (enacted 31 March 2020) made a national lonely-death survey a legal duty (Korea Institute for Health and Social Affairs for MOHW, 2022 survey report).[124]
- 3 days after death is the local yardstick Seoul and Busan used to judge whether a body was found 'after a certain time', since the national law set no threshold (Ministry of Health and Welfare, 2023).[67]
- 51 lonely deaths were counted in Seoul in 2020 under the city's own district statistics, down from 83 in 2018 and 69 in 2019 (Seoul Metropolitan Government, 2021).[55]
- 5.3% of 978 deaths at home among Seoul welfare recipients living alone in 2020 (52) were lonely deaths found three or more days after death (Seoul Welfare Foundation, 2021).[125]
- 24 hours: German forensic researchers propose defining a 'domestic-setting corpse' (Wohnungsleiche) as a body found in a private home more than 24 hours after death, after a review of German- and English-language forensic journals found 37 qualifying cases (Merz et al., Archiv für Kriminologie, 2011).[126]
- In the ICD-10 used for German death statistics, code R98 'Tod ohne Anwesenheit anderer Personen' (unattended death) covers a body that was found and a person found dead whose cause of death could not be established (BfArM / WHO ICD-10).[127]
- 0 death certificates naming 'unattended death' (ICD-10 R98) reached ONS coders in the two years to October 2023; causes certified as 'decomposed', 'unascertained' or 'skeleton found' are coded R99 instead, so R99 is the only code that captures bodies too decomposed to diagnose in England and Wales (ONS correspondence published by Hiam et al., 2024).[128]
- In 2024, 5,409 deaths at home in the United States were assigned an ill-defined or unknown underlying cause (ICD-10 R99), 49.5% of all 10,921 R99 deaths (CDC WONDER, NCHS, 2026).[122]
- In 1999, 5,492 deaths at home in the United States were assigned an ill-defined or unknown underlying cause (ICD-10 R99), 40.6% of all 13,511 R99 deaths (CDC WONDER, NCHS, 2021).[129]
- 46% of people found dead in the City of Copenhagen had an unknown cause of death on their death certificate (58% in rural Storstrom County), in a three-month study of 1994 certificates that found higher found-dead rates in the city and most bodies in the person's own home (Smith et al., Ugeskrift for Laeger, 2001).[130]
- Danish death certificates were 13.2 times as likely as Finnish ones to carry an ill-defined or unknown cause of death (ICD-10 R00-R99) in 2010 (odds ratio; 18.6 in 2000, 9.5 in 2005) (Ylijoki-Sørensen et al., Forensic Science International, 2014).[131]
- 88.3% of Finnish deaths coded as ill-defined or unknown cause (R00-R99) were investigated by forensic autopsy, versus 3.5% of such Danish deaths by any autopsy (Ylijoki-Sørensen et al., Forensic Science International, 2014).[131]
- Around 3,760 unclaimed dead bodies were on Hong Kong's official list as at September 2025, and the territory keeps no systematic record of solitary deaths, so their number may be underestimated (LegCo Research Office, 2025).[116]
- 7 of 17 Japanese definitions of kodokushi published in 1994-2016 required that the body lay undiscovered for a considerable period, while 11 required that no one was present at the death, 5 that it happened at home and 4 that the person lived alone (Yamazaki and Hemmi, Journal of the Japan Academy of Health Behavioral Science, 2017).[132]
- 16.8% of 960 Japanese municipalities answering a 2008 national survey had carried out, were carrying out or planned a fact-finding survey of kodokushi, so most had no count of such deaths (Fukukawa and Kawaguchi, Japanese Journal of Public Health, 2011).[133]
- 16 studies met the criteria of a 2025 scoping review of solitary death among people living in the community; 53.3% were from Japan and about 60% were retrospective (Cho et al., Global Public Health, 2025).[134]
- Across the four largest Dutch cities, the incidence of single-household bodies found 14+ days after death was similar in Amsterdam, The Hague and Rotterdam and almost twice that of Utrecht (IRR 1.9, 95% CI 1.1-3.0).[135]
- 17.3 per 100,000 residents aged 65+ (European age-standardised) was the rate of solitary deaths, people living alone found dead at home, in Spain's Valencian Community in 2015 (Esteve-Esteve et al., Revista Española de Salud Pública, 2021).[16]
- 14.5 per 100,000 residents aged 65+ (European age-standardised) was the rate of solitary deaths, people living alone found dead at home, in Spain's Valencian Community in 2016 (Esteve-Esteve et al., Revista Española de Salud Pública, 2021).[16]
- 7.7 lonely deaths per 100,000 population were recorded in South Korea in 2024 (Ministry of Health and Welfare, 2025).[5]
- 1.09 of every 100 deaths in South Korea in 2024 were lonely deaths (Ministry of Health and Welfare, 2025).[5]
07 / After a late discovery
What happens when someone is found too late?
27.4% of men (8,833 of 32,288) and 16.6% of women (2,321 of 13,947) who died alone at home in Tokyo's 23 wards in 2016-2023 had an unknown manner of death, mainly because of advanced decomposition (Ninomiya et al., Journal of Epidemiology, 2026).[26]
Time does two kinds of damage. For people found alive, every extra hour on the floor raises the chance of dying, and most of those found after three days in the one population study that measured it did not survive. For people found dead, the delay erases the evidence: the longer a body lies undiscovered, the more often an autopsy cannot say what happened, and the more often a death certificate records only that the cause is unknown.
- 36.5% of solitary home deaths in Tokyo's 23 wards that occurred in summer (4,412 of 12,090) had an unknown manner of death, versus 13.7% of those in winter (1,922 of 14,046), 2016-2023 (Ninomiya et al., Journal of Epidemiology, 2026).[26]
- 92.9% of autopsies at the most advanced stage of brain decomposition on post-mortem CT ended with an undetermined cause of death, against 7.1% with no brain decomposition, in 176 adult autopsies in Gunma, Japan (Fukuda et al., Legal Medicine, 2025).[136]
- 20-30% of autopsies of people aged 65+ found dead at home in Kyoto in 2009-2013 ended with an unknown cause of death, against none in 1989-1993; the authors link this to longer intervals before discovery (Nomura et al., Science & Justice, 2016).[59]
- 30.7% of 88 people aged 65+ found decomposed after non-traumatic deaths at home in Trabzon, Turkey (2014-2023) had no determinable cause of death at autopsy (27 cases), against a negative-autopsy rate of about 4-5% reported for general forensic practice (Vural and Kalkan, BMC Geriatrics, 2026).[38]
- 80% of decomposed bodies autopsied in Lyon still had a cause of death established, and 86.6% a manner of death, in a series of 350 cases (Maujean et al., Am J Forensic Med Pathol, 2016).[137]
- 350 decomposed bodies underwent medicolegal autopsy in Lyon over five years; most were socially isolated mature men discovered at home (Maujean et al., Am J Forensic Med Pathol, 2016).[137]
- 89% of 629 decomposed bodies autopsied at Forensic Science SA in Adelaide over 1994-2004 had their cause of death ascertained; in 6% (35 cases) neither the cause nor the manner of death could be determined (Byard et al., Forensic Science, Medicine and Pathology, 2008).[138]
- 88% of autopsies that ended with an unascertained cause of death were on decomposed bodies (398 of 450) in the published series pooled by Estrin-Serlui et al. (J Clin Pathol, 2024).[139]
- 8.7% of 913 routine adult coronial autopsies at a London hospital mortuary in 2019 and April 2022-March 2023 were on decomposed bodies (79 cases) (Estrin-Serlui et al., J Clin Pathol, 2024).[139]
- 90% of coronial post-mortems recorded as '1a unascertained' in a London study during the COVID-19 pandemic were attributed to severe decomposition (Estrin-Serlui and Osborn 2023, as reported by Hiam et al., Journal of the Royal Society of Medicine, 2024).[52]
- 16% of severely decomposed bodies in a London coronial autopsy series had an 'unascertained' cause of death; for the rest a cause could still be given (Estrin-Serlui and Osborn 2023, as reported by Hiam et al., Journal of the Royal Society of Medicine, 2024).[52]
- 4.5% of 1,390 forensic autopsies in Aydin, Turkey (2004-2008) were of decomposed bodies (62); 91.9% were men, 38.7% had lived alone and 57.9% were found at home (Erel et al., Ulusal Travma ve Acil Cerrahi Dergisi, 2011).[54]
- 46% of all forensic autopsies at the Homburg Institute of Legal Medicine (Germany) in 2014-2018 were of people found dead in their homes (491 of 1,057); their mean age was 52, about 25 years below the average age at death in Germany, and 69% were men (Umstaetter, 2025).[37]
- 147,814 deaths were reported to coroners in England and Wales in 2025, 26% of all registered deaths and the lowest number since the series began in 1995 (Ministry of Justice, 2026).[141]
- 75,852 post-mortem examinations were ordered by coroners in England and Wales in 2025, in 51% of the deaths reported to them (Ministry of Justice, 2026).[141]
| Period | People | Scope | Source |
|---|---|---|---|
| 2021 | 7,544 people | People living alone (all ages) whose deaths were examined by the Tokyo ME office (unnatural or unexplained deaths), any place of death · Tokyo, Japan (23 special wards) | [70] |
| 2022 | 8,762 people | People living alone (all ages) whose deaths were examined by the Tokyo ME office (unnatural or unexplained deaths), any place of death · Tokyo, Japan (23 special wards) | [70] |
| 2023 | 8,908 people | People living alone (all ages) whose deaths were examined by the Tokyo ME office (unnatural or unexplained deaths), any place of death · Tokyo, Japan (23 special wards) | [70] |
| 2024 | 9,074 people | People living alone (all ages) whose deaths were examined by the Tokyo ME office (unnatural or unexplained deaths), any place of death · Tokyo, Japan (23 special wards) | [70] |
When the person is found alive
Among people living alone who were found helpless or dead at home in San Francisco in 1993, total mortality was 67% for those estimated to have been helpless for more than 72 hours, versus 12% for those helpless for less than 1 hour (Gurley et al., NEJM, 1996).[49]
The only population study of people living alone found helpless or dead at home comes from San Francisco paramedics in 1993; it is the source of the much-quoted link between time on the floor and death. Our statistics page on falls and the long lie goes deeper on what happens to people who fall and cannot get up.
- When the time spent helpless at home was estimated at under 1 hour, total mortality was 12% (10% found dead, 2% died in hospital) among people living alone found helpless or dead in San Francisco, 1993 (Gurley et al., NEJM, 1996).[49]
- Of 387 episodes of people living alone being found helpless or dead at home in San Francisco in 1993, 23% were found dead and a further 5% died in hospital, a total mortality of 28% (Gurley et al., NEJM, 1996).[49]
- 62% of survivors of being found helpless at home were unable to return to independent living (Gurley et al., NEJM, 1996; San Francisco, 1993).[49]
- Of people hospitalised after being found helpless at home, two thirds either died or did not return to independent living (Gurley et al., NEJM, 1996; San Francisco, 1993).[49]
- Of people found alive but helpless at home, 62% were admitted to hospital, with an average stay of eight days (Gurley et al., NEJM, 1996; San Francisco, 1993).[49]
- 52% of hospital-admitted people who had been found helpless at home required intensive care, with an average ICU stay of seven days (Gurley et al., NEJM, 1996; San Francisco, 1993).[49]
- In-hospital mortality was 10% overall and 16% among those requiring intensive care, for people admitted after being found helpless at home (Gurley et al., NEJM, 1996; San Francisco, 1993).[49]
- Of survivors discharged to supportive care after being found helpless at home, 77% went to nursing homes, skilled-nursing or rehabilitation facilities and only 4% to live with family or friends (Gurley et al., NEJM, 1996).[49]
- Dehydration was diagnosed in 42 of 261 people (16%) transported to hospital after being found helpless at home; decubitus ulcers in 10 and aspiration pneumonia in 10 (Gurley et al., NEJM, 1996).[49]
- The estimated average cost of care for each person found helpless at home was $9,985 (70% of 1993 charges for paramedic, hospital and ICU days) in San Francisco (Gurley et al., NEJM, 1996).[49]
- Among people aged 65 or older living alone, 31.6 per 1,000 per year were found helpless or dead at home (men 42.2, women 27.6 per 1,000) in San Francisco, 1993 (Gurley et al., NEJM, 1996).[49]
- The annual rate of being found helpless or dead at home rose from 3 per 1,000 people aged 60-64 to 27 per 1,000 aged 85 and over, in San Francisco in 1993 (Gurley et al., NEJM, 1996).[49]
- Among men aged 85 or older living alone, the rate of being found helpless or dead at home was 123 per 1,000 per year (women 85+ living alone: 59 per 1,000) in San Francisco, 1993 (Gurley et al., NEJM, 1996).[49]
- San Francisco paramedics identified 387 events in which 367 people were found helpless or dead in their homes over 12 weeks (Gurley et al., NEJM, 1996).[49]
- Only one of the 367 people found helpless or dead at home in the San Francisco study possessed a commercially available device to summon help (Gurley et al., NEJM, 1996).[49]
08 / Unclaimed
Who claims the body, and who pays for the funeral?
About 42,000 bodies in Japan (41,969) had no one to claim them in FY2023 and were cremated or buried by local governments, equal to 2.7% of the 1,576,016 deaths in 2023 (Japan Research Institute for the Ministry of Health, Labour and Welfare, 2025).[6]
When no relative comes forward, or one does and refuses, the state buries or cremates the body. These are not counts of deaths that went unnoticed, since many unclaimed people die in hospital, but they are the clearest official trace of people who died with no one to arrange their funeral, and they are rising in every country that publishes them.
| Place and measure | Share of deaths | Scope | Source |
|---|---|---|---|
| Japan: bodies no one claimed, cremated or buried by local governments (FY2023) | 41,969 | Deceased with no one to arrange the funeral, cremated/buried by municipalities under the Burial Act art. 9, the Act on Sick and Dead Travellers, or Public Assistance Act art. 18(2) · Japan · fiscal year 2023 (April 2023 to March 2024) | [6] |
| Los Angeles County: deaths left to the county (sampled years, 1976-2013) | 2.37% of deaths | Deaths at ages 15+ in Los Angeles County (Vital Statistics) matched to the County's records of unclaimed deaths · Los Angeles County, California, USA · 1976-2013 (sampled years, about every third year) | [142] |
| US counties that keep records: unclaimed deaths (2009-2021) | 1.2 % of all deaths | All deaths in counties that provided unclaimed-death records directly (excluding NamUs-only counties) · United States (more than 248 counties covering about 22% of the population) · 2009-2021 | [143] |
| The Bronx and Manhattan: unclaimed deaths (2020) | more than 4% of deaths | All deaths in the Bronx, New York (Manhattan) and Los Angeles counties · United States (more than 248 counties covering about 22% of the population) · 2009-2021 | [143] |
| England: public health funerals (2020/21) | 12.6 per 1,000 deaths | Public health funerals (councils and NHS trusts) per 1,000 deaths, all ages · England · 2020/21 | [144] |
| London: public health funerals (2020/21) | 30.4 per 1,000 deaths | Public health funerals (councils and NHS trusts) per 1,000 deaths, all ages · London, England · 2020/21 | [144] |
| Camden, London: public health funerals (2014/15-2020/21) | 99.5 per 1,000 deaths | Public health funerals per 1,000 deaths, all ages, local authority district · Camden, London · 2014/15-2020/21 | [144] |
Unclaimed is not the same as undiscovered. An unclaimed body is one no relative took responsibility for; most were found promptly, many in hospital. A body found late may well be claimed. The two overlap, which is why unclaimed counts are often cited in reporting on lonely deaths, but neither stands in for the other.
Japan and South Korea
- 7,171 unclaimed deceased were recorded in South Korea in 2025, nearly double the 3,603 of 2021 (Ministry of Health and Welfare data, reported 2026).[147]
- 74.9% of South Korea's 7,171 unclaimed deceased in 2025 (5,370) had relatives who refused or avoided claiming the body; 18.7% (1,338) had no relatives and 6.5% (463) had relatives who could not be found (Ministry of Health and Welfare data, reported 2026).[147]
- 60.1% of South Korea's unclaimed deceased in 2025 were aged 65 or over (4,310), up from 51.2% (1,845) in 2021, a 133.6% rise in four years (Ministry of Health and Welfare data, reported 2026).[147]
- 70% of unclaimed deceased are to receive a public funeral by 2027 under South Korea's funeral-facilities plan, up from 42% in 2021 (Ministry of Health and Welfare, 2023).[148]
- 667 unclaimed deceased, which Seoul treats as possible lonely deaths, were recorded in Seoul in 2020, up from 389 in 2018 and 417 in 2019 (Seoul Metropolitan Government, 2021).[55]
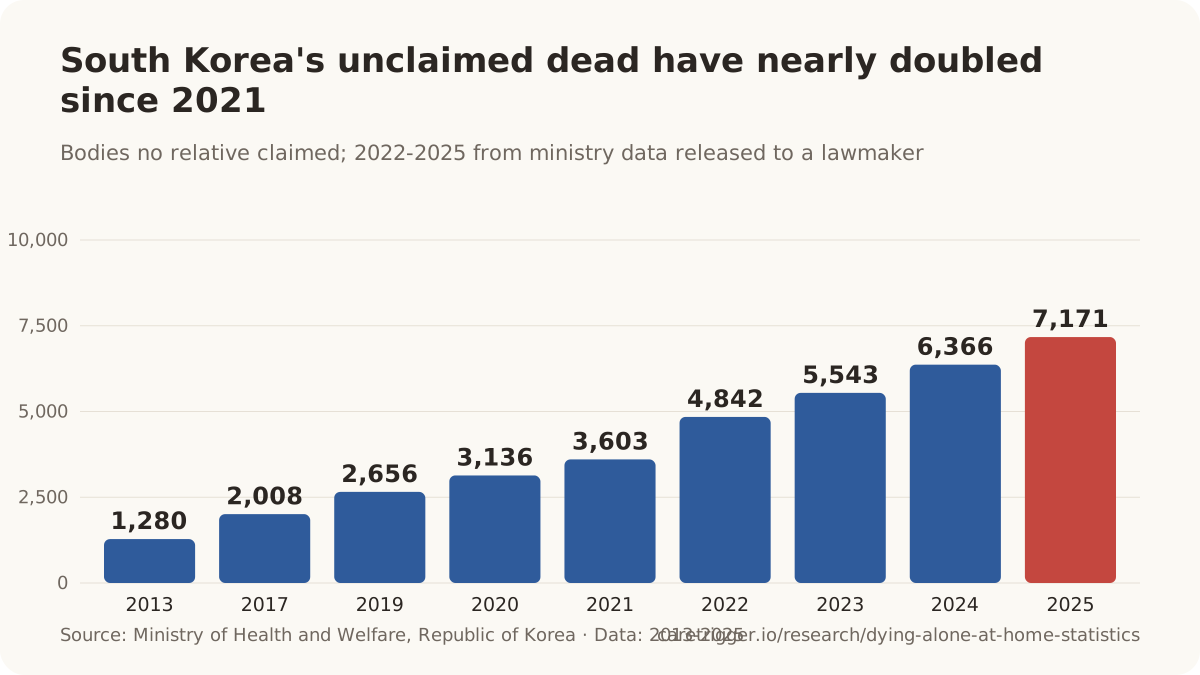
| Period | Unclaimed deceased | Scope | Source |
|---|---|---|---|
| 2013 | 1,280 unclaimed deceased | Unclaimed deceased (무연고 사망자): no relatives, relatives unknown, or relatives refusing or avoiding to claim the body (Funeral Act), all ages and places of death · South Korea | [148] |
| 2017 | 2,008 unclaimed deceased | Unclaimed deceased (무연고 사망자): no relatives, relatives unknown, or relatives refusing or avoiding to claim the body (Funeral Act), all ages and places of death · South Korea | [148] |
| 2019 | 2,656 unclaimed deceased | Unclaimed deceased (무연고 사망자): no relatives, relatives unknown, or relatives refusing or avoiding to claim the body (Funeral Act), all ages and places of death · South Korea | [67] |
| 2020 | 3,136 unclaimed deceased | Unclaimed deceased (무연고 사망자): no relatives, relatives unknown, or relatives refusing or avoiding to claim the body (Funeral Act), all ages and places of death · South Korea | [67] |
| 2021 | 3,603 unclaimed deceased | Unclaimed deceased (무연고 사망자): no relatives, relatives unknown, or relatives refusing or avoiding to claim the body (Funeral Act), all ages and places of death · South Korea | [67] |
| 2022 | 4,842 unclaimed deceased | Unclaimed deceased (무연고 사망자): no relatives, relatives unknown, or relatives refusing or avoiding to claim the body (Funeral Act), all ages and places of death · South Korea | [147] |
| 2023 | 5,543 unclaimed deceased | Unclaimed deceased (무연고 사망자): no relatives, relatives unknown, or relatives refusing or avoiding to claim the body (Funeral Act), all ages and places of death · South Korea | [147] |
| 2024 | 6,366 unclaimed deceased | Unclaimed deceased (무연고 사망자): no relatives, relatives unknown, or relatives refusing or avoiding to claim the body (Funeral Act), all ages and places of death · South Korea | [147] |
| 2025 | 7,171 unclaimed deceased | Unclaimed deceased (무연고 사망자): no relatives, relatives unknown, or relatives refusing or avoiding to claim the body (Funeral Act), all ages and places of death · South Korea | [147] |
United States and Canada
- 42,942 unclaimed deaths recorded by more than 248 US counties in 2009-2021 show unclaimed deaths rising, especially since 2016, with the highest rates in 2020 (Brite, Heiland and Balk, 2025).[143]
- 72% of unclaimed decedents in the US county records were men, and their median age at death was 65 (Brite, Heiland and Balk, 2025).[143]
- 3.14% of male deaths in Los Angeles County went unclaimed, about double the 1.54% of female deaths (sampled years 1976-2013) (Sohn, Timmermans and Prickett, PLOS ONE, 2020).[142]
- 3.16% of deaths in Los Angeles County went unclaimed in 2009, the peak of a rise from about 1.15% in the late 1970s (Sohn, Timmermans and Prickett, PLOS ONE, 2020).[142]
- 2,529 adults who died in New York City in epidemiological year 2020 were buried as unclaimed on Hart Island, the City's public cemetery, 2.7 times the 939 of 2019 (Heiland, Brite and Balk, Scientific Reports, 2026).[149]
- 939 adults who died in New York City in epidemiological year 2019 were buried as unclaimed on Hart Island, the City's public cemetery (Heiland, Brite and Balk, Scientific Reports, 2026).[149]
- 862 adults who died in New York City in epidemiological year 2018 were buried as unclaimed on Hart Island, the City's public cemetery (Heiland, Brite and Balk, Scientific Reports, 2026).[149]
- 22 unclaimed deaths for every one in the same week of 2019 (20 to 1 after adjustment) were recorded on Hart Island at the April 2020 peak of New York City's first COVID-19 wave (Heiland, Brite and Balk, 2026).[149]
- An estimated 10% of all COVID-related excess deaths in New York City during the initial outbreak (March-August 2020) were unclaimed (Heiland, Brite and Balk, 2026).[149]
- 73.6% of the unclaimed adults buried on Hart Island in 2018-2020 were men, and their average age at death was 68.6 (Heiland, Brite and Balk, 2026).[149]
- Up to 3 times as likely to go unclaimed: that was the risk for people who died on extreme-heat days in New York City, compared with other days (Heiland et al., Demography, 2026).[150]
- 1,213 people were buried on Hart Island, New York City's public cemetery for the unclaimed and unidentified, in 2018 (New York City Council Data Team).[151]
- About 62% of people buried on Hart Island in 2018 had next of kin who opted for a public burial; for another 33% the next of kin was unknown or unreachable (New York City Council Data Team).[151]
- 65 was the average age at death of people buried on Hart Island in 2016, against a US average of roughly 79 (New York City Council Data Team).[151]
- In 2023, 1,979 people were buried on Hart Island, up from just over 1,300 in each of 2021 and 2022 (NYC Human Resources Administration data via THE CITY, 2024).[152]
- In 2020, 2,743 people were buried on Hart Island, more than double the 1,138 of 2019 (NYC Human Resources Administration data via THE CITY, 2024).[152]
- In 2019, 1,138 people were buried on Hart Island, New York City's public cemetery (NYC Human Resources Administration data via THE CITY, 2024).[152]
- 2,308 unclaimed people were buried as cremated remains by Los Angeles County in a single communal grave in December 2025 (County of Los Angeles, 2025).[153]
- 1,865 unclaimed people were buried as cremated remains by Los Angeles County in a single communal grave in December 2024 (County of Los Angeles, 2024).[154]
- 1,937 unclaimed people who died in 2020 were buried as cremated remains by Los Angeles County in a single communal grave in December 2023 (County of Los Angeles, 2023).[155]
- 1,624 unclaimed people who died in 2019 were buried as cremated remains by Los Angeles County in a single communal grave in December 2022 (County of Los Angeles, 2022).[156]
- In 37% of Ontario's unclaimed-body cases in 2023 no next of kin could be found; in the rest, relatives were found but could not claim the body because of estrangement, health, travel or money (Office of the Chief Coroner, via CBC News, 2024).[157]
- 150 unclaimed bodies were taken in charge by Quebec's Bureau du coroner in 2023, up from 133 in 2020 (coroner data obtained by access-to-information request; Namian and Perreault, Revue du CREMIS, 2025).[158]
| Period | Unclaimed bodies | Scope | Source |
|---|---|---|---|
| 2019 | 438 unclaimed bodies | Deceased persons in Ontario with no claimant (coroner and non-coroner cases) · Ontario, Canada | [157] |
| 2020 | 691 unclaimed bodies | Deceased persons in Ontario with no claimant · Ontario, Canada | [159] |
| 2022 | 983 unclaimed bodies | Deceased persons in Ontario with no claimant (coroner and non-coroner cases) · Ontario, Canada | [157] |
| 2023 | 1,183 unclaimed bodies | Deceased persons in Ontario with no claimant (coroner and non-coroner cases) · Ontario, Canada | [157] |
| 2025 | 1,710 unclaimed bodies | Deceased persons in Ontario with no claimant · Ontario, Canada | [159] |
| Period | Unclaimed bodies | Scope | Source |
|---|---|---|---|
| 2018 | 525 unclaimed bodies | Bodies under the Medical Examiner's jurisdiction left unclaimed (disposed of through the County's indigent program) · Cook County (Chicago), Illinois, USA | [160] |
| 2019 | 283 unclaimed bodies | Bodies under the Medical Examiner's jurisdiction left unclaimed (disposed of through the County's indigent program) · Cook County (Chicago), Illinois, USA | [161] |
| 2020 | 773 unclaimed bodies | Bodies under the Medical Examiner's jurisdiction left unclaimed (disposed of through the County's indigent program) · Cook County (Chicago), Illinois, USA | [162] |
| 2021 | 204 unclaimed bodies | Bodies under the Medical Examiner's jurisdiction left unclaimed (disposed of through the County's indigent program) · Cook County (Chicago), Illinois, USA | [163] |
| 2022 | 243 unclaimed bodies | Bodies under the Medical Examiner's jurisdiction left unclaimed (disposed of through the County's indigent program) · Cook County (Chicago), Illinois, USA | [164] |
| 2023 | 388 unclaimed bodies | Bodies under the Medical Examiner's jurisdiction left unclaimed (disposed of through the County's indigent program) · Cook County (Chicago), Illinois, USA | [165] |
| 2024 | 340 unclaimed bodies | Bodies under the Medical Examiner's jurisdiction left unclaimed (disposed of through the County's indigent program) · Cook County (Chicago), Illinois, USA | [166] |
| Period | Unclaimed decedents | Scope | Source |
|---|---|---|---|
| 2020 | 309 unclaimed decedents | Decedents under OCME jurisdiction (non-natural and unattended natural deaths) left unclaimed · San Francisco, California, USA | [167] |
| 2021 | 378 unclaimed decedents | Decedents under OCME jurisdiction (non-natural and unattended natural deaths) left unclaimed · San Francisco, California, USA | [167] |
| 2022 | 384 unclaimed decedents | Decedents under OCME jurisdiction (non-natural and unattended natural deaths) left unclaimed · San Francisco, California, USA | [167] |
| 2023 | 409 unclaimed decedents | Decedents under OCME jurisdiction (non-natural and unattended natural deaths) left unclaimed · San Francisco, California, USA | [167] |
England, Europe and Australia
- 2,600 of the estimated 4,400 public health funerals held by councils in England in 2022/23 (about 59%) were for people aged 65 and over; 1,700 were for people aged 16-64 (Local Government Association, 2024).[7]
- 62% of English councils said 'lack of family or friends to provide a funeral' was the most commonly cited reason for the public health funerals they arranged in 2022/23, up from 58% in 2019/20 (Local Government Association, 2024).[7]
- 73% of English councils said a breakdown of family or friendship was the most common reason relatives gave for refusing to pay for a public health funeral in 2022/23 (Local Government Association, 2024).[7]
- GBP 5.96 million was spent by councils in England on public health funerals in 2022/23, up from GBP 4.50 million in 2019/20 (Local Government Association, 2024).[7]
- An estimated 2,200 public health funerals were conducted by local authorities in England and Wales in 2009/10, broadly the same as in the two previous years (Local Government Association, 2010).[168]
- 3 public health funerals for men were held for every 1 for a woman, on average, by local authorities in England and Wales in 2007/08-2009/10 (Local Government Association, 2010).[168]
- GBP 959 was the calculated average cost of a public health funeral to local authorities in England and Wales in 2009/10 (Local Government Association, 2010).[168]
- GBP 983 was the estimated average cost to the NHS of each public health funeral arranged by a hospital trust in England in 2014/15-2020/21, about GBP 1.36 million a year (Centre for Population Change, 2025).[144]
- In 2021, Berlin's 12 district offices arranged 2,733 municipal burials (ordnungsbehoerdliche Bestattungen) for people whose relatives could not be found in time or did not arrange a burial (Senate of Berlin, 2022).[169]
- In 2020, Berlin's 12 district offices arranged 2,614 municipal burials (ordnungsbehoerdliche Bestattungen) for people whose relatives could not be found in time or did not arrange a burial (Senate of Berlin, 2022).[169]
- 2.31 million euros in cash costs were reported by Berlin's district offices for 2,733 municipal burials in 2021, about 846 euros per burial before any recovery from relatives (Senate of Berlin, 2022).[169]
- About 2,700 people a year in Berlin are buried by the district offices because no relatives could be found, according to the Marzahn-Hellersdorf district office, which alone buried more than 155 such people in 2025 (Bezirksamt Marzahn-Hellersdorf, 2025).[170]
- About 1,700 people a year die in Hamburg without relatives or with relatives who cannot be traced, and are buried 'von Amts wegen' (by the authorities) at Oejendorf cemetery (Hamburg Parliament, 2024).[171]
- 360 people who died in Paris in 2024 with no relatives found were buried by the City at Thiais cemetery, up from 242 in 2019 (Collectif Les Morts de la Rue, 2025).[175]
- 276 people without means were buried (91) or cremated (185) through NSW Health's destitute-person program in New South Wales in 2022-23 (Cemeteries & Crematoria NSW, 2024).[179]
- 333 people without means were buried (71) or cremated (262) through NSW Health's destitute-person program in New South Wales in 2020-21 (Cemeteries & Crematoria NSW, 2023).[180]
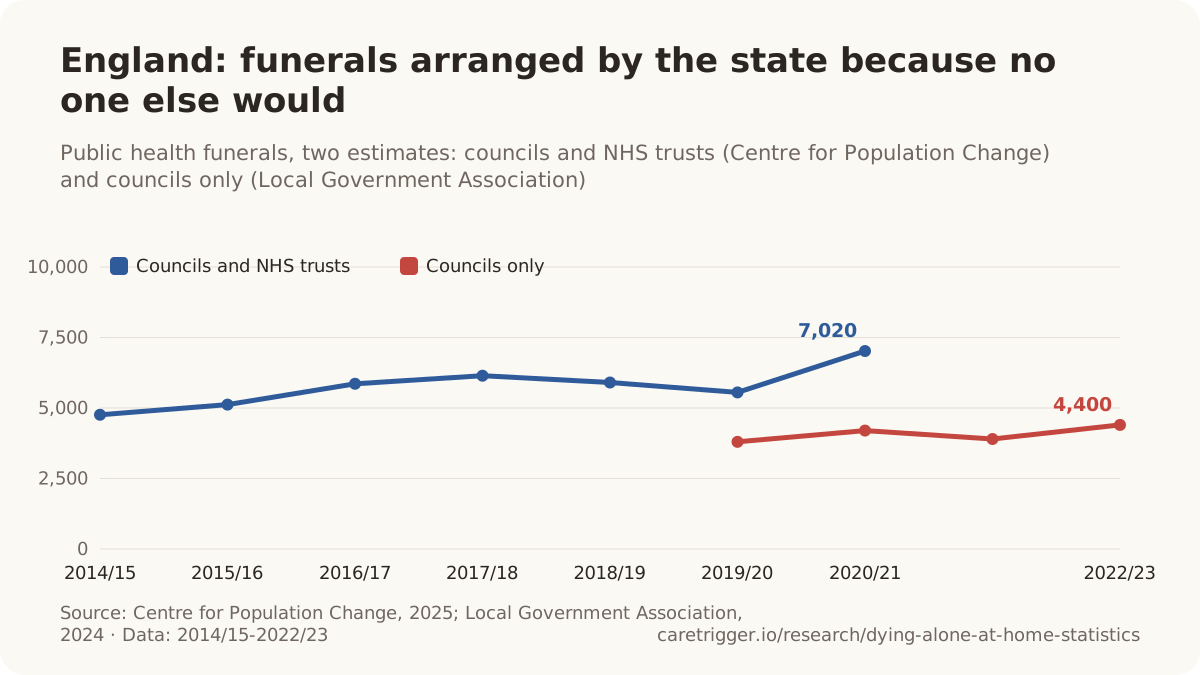
| Period | Average cost | Scope | Source |
|---|---|---|---|
| 2019/20 | £1,200 | Public health funerals arranged by councils · England | [7] |
| 2020/21 | £1,300 | Public health funerals arranged by councils · England | [7] |
| 2021/22 | £1,500 | Public health funerals arranged by councils · England | [7] |
| 2022/23 | £1,600 | Council public health funerals in England · England | [7] |
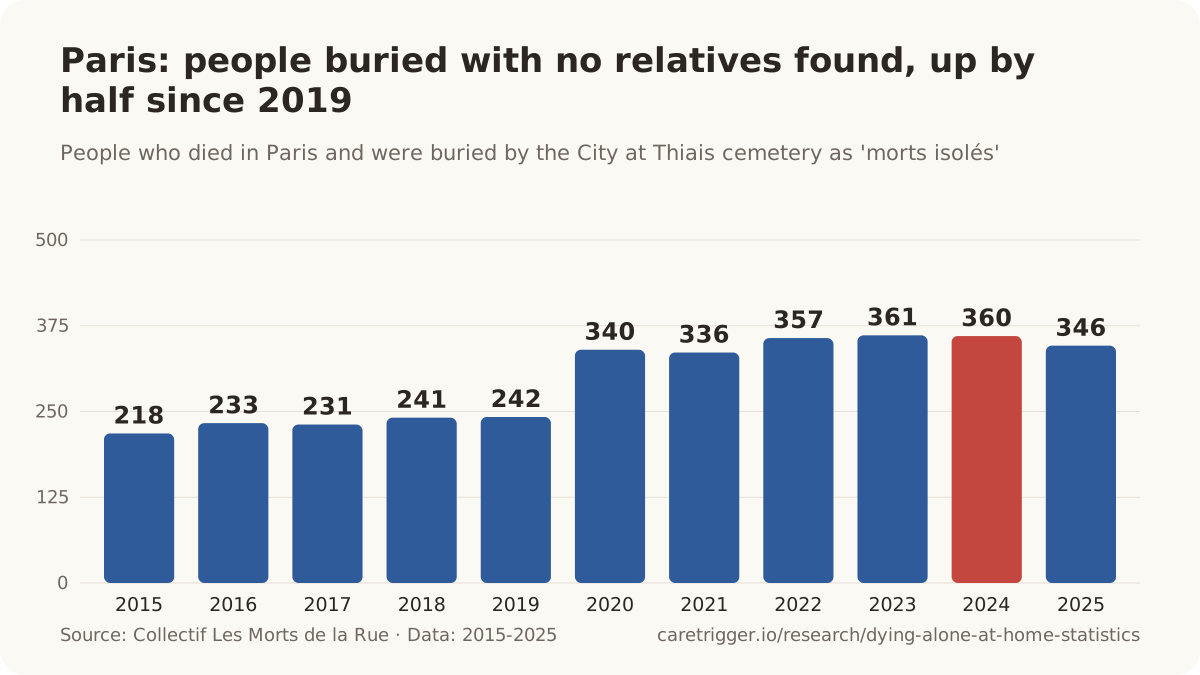
| Period | Funerals | Scope | Source |
|---|---|---|---|
| 2020 | 305 council-paid funerals (no family) | Deceased whose families disclaimed them or did not come forward within 30 days · Milan, Italy | [181] |
| 2021 | 174 council-paid funerals (no family) | Deceased whose families disclaimed them or did not come forward within 30 days · Milan, Italy | [181] |
| 2022 | 172 council-paid funerals (no family) | Deceased whose families disclaimed them or did not come forward within 30 days · Milan, Italy | [181] |
| 2023 | 163 council-paid funerals (no family) | Deceased whose families disclaimed them or did not come forward within 30 days · Milan, Italy | [181] |
09 / Place of death
Where do people die, and where do they want to die?
In 2024, 1,054,545 deaths in the United States, 34.3% of all 3,072,666 deaths, occurred in the decedent's home (CDC WONDER, NCHS, 2026).[122]
Dying at home is what most people say they want, and in many rich countries it has become more common again after decades of hospital deaths. Most of those deaths are expected and attended. But more deaths at home also means more deaths where no professional is present, and for the growing number of people who live alone, a death at home can mean no one is there at all.
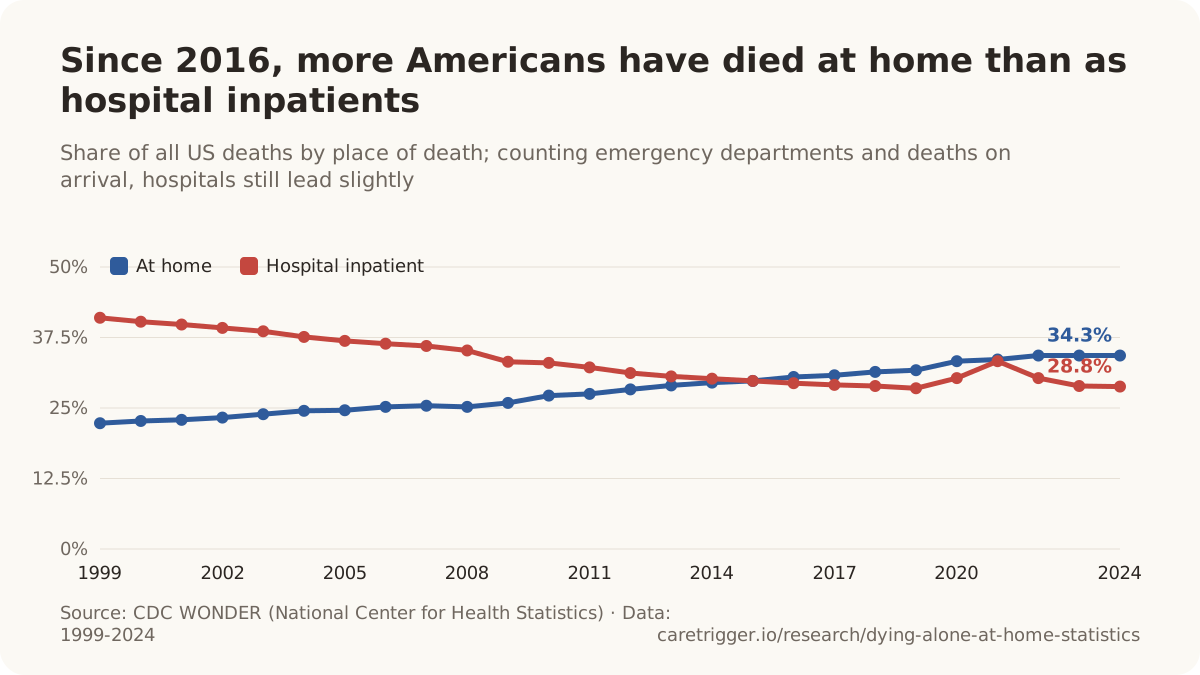
- In 2016, for the first time in CDC WONDER data going back to 1999, more US deaths occurred in the decedent's home (836,348) than among hospital inpatients (807,428) (CDC WONDER, NCHS, 2021).[129]
- In 2024, 1,068,208 US deaths occurred in medical facilities (as inpatients, in outpatient or emergency departments, or on arrival), slightly more than the 1,054,545 that occurred at home (CDC WONDER, NCHS, 2026).[122]
- 31.4% of US deaths in 2018 occurred in the decedent's home, up from 22.7% in 2000 (deaths with a known place, excluding deaths on arrival) (NCHS QuickStats, MMWR, 2020).[182]
- 33% of US deaths in 2018-2022 (5,212,129 of 15,821,860 with an identified place) occurred at home, and home deaths rose significantly over the period (Adekoya and Chang, Public Health Reports, 2026).[183]
- 160,502 people died in private homes in England and Wales in 2025, 28.1% of all 570,988 registered deaths (any cause, all ages; Office for National Statistics, 2026).[184]
- 129,087 people aged 65 and over died in private homes in England and Wales in 2025, 26.7% of the 483,509 deaths at that age (any cause; Office for National Statistics, 2026).[184]
- 95,665 people aged 65 and over died in private homes in England and Wales in 2016, 21.6% of the 443,525 deaths at that age (any cause; Office for National Statistics, 2026).[184]
- 20,013 people in Scotland died at home or in another non-institutional place in 2024, 32.1% of all 62,291 deaths (National Records of Scotland, 2025).[185]
- 16,153 people in Scotland died at home or in another non-institutional place in 2019, 27.8% of all 58,108 deaths (National Records of Scotland, 2025).[185]
- 14,080 people in Scotland died at home or in another non-institutional place in 2000, 24.4% of all 57,799 deaths (National Records of Scotland, 2025).[185]
- 5,661 people in Northern Ireland died at home in 2024, 31.4% of all 18,050 registered deaths (Northern Ireland Statistics and Research Agency, 2025).[186]
- 4,367 people in Northern Ireland died at home in 2019, 27.7% of all 15,758 registered deaths (Northern Ireland Statistics and Research Agency, 2025).[186]
- 3,888 people in Northern Ireland died at home in 2014, 26.5% of all 14,678 registered deaths (Northern Ireland Statistics and Research Agency, 2025).[186]
- 183,361 people died at home in France in 2024 (their own home or someone else's), 28.5% of all 643,168 deaths (INSEE, 2025).[187]
- 152,533 people aged 65 and over died at home in France in 2024, 27.7% of the 551,626 deaths at that age and 83% of all home deaths (INSEE, 2025).[188]
- In 2019, 49,780 deaths in the Netherlands (32.8% of 151,885) took place at home (Statistics Netherlands, 2020).[190]
- In 2025 only 17.5% of deaths in Vienna occurred at home (2,874 of 16,467), against 32.1% in rural Burgenland (1,115 of 3,469) (Statistik Austria, 2026).[192]
- 28.1% of male deaths and 24.8% of female deaths in Austria in 2016 occurred in private households, so men were more likely to die at home (Lang, Institute for Advanced Studies, 2018, from Statistik Austria data).[193]
- About 20% of people in Switzerland die at home or elsewhere outside an institution; around 40% die in hospital and 40% in a nursing home, roughly 26,000 people a year in each (Swiss Federal Council, 2020).[194]
- About 15 years younger on average: people who die at home in Switzerland are about 73, against 87 for those who die in nursing homes (Swiss Federal Council, 2020).[194]
- 19% of people aged 65+ who died in Switzerland in 2016 died at home or somewhere other than a hospital (37%) or nursing home (44%) (Swiss Health Observatory, 2019).[195]
- Only 14.6% of deaths in the city of Muenster (Germany) occurred at home in 2021, down from 24.0% in 2001, according to all death certificates issued in the city (Dasch, 2024).[197]
- About half of deaths from natural causes in Denmark in 2012-2020 occurred at the person's home address, a category that includes nursing-home residents, while the hospital share fell from 46% to 40% (REHPA, 2024).[198]
- Only 14% of Australians aged 65 and over who died in Victoria and Queensland in 2016-17 died somewhere other than a hospital or residential aged care; 50% died in hospital and 36% in residential aged care (AIHW, 2021).[202]
- 33.1% of adult deaths in Northern Ireland took place at home in 2020-2021, up from 27.5% in 2018-2019, the largest pandemic increase of the 29 countries with trend data (Lopes et al., EClinicalMedicine, 2024).[203]
- 31.9% of men who died in the 32 countries in 2012-2021 died at home, against 30.5% of women; men were more likely to die at home in 19 of 29 countries (Lopes et al., EClinicalMedicine, 2024).[203]
- Between 13% (Canada) and 53% (Mexico) of people who died in 2008 from conditions indicating a need for palliative care died at home across 14 countries, while hospital deaths ranged from 25% (the Netherlands) to 85% (South Korea) (Pivodic et al., J Epidemiol Community Health, 2016).[204]
- 54% or more of all deaths occurred in hospital in half of 45 populations compared internationally, ranging from 78% in Japan to 20% in China, with over 16 million deaths covered (Broad et al., International Journal of Public Health, 2013).[205]
- 36% of deaths in the Netherlands in 2017 occurred at home and 35% in long-term care facilities, giving the Netherlands the lowest hospital share of deaths among OECD countries studied (OECD, 2023).[206]
- 47% of deaths in Chile in 2017 occurred at home, the highest share among OECD countries reported (OECD, 2023).[206]
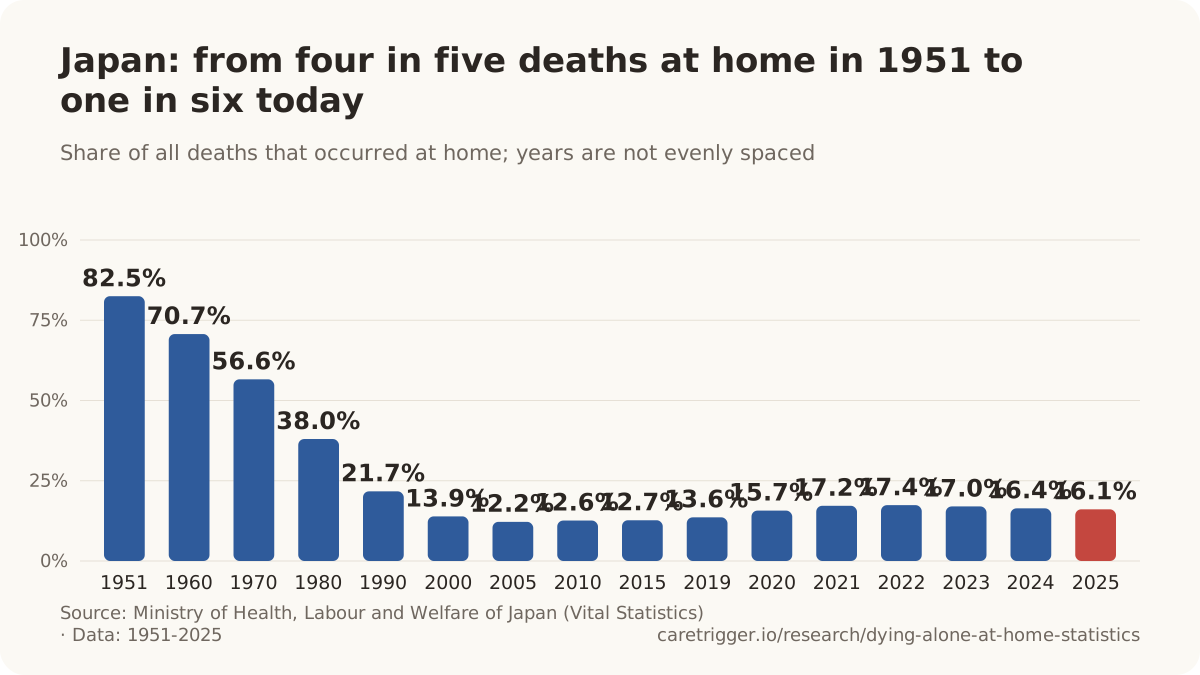
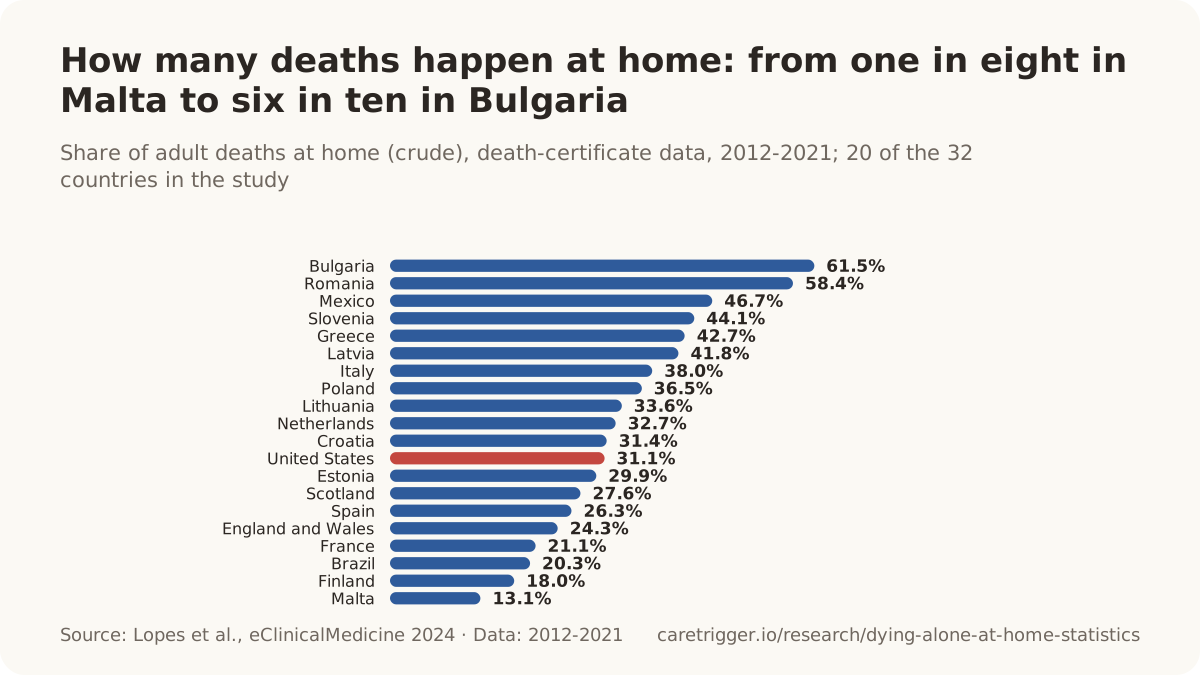
| Geography | At home | Scope | Source |
|---|---|---|---|
| Bulgaria | 61.5% | All deaths of adults aged 18+ registered on death certificates, 2012-2021 pooled · 2012-2021 | [203] |
| Romania | 58.4% | All deaths of adults aged 18+ registered on death certificates, 2012-2021 pooled · 2012-2021 | [203] |
| Mexico | 46.7% | Deaths of adults (18+; 20+ in Brazil) with place of death on the death certificate · 2012-2021 | [203] |
| Slovenia | 44.1% | All deaths of adults aged 18+ registered on death certificates, 2012-2021 pooled · 2012-2021 | [203] |
| Greece | 42.7% | All deaths of adults aged 18+ registered on death certificates, 2012-2021 pooled · 2012-2021 | [203] |
| Latvia | 41.8% | All deaths of adults aged 18+ registered on death certificates, 2012-2021 pooled · 2012-2021 | [203] |
| Italy | 38% | All deaths of adults aged 18+ registered on death certificates, 2012-2021 pooled · 2012-2021 | [203] |
| Poland | 36.5% | All deaths of adults aged 18+ registered on death certificates, 2012-2021 pooled · 2012-2021 | [203] |
| Lithuania | 33.6% | All deaths of adults aged 18+ registered on death certificates, 2012-2021 pooled · 2012-2021 | [203] |
| Netherlands | 32.7% | All deaths of adults aged 18+ registered on death certificates, 2012-2021 pooled · 2012-2021 | [203] |
| Croatia | 31.4% | All deaths of adults aged 18+ registered on death certificates, 2012-2021 pooled · 2012-2021 | [203] |
| United States | 31.1% | Deaths of adults (18+; 20+ in Brazil) with place of death on the death certificate · 2012-2021 | [203] |
| Estonia | 29.9% | All deaths of adults aged 18+ registered on death certificates, 2012-2021 pooled · 2012-2021 | [203] |
| Slovakia | 28.4% | All deaths of adults aged 18+ registered on death certificates, 2012-2021 pooled · 2012-2021 | [203] |
| Northern Ireland | 28.4% | All deaths of adults aged 18+ registered on death certificates, 2012-2021 pooled · 2012-2021 | [203] |
| Scotland | 27.6% | All deaths of adults aged 18+ registered on death certificates, 2012-2021 pooled · 2012-2021 | [203] |
| Austria | 26.6% | All deaths of adults aged 18+ registered on death certificates, 2012-2021 pooled · 2012-2021 | [203] |
| Spain | 26.3% | All deaths of adults aged 18+ registered on death certificates, 2012-2021 pooled · 2012-2021 | [203] |
| Portugal | 25.2% | All deaths of adults aged 18+ registered on death certificates, 2012-2021 pooled · 2012-2021 | [203] |
| England and Wales | 24.3% | All deaths of adults aged 18+ registered on death certificates, 2012-2021 pooled · 2012-2021 | [203] |
| Denmark | 24.2% | All deaths of adults aged 18+ registered on death certificates, 2012-2021 pooled · 2012-2021 | [203] |
| Belgium | 22.8% | All deaths of adults aged 18+ registered on death certificates, 2012-2021 pooled · 2012-2021 | [203] |
| Czechia | 21.8% | All deaths of adults aged 18+ registered on death certificates, 2012-2021 pooled · 2012-2021 | [203] |
| France | 21.1% | All deaths of adults aged 18+ registered on death certificates, 2012-2021 pooled · 2012-2021 | [203] |
| Brazil | 20.3% | Deaths of adults (18+; 20+ in Brazil) with place of death on the death certificate · 2012-2021 | [203] |
| Cyprus | 19.1% | All deaths of adults aged 18+ registered on death certificates, 2012-2021 pooled · 2012-2021 | [203] |
| Sweden | 18.7% | All deaths of adults aged 18+ registered on death certificates, 2012-2021 pooled · 2012-2021 | [203] |
| Luxembourg | 18.1% | All deaths of adults aged 18+ registered on death certificates, 2012-2021 pooled · 2012-2021 | [203] |
| Finland | 18% | All deaths of adults aged 18+ registered on death certificates, 2012-2021 pooled · 2012-2021 | [203] |
| Malta | 13.1% | All deaths of adults aged 18+ registered on death certificates, 2012-2021 pooled · 2012-2021 | [203] |
| Period | Deaths | Scope | Source |
|---|---|---|---|
| 2001 | 99,314 deaths | Deaths registered in private homes (the deceased's own residence), any cause, all ages, including non-residents · England and Wales | [207] |
| 2002 | 97,815 deaths | Deaths registered in private homes (the deceased's own residence), any cause, all ages, including non-residents · England and Wales | [207] |
| 2003 | 97,238 deaths | Deaths registered in private homes (the deceased's own residence), any cause, all ages, including non-residents · England and Wales | [207] |
| 2004 | 94,182 deaths | Deaths registered in private homes (the deceased's own residence), any cause, all ages, including non-residents · England and Wales | [207] |
| 2005 | 94,245 deaths | Deaths registered in private homes (the deceased's own residence), any cause, all ages, including non-residents · England and Wales | [207] |
| 2006 | 95,439 deaths | Deaths registered in private homes (the deceased's own residence), any cause, all ages, including non-residents · England and Wales | [207] |
| 2007 | 98,271 deaths | Deaths registered in private homes (the deceased's own residence), any cause, all ages, including non-residents · England and Wales | [207] |
| 2008 | 101,090 deaths | Deaths registered in private homes (the deceased's own residence), any cause, all ages, including non-residents · England and Wales | [207] |
| 2009 | 99,592 deaths | Deaths registered in private homes (the deceased's own residence), any cause, all ages, including non-residents · England and Wales | [207] |
| 2010 | 102,416 deaths | Deaths registered in private homes (the deceased's own residence), any cause, all ages, including non-residents · England and Wales | [207] |
| 2011 | 105,354 deaths | Deaths registered in private homes (the deceased's own residence), any cause, all ages, including non-residents · England and Wales | [207] |
| 2012 | 110,111 deaths | Deaths registered in private homes (the deceased's own residence), any cause, all ages, including non-residents · England and Wales | [207] |
| 2013 | 113,071 deaths | Deaths registered in private homes (the deceased's own residence), any cause, all ages, including non-residents · England and Wales | [207] |
| 2014 | 114,589 deaths | Deaths registered in private homes (the deceased's own residence), any cause, all ages, including non-residents · England and Wales | [207] |
| 2015 | 120,630 deaths | Deaths registered in private homes (the deceased's own residence), any cause, all ages, including non-residents · England and Wales | [207] |
| 2016 | 122,714 deaths | Deaths registered in private homes, any cause, all ages, including non-residents · England and Wales | [184] |
| 2017 | 125,623 deaths | Deaths registered in private homes, any cause, all ages, including non-residents · England and Wales | [184] |
| 2018 | 128,388 deaths | Deaths registered in private homes, any cause, all ages, including non-residents · England and Wales | [184] |
| 2019 | 128,918 deaths | Deaths registered in private homes, any cause, all ages, including non-residents · England and Wales | [184] |
| 2020 | 166,576 deaths | Deaths registered in private homes, any cause, all ages, including non-residents · England and Wales | [184] |
| 2021 | 168,280 deaths | Deaths registered in private homes, any cause, all ages, including non-residents · England and Wales | [184] |
| 2022 | 165,232 deaths | Deaths registered in private homes, any cause, all ages, including non-residents · England and Wales | [184] |
| 2023 | 164,854 deaths | Deaths registered in private homes, any cause, all ages, including non-residents · England and Wales | [184] |
| 2024 | 159,543 deaths | Deaths registered in private homes, any cause, all ages, including non-residents · England and Wales | [184] |
| 2025 | 160,502 deaths | Deaths registered in private homes, any cause, all ages, including non-residents · England and Wales | [184] |
| Period | Deaths at home | Scope | Source |
|---|---|---|---|
| 2006 | 20,404 deaths at place of residence | All deaths of people with main residence in Austria, by place of death ('Am Wohnort gestorben') · Austria | [192] |
| 2007 | 20,627 deaths at place of residence | All deaths of people with main residence in Austria, by place of death ('Am Wohnort gestorben') · Austria | [192] |
| 2008 | 20,216 deaths at place of residence | All deaths of people with main residence in Austria, by place of death ('Am Wohnort gestorben') · Austria | [192] |
| 2009 | 20,598 deaths at place of residence | All deaths of people with main residence in Austria, by place of death ('Am Wohnort gestorben') · Austria | [192] |
| 2010 | 20,712 deaths at place of residence | All deaths of people with main residence in Austria, by place of death ('Am Wohnort gestorben') · Austria | [192] |
| 2011 | 20,598 deaths at place of residence | All deaths of people with main residence in Austria, by place of death ('Am Wohnort gestorben') · Austria | [192] |
| 2012 | 21,241 deaths at place of residence | All deaths of people with main residence in Austria, by place of death ('Am Wohnort gestorben') · Austria | [192] |
| 2013 | 21,430 deaths at place of residence | All deaths of people with main residence in Austria, by place of death ('Am Wohnort gestorben') · Austria | [192] |
| 2014 | 21,412 deaths at place of residence | All deaths of people with main residence in Austria, by place of death ('Am Wohnort gestorben') · Austria | [192] |
| 2015 | 21,558 deaths at place of residence | All deaths of people with main residence in Austria, by place of death ('Am Wohnort gestorben') · Austria | [192] |
| 2016 | 21,280 deaths at place of residence | All deaths of people with main residence in Austria, by place of death ('Am Wohnort gestorben') · Austria | [192] |
| 2017 | 21,843 deaths at place of residence | All deaths of people with main residence in Austria, by place of death ('Am Wohnort gestorben') · Austria | [192] |
| 2018 | 21,568 deaths at place of residence | All deaths of people with main residence in Austria, by place of death ('Am Wohnort gestorben') · Austria | [192] |
| 2019 | 20,971 deaths at place of residence | All deaths of people with main residence in Austria, by place of death ('Am Wohnort gestorben') · Austria | [192] |
| 2020 | 23,437 deaths at place of residence | All deaths of people with main residence in Austria, by place of death ('Am Wohnort gestorben') · Austria | [192] |
| 2021 | 23,955 deaths at place of residence | All deaths of people with main residence in Austria, by place of death ('Am Wohnort gestorben') · Austria | [192] |
| 2022 | 24,508 deaths at place of residence | All deaths of people with main residence in Austria, by place of death ('Am Wohnort gestorben') · Austria | [192] |
| 2023 | 23,443 deaths at place of residence | All deaths of people with main residence in Austria, by place of death ('Am Wohnort gestorben') · Austria | [192] |
| 2024 | 22,907 deaths at place of residence | All deaths of people with main residence in Austria, by place of death ('Am Wohnort gestorben') · Austria | [192] |
| 2025 | 22,123 deaths at place of residence | All deaths of people with main residence in Austria, by place of death ('Am Wohnort gestorben') · Austria | [192] |
| Period | At home | Scope | Source |
|---|---|---|---|
| 1975 | 53.2% | All deaths occurring in metropolitan France (civil registration), all ages · Metropolitan France | [187] |
| 1980 | 32.8% | All deaths occurring in metropolitan France (civil registration), all ages · Metropolitan France | [187] |
| 1985 | 30.4% | All deaths occurring in metropolitan France (civil registration), all ages · Metropolitan France | [187] |
| 1990 | 28.6% | All deaths occurring in metropolitan France (civil registration), all ages · Metropolitan France | [187] |
| 1995 | 25.9% | All deaths occurring in metropolitan France (civil registration), all ages · Metropolitan France | [187] |
| 2000 | 26.3% | All deaths occurring in metropolitan France (civil registration), all ages · Metropolitan France | [187] |
| 2005 | 26.9% | All deaths occurring in metropolitan France (civil registration), all ages · Metropolitan France | [187] |
| 2010 | 25.5% | All deaths occurring in metropolitan France (civil registration), all ages · Metropolitan France | [187] |
| 2015 | 24.1% | All deaths occurring in metropolitan France (civil registration), all ages · Metropolitan France | [187] |
| 2019 | 23.1% | All deaths occurring in metropolitan France (civil registration), all ages · Metropolitan France | [187] |
| 2024 | 28.1% | All deaths occurring in metropolitan France (civil registration), all ages · Metropolitan France | [187] |
| Period | Deaths at home | Scope | Source |
|---|---|---|---|
| 1980 | 173,241 deaths at home | All registered deaths in Poland, by place of death ('W domu' / at home) · Poland | [208] |
| 1990 | 176,403 deaths at home | All registered deaths in Poland, by place of death ('W domu' / at home) · Poland | [208] |
| 2000 | 150,537 deaths at home | All registered deaths in Poland, by place of death ('W domu' / at home) · Poland | [208] |
| 2005 | 140,337 deaths at home | All registered deaths in Poland, by place of death ('W domu' / at home) · Poland | [209] |
| 2010 | 143,102 deaths at home | All registered deaths in Poland, by place of death ('W domu' / at home) · Poland | [208] |
| 2015 | 139,496 deaths at home | All registered deaths in Poland, by place of death ('W domu' / at home) · Poland | [209] |
| 2020 | 187,589 deaths at home | All registered deaths in Poland, by place of death ('W domu' / at home) · Poland | [208] |
| 2024 | 145,530 deaths at home | All registered deaths in Poland, by place of death ('W domu' / at home) · Poland | [208] |
| Period | Deaths at home | Scope | Source |
|---|---|---|---|
| 1986 | 7,828 deaths in a private home | All deaths of people resident in Norway, by place of death on the death certificate · Norway | [210] |
| 2019 | 5,147 deaths in a private home | All deaths of people resident in Norway, by place of death on the death certificate · Norway | [210] |
| 2020 | 6,022 deaths in a private home | All deaths of people resident in Norway, by place of death on the death certificate · Norway | [210] |
| 2021 | 6,298 deaths in a private home | All deaths of people resident in Norway, by place of death on the death certificate · Norway | [210] |
| 2022 | 6,530 deaths in a private home | All deaths of people resident in Norway, by place of death on the death certificate · Norway | [210] |
| 2023 | 6,329 deaths in a private home | All deaths of people resident in Norway, by place of death on the death certificate · Norway | [210] |
| 2024 | 6,356 deaths in a private home | All deaths of people resident in Norway, by place of death on the death certificate · Norway | [210] |
| 2025 (provisional) | 6,498 deaths in a private home | All deaths of people resident in Norway, by place of death on the death certificate · Norway | [210] |
| Period | Deaths at home | Scope | Source |
|---|---|---|---|
| 2013 | 6,661 deaths at home (domiciliary) | All deaths occurring in Ireland, by place of occurrence · Ireland | [199] |
| 2019 | 7,136 deaths at home (domiciliary) | All deaths occurring in Ireland, by place of occurrence · Ireland | [211] |
| 2020 | 9,209 deaths at home (domiciliary) | All deaths occurring in Ireland, by place of occurrence · Ireland | [212] |
| 2021 | 9,719 deaths at home (domiciliary) | All deaths occurring in Ireland, by place of occurrence · Ireland | [213] |
| 2022 | 9,245 deaths at home (domiciliary) | All deaths occurring in Ireland, by place of occurrence · Ireland | [214] |
| 2023 | 8,725 deaths at home (domiciliary) | All deaths occurring in Ireland, by place of occurrence · Ireland | [215] |
| Period | Outside hospital | Scope | Source |
|---|---|---|---|
| 1991 | 22.5% | All deaths of Canadian residents by place of death (hospital vs non-hospital; non-hospital includes homes, long-term care and other places) · Canada | [216] |
| 2000 | 24.2% | All deaths of Canadian residents by place of death (hospital vs non-hospital; non-hospital includes homes, long-term care and other places) · Canada | [216] |
| 2010 | 37.2% | All deaths of Canadian residents by place of death (hospital vs non-hospital; non-hospital includes homes, long-term care and other places) · Canada | [216] |
| 2015 | 38.5% | All deaths of Canadian residents by place of death (hospital vs non-hospital; non-hospital includes homes, long-term care and other places) · Canada | [216] |
| 2019 | 41.1% | All deaths of Canadian residents by place of death (hospital vs non-hospital; non-hospital includes homes, long-term care and other places) · Canada | [216] |
| 2020 | 45.2% | All deaths of Canadian residents by place of death (hospital vs non-hospital; non-hospital includes homes, long-term care and other places) · Canada | [216] |
| 2021 | 44.8% | All deaths of Canadian residents by place of death (hospital vs non-hospital; non-hospital includes homes, long-term care and other places) · Canada | [216] |
| 2022 | 43.5% | All deaths of Canadian residents by place of death (hospital vs non-hospital; non-hospital includes homes, long-term care and other places) · Canada | [216] |
| 2023 | 43.3% | All deaths of Canadian residents by place of death (hospital vs non-hospital; non-hospital includes homes, long-term care and other places) · Canada | [216] |
| 2024 | 42.7% | All deaths of Canadian residents by place of death (hospital vs non-hospital; non-hospital includes homes, long-term care and other places) · Canada | [216] |
| Period | At home | Scope | Source |
|---|---|---|---|
| 2018 | 30.5% | Deaths of US residents aged 65+ (ten-year age groups 65-74, 75-84, 85+), all causes, by place of death · United States | [122] |
| 2019 | 30.9% | Deaths of US residents aged 65+ (ten-year age groups 65-74, 75-84, 85+), all causes, by place of death · United States | [122] |
| 2020 | 32.8% | Deaths of US residents aged 65+ (ten-year age groups 65-74, 75-84, 85+), all causes, by place of death · United States | [122] |
| 2021 | 33.9% | Deaths of US residents aged 65+ (ten-year age groups 65-74, 75-84, 85+), all causes, by place of death · United States | [122] |
| 2022 | 34.1% | Deaths of US residents aged 65+ (ten-year age groups 65-74, 75-84, 85+), all causes, by place of death · United States | [122] |
| 2023 | 34.1% | Deaths of US residents aged 65+ (ten-year age groups 65-74, 75-84, 85+), all causes, by place of death · United States | [122] |
| 2024 | 34.2 % of deaths at ages 65+ | Deaths of US residents aged 65+ (ten-year age groups 65-74, 75-84, 85+), all causes, by place of death · United States | [122] |
Where people want to die
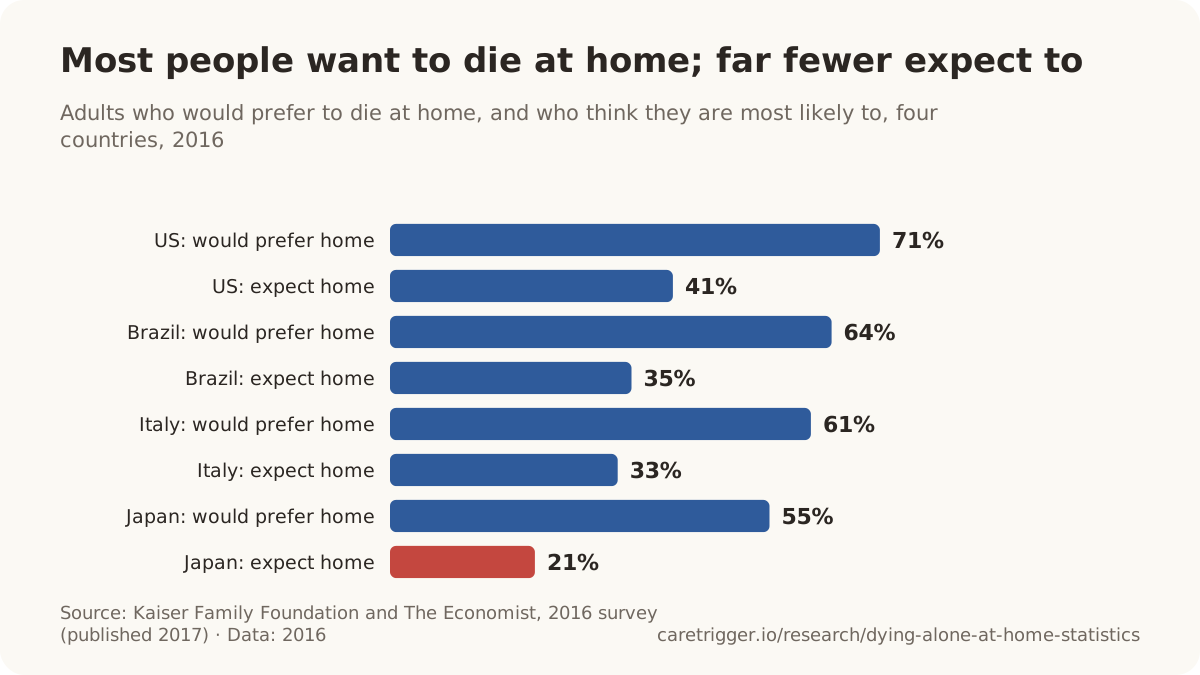
- 71% of US adults say that, given the choice, they would prefer to die at home; only 9% would choose a hospital, 7% a hospice and 1% a nursing home (Kaiser Family Foundation/The Economist survey, 2016; published 2017).[217]
- 41% of adults in the United States think they are most likely to die at home, against 71% who would prefer to; 24% expect to die in a hospital (Kaiser Family Foundation/The Economist survey, 2016; published 2017).[218]
- 21% of adults in Japan think they are most likely to die at home, against 55% who would prefer to; 58% expect to die in a hospital (Kaiser Family Foundation/The Economist survey, 2016; published 2017).[218]
- 55% of adults in Japan say that, given the choice, they would prefer to die at home (Kaiser Family Foundation/The Economist four-country survey, 2016; published 2017).[218]
- 61% of adults in Italy say that, given the choice, they would prefer to die at home (Kaiser Family Foundation/The Economist four-country survey, 2016; published 2017).[218]
- 33% of adults in Italy think they are most likely to die at home, against 61% who would prefer to (Kaiser Family Foundation/The Economist survey, 2016; published 2017).[218]
- 64% of adults in Brazil say that, given the choice, they would prefer to die at home (Kaiser Family Foundation/The Economist four-country survey, 2016; published 2017).[218]
- 35% of adults in Brazil think they are most likely to die at home, against 64% who would prefer to (Kaiser Family Foundation/The Economist survey, 2016; published 2017).[218]
- 81% of US adults say having loved ones around them is extremely or very important when they think about their own death (48% extremely important); the shares are 80% in Italy, 83% in Brazil and 67% in Japan (Kaiser Family Foundation/The Economist survey, 2016).[218]
- Up to 84% of people in OECD countries say they would prefer to die at home, yet on average half of all deaths in OECD countries in 2019 happened in hospital (OECD, 2023).[206]
- In 75% of studies on where people want to die (210 studies, just over 100,000 people in 33 countries), most respondents preferred to die at home, as did 9 of the 14 high-quality studies (Gomes et al., BMC Palliative Care, 2013).[219]
- Between 49% and 70% of the general public said they would prefer to die at home in the four high-quality studies of public preferences (patients: 31% to 87% in nine studies) (Gomes et al., BMC Palliative Care, 2013).[219]
- Between 51% (Portugal) and 84% (the Netherlands) of adults would prefer to die at home if they had a serious illness such as advanced cancer, in a random telephone survey of 9,344 people in seven European countries (England, Flanders, Germany, Italy, the Netherlands, Portugal, Spain) (Gomes et al., Annals of Oncology, 2012).[220]
- 51% to 55% of patients with life-threatening illness prefer to die at home according to two meta-analyses, making home the most preferred place of death in an umbrella review of 15 systematic reviews covering 229 studies (Pinto et al., Journal of Pain and Symptom Management, 2024).[221]
- 61% of 1,499 surveyed members of the Aalborg branch of DanAge, a Danish association for older people, chose home as a preferred place to die (46% a hospice; more than one answer allowed); mean age 67 (Krarup et al., Palliative Medicine Reports, 2025).[224]
- 30% of UK adults picked being at home as one of their three most important priorities for their last year of life; being free of pain, the company of loved ones and keeping their dignity ranked higher (Marie Curie survey by Opinium of 8,077 adults, 2021; report 2024).[225]
10 / Fear
How many older people fear dying alone?
73.4% of people aged 65+ who live alone in Japan say isolated death (dying unattended and being found later) feels close to them, 25.7% 'very much' and 47.7% 'somewhat', against 48.7% of all people 65+ (Cabinet Office of Japan, 2024; survey fieldwork FY2023, n=537).[226]
Most older people who live alone have thought about it. In Japan the share who say an isolated death feels close to them has risen with every survey; in Seoul, nearly two in three older people living alone think it could happen to them, yet almost none have prepared. Fear of dying alone is not the same as loneliness, which is less common in old age than at any other point in adult life.
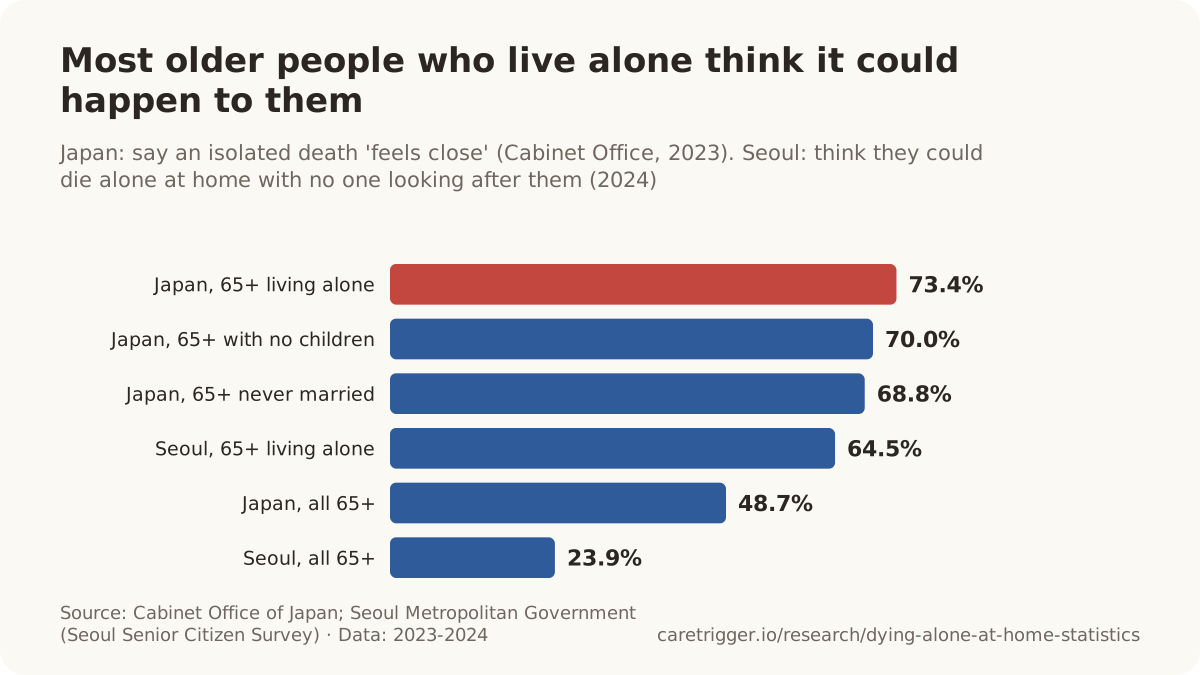
- 64.5% of Seoul residents aged 65+ who live alone think they could die alone at home with no one looking after them, against 23.9% of all older Seoul residents (Seoul Senior Citizen Survey, 2024).[231]
- 23.9% of Seoul residents aged 65+ think they could die alone at home with no one looking after them (19.1% somewhat likely, 4.8% very likely); 41.8% gave a neutral answer (Seoul Senior Citizen Survey, 2024).[231]
- 3.7% of Seoul residents aged 65+ say they have made preparations in case they die alone; 43.4% want to prepare but do not know how and 52.9% feel no need (Seoul Senior Citizen Survey, 2024).[231]
- 46% of U.S. solo agers fear dying alone, versus 37% of other adults 50+; 50% versus 33% fear being moved somewhere against their will (AARP Research / NORC survey, 2020).[232]
- 69% of 1,499 surveyed members of the Aalborg branch of DanAge, a Danish association for older people, said dying alone would worry them (women 73%, men 58%); mean age 67 (Krarup et al., Palliative Medicine Reports, 2025).[224]
- 32% of adults in Great Britain named being alone as their greatest fear about dying, the most common answer, ahead of inadequate pain relief (20%) (YouGov survey of 2,246 adults for Dignity in Dying, April 2008).[233]
- 31.1% of South Koreans who live alone have no one to help them when they are ill; the 68.9% who do is below the national average (Ministry of Data and Statistics, One-person households in statistics 2025).[234]
- About 1,525,000 South Koreans living alone were estimated to be at risk of a lonely death, 21.3% of one-person households and 3% of the population, from a national survey of 9,471 one-person households (Ministry of Health and Welfare, 2023).[67]
- 373,000 South Koreans in their 50s living alone were estimated to be at risk of a lonely death (33.9% of that age group's one-person households), more than any other age band; 355,000 in their 60s (30.2%) and 245,000 in their 40s (25.8%) followed (Ministry of Health and Welfare, 2023).[67]
- 16.2% of South Koreans aged 70+ who live alone, about 210,000 people, are at risk of a lonely death, a lower share than among those in their 50s (33.9%) or 60s (30.2%) (Ministry of Health and Welfare, 2023).[235]
- 170,938 people were classified as at risk of a lonely death by South Korea's local authorities in 2024, the first national tally of people actually identified; 31.1% (53,136) were in Seoul (Ministry of Health and Welfare data, reported 2025).[236]
- 2.5 million people aged 60+ in France feel lonely every day or almost every day (Petits Frères des Pauvres / CSA barometer, 2025).[237]
- 32 older people in France were reported in the press as found dead at home weeks, months or years after dying in 2025 (Petits Frères des Pauvres media census, reported by franceinfo, 2026).[238]
- More than 30 older people in France were reported in the press as found dead at home several weeks to several years after dying in 2024 (Petits Frères des Pauvres media census, 2025).[239]
- 21 older people in France were reported in the press as found dead at home weeks, months or years after dying in 2023, according to the media census of the charity Petits Frères des Pauvres (2026).[240]
- 13 older people in France were reported in the press as found dead at home weeks, months or years after dying in 2022, according to the media census of the charity Petits Frères des Pauvres (2026).[240]
| Period | Feels close | Scope | Source |
|---|---|---|---|
| 2012 | 45.4% | People aged 60+ living alone, recalculated from a sample of people aged 55+ · Japan | [230] |
| 2018 | 50.8% | People aged 60+ living alone (single households), nationwide sample · Japan | [228] |
| 2023 | 73.4 percent | People aged 65+ living alone (no co-residents), nationwide sample · Japan | [226] |
Loneliness is a different measure
- About 871,000 deaths a year worldwide are attributable to loneliness, according to the first global estimate by the WHO Commission on Social Connection (2014-2019 data; WHO, 2025). This counts deaths linked to the feeling of loneliness, not people who die alone.[241]
- 11.8% of people aged 60 and over worldwide experience loneliness, the lowest rate of any age group (women 13.0%, men 9.9%), against 20.9% of 13-17-year-olds (WHO Commission on Social Connection, 2025).[241]
- 16% of people worldwide, about one in six, experienced loneliness in 2014-2023, according to the WHO Commission on Social Connection (WHO, 2025).[241]
- Living alone is associated with a 32% higher likelihood of death (odds ratio 1.32), slightly more than social isolation (1.29) or loneliness (1.26), in a meta-analysis of studies from 1980 to 2014 (Holt-Lunstad et al., Perspectives on Psychological Science, 2015).[242]
- 5% of people aged 75 and over in England feel lonely often or always (4% of those aged 65-74), below the 7% average for adults aged 16+ (DCMS Community and Engagement Survey 2025/26).[245]
- 33.4% of US adults aged 50 to 80 felt a lack of companionship some of the time or often in 2024, back near the 33.9% of 2018 after peaking at 41.6% in 2022 (University of Michigan National Poll on Healthy Aging; Malani et al., JAMA, 2024).[246]
- 13% of people in the EU felt lonely most or all of the time in the previous four weeks and 35% at least some of the time, in the first EU-wide loneliness survey (European Commission Joint Research Centre, EU-LS 2022).[247]
- 48.9% of South Koreans who live alone often or sometimes feel lonely, 10.7 points above the 38.2% for the population as a whole (Ministry of Data and Statistics, One-person households in statistics 2025).[234]
11 / Noticed sooner
What gets someone noticed sooner?
About 155,000 emergencies, such as kitchen fires reported straight to 119 and older people found collapsed in the bathroom, were responded to through South Korea's in-home emergency-detection service in 2023 (Ministry of Health and Welfare, 2024).[248]
The evidence points to one thing above all: someone who expects to hear from you. People who live with others are almost never found late, and people living alone are found sooner when family, carers or neighbours are in regular contact. Japan and South Korea have built national systems of watch-over agreements, check-in calls and home sensors; their reach is large, their effect on deaths is not yet measured, and false alarms are common.
- About 240,000 South Korean households, mostly older people living alone, had emergency-detection devices installed under the government's Emergency Safety and Security Service in 2023 (Ministry of Health and Welfare, 2024).[248]
- 154 of the 46,974 alerts sent by Seoul's smart plugs over about 16 months were judged to be real danger and acted on; the plugs, which flag households whose electricity use and light levels stop changing, were installed in 2,709 one-person households at risk of lonely death (Seoul Metropolitan Government, 2022).[249]
- 73,215 crisis alerts from Seoul's smart check-in services (smart plugs, AI calls, phone and power-use monitoring) were answered by the city's night and holiday control centre in the three years to January 2025 (Seoul Metropolitan Government, 2025).[250]
- 44,923 households in Seoul used the city's 'smart check-in' services in 2024, six technologies (smart plugs, AI phone calls, AI speakers and others) that watch electricity, phone and light data around the clock and trigger a welfare check when something looks wrong (Seoul Metropolitan Government, 2025).[250]
- About 1.99 million check-in phone calls and 370,000 home visits were made in 2024 by Seoul's neighbourhood care teams to about 70,000 people who need regular checks (Seoul Metropolitan Government, 2025).[250]
- About 110,000 Seoul residents at risk of isolation receive regular check-ins: about 70,000 at high or medium risk of lonely death are called or visited by neighbourhood carers and about 40,000 at low risk get AI and sensor-based checks (Seoul Metropolitan Government, 2025).[250]
- 559 lonely deaths were recorded in Seoul in 2023, down from 678 in 2022 according to the national survey, a fall Seoul City attributes to its check-in programmes; the attribution is the city's claim, not an evaluation (Seoul Metropolitan Government, 2025).[250]
- 229 cities, counties and districts, every local authority in South Korea, ran the lonely-death prevention pilot from July 2024, up from 39 in August 2022 (Ministry of Health and Welfare, 2024).[50]
- 0.85 lonely deaths per 100 deaths by 2027 is the target of South Korea's 1st Basic Plan for the Prevention of Lonely Deaths, a 20% cut from 1.06 in 2021 (Ministry of Health and Welfare, 2023).[67]
- 1.09 lonely deaths per 100 deaths were recorded in South Korea in 2024, above the 2021 baseline of 1.06 that the national plan aims to cut to 0.85 by 2027, so the rate was 28% above the target (Ministry of Health and Welfare, 2023 and 2025; derived).[5]
- 71,142 older people were on Taiwan's register of seniors living alone who need care (列冊需關懷獨居老人) at the end of June 2026, up from 67,003 at the end of 2025 (Ministry of Health and Welfare, Taiwan, 2026).[254]
- 67,003 older people were on Taiwan's register of seniors living alone who need care (列冊需關懷獨居老人) at the end of 2025 (Ministry of Health and Welfare, Taiwan).[255]
- 41,983 older people were on Taiwan's register of seniors living alone who need care (列冊需關懷獨居老人) at the end of 2020 (Ministry of Health and Welfare, Taiwan).[255]
- 47,665 older people were on Taiwan's register of seniors living alone who need care (列冊需關懷獨居老人) at the end of 2015 (Ministry of Health and Welfare, Taiwan).[255]
- 9,000 clients had subscribed to La Poste's 'Veiller sur mes parents' service, in which postal workers visit older people and report back to their families, by March 2020 (La Poste, 2020).[256]
- 43,074 older people living alone and/or isolated, or otherwise vulnerable, were flagged by Portugal's GNR police in its 2025 'Censos Sénior' operation; Guarda (5,852) and Vila Real (5,167) districts led (GNR, 2026).[257]
12 / Data
Download the dataset
Every statistic on this page, with its verbatim source quote, locator, population, period and verification status, in one file. Each chart's CSV is linked under the chart.
Download all statistics (CSV) Download all statistics (JSON)
Charts and figures on this page may be reused with a link to https://caretrigger.io/research/dying-alone-at-home-statistics as the source. Each chart's CSV is published next to it.
13 / Methodology
Methodology
What we included. Published figures on people who die alone at home and are found late, on how such deaths are defined and counted, on who finds them, on unclaimed bodies and state-arranged funerals, on where people die and want to die, and on the fear of dying alone. Official statistics (police, medical examiners, coroners, national statistics offices and ministries) and peer-reviewed forensic and public-health studies are preferred; surveys by charities, insurers and polling firms are included and labelled as such; news reports are used only where they carry an official figure we could not reach directly, and the dataset says so.
How each figure was verified. Every record carries the exact sentence or table cell from the source (quote) and where it sits (locator). A researcher confirmed each one against the source document, downloading and parsing PDFs and spreadsheets rather than reading web summaries of them; a script then re-fetched every source on the date shown at the top of the page, using publisher APIs and PDF text where the web page blocks automated access, and checked for the quote. Records the script could not confirm are kept only if the researcher's check was complete, and are marked for human review in the dataset. Where the same figure was captured twice, one record is kept and the other marked as superseded.
What we excluded. Figures we could not trace to a document, vendor pages that cite each other rather than a source, and the widely copied claims described in the "Numbers we will not publish" note in the first section. Graphic detail is left out: statements say "decomposed" where the condition of a body matters to the figure, and no more.
Rounding and derivation. Numbers are reproduced as published. Derived figures (a share computed from two published counts, a total summed from table cells) say so in the statement and name the inputs. The bold figure in each statement is a reading aid, not an edit.
Updates. Sources are re-checked and new figures added quarterly, timed to the releases that matter here: Japan's police and Cabinet Office figures in April, Japan's half-year police figures in August, South Korea's lonely-death survey in the autumn (2025 data is expected in late 2026), and Sweden's forensic statistics in the spring. The next scheduled refresh is January 2027. Corrections are welcome through the support page.
Cite this page
CareTrigger. "Statistics on People Who Die Alone at Home: How Many, How Long Until Found, and Who Finds Them." https://caretrigger.io/research/dying-alone-at-home-statistics. Last updated 2026-10-10.
14 / FAQ
Frequently asked questions
How many people die alone at home each year?
Only Japan counts it nationally: 76,941 people who lived alone died at home there in 2025 and were handled by police, three in four of them aged 65 or over. South Korea recorded 3,924 lonely deaths in 2024 under its own, narrower legal definition, and Sweden counted 897 people found dead at home a week or more after death in 2024. Most other countries, including the United States and the United Kingdom, publish no count at all.[1][2][5][10][122]
What is kodokushi?
Kodokushi (孤独死, lonely death) is the Japanese word for dying alone at home and being found only later. Japan now measures it two ways: the National Police Agency counts every person living alone who died at home and was handled by police, whatever the cause and however soon they were found (76,941 in 2025), and the Cabinet Office estimates isolated deaths (孤立死) as those found 8 or more days after death (22,222 in 2025). Tokyo's Medical Examiner's Office applies the word to any death at home of a person from a one-person household that it examines.[1][9][21][123]
What is godoksa, and how many lonely deaths are there in South Korea?
Godoksa (고독사) is South Korea's legal term for the death of a person who lived in social isolation, cut off from family, relatives and others, whether from illness, suicide or another cause. The national survey counted 3,924 in 2024, 63% more than the 2,412 of 2017, although the definition was broadened from 2022. Men in their 50s and 60s were 54.0% of the 2024 cases, and only 17.8% of the people who died were aged 70 or over.[5][5][5][5][5]
How long does it take for someone who dies alone at home to be found?
Most are found within days, but the tail is long. In Japan in 2025, 36.9% of people who lived alone and died at home were found within a day, while 7,148 (9.3%) were not found for a month or more; among those aged 65 and over, 27.0% were found 8 or more days after death. In Sweden, 309 people were found a month or more after death in 2025.[2][2][2][3]
Who is most likely to die alone and not be found for a long time?
Men who live alone, especially those who are unmarried, poor or out of touch with family. 17,620 of Japan's 22,222 isolated deaths in 2025 were men, as were 73.5% of the people found a month or more after death in Sweden. Living with someone almost removes the risk: in Tokyo in 2021, 37.2% of people who lived alone and died at home were found 8 or more days later, against 1.9% of those who lived with others. In South Korea, the lowest income group had 14.2 times the adjusted odds of a lonely death.[9][34][32][64]
Who finds people who die alone at home?
Less and less often, family. Family found 30.0% of the older people who died alone at home in Tokyo in 2024, down from 38.8% in 2002; in South Korea, landlords, security guards, building managers and couriers first found 43.1% of lonely deaths in 2024, against 26.6% found by family. When no one is checking, the alarm is a smell or unpaid rent: in Osaka that took about two weeks on average, against three days when family or carers found the person.[70][81][5][45]
How many people die alone in the UK and the US?
Neither country counts it. The closest official figure in England and Wales is the number of deaths with an ill-defined or unknown cause, the code used when a body is too decomposed to diagnose: 1,231 in 2025. Councils in England arranged an estimated 4,400 public health funerals in 2022/23 for people with no one able or willing to. In the United States the unattended-death code was used for only 14 deaths in 2022; the nearest national figure is that about 1.2% of deaths go unclaimed in the counties that keep records.[14][7][122][143]
Which sources should I cite for statistics on dying alone at home?
For counts: Japan's National Police Agency (people living alone who died at home), Japan's Cabinet Office (isolated deaths found 8 or more days later), South Korea's Ministry of Health and Welfare (lonely deaths) and Sweden's National Board of Forensic Medicine (people found a week or a month after death). For England and Wales, Hiam and colleagues' analysis of undefined deaths in the Journal of the Royal Society of Medicine (2024). For what happens to people found alive, Gurley and colleagues in the New England Journal of Medicine (1996). The dataset on this page carries the verbatim source quote for every figure.[1][9][5][3][52][49]
15 / Sources
Sources
Numbered in order of first appearance. Each entry lists the record ids it supports; the dataset carries the verbatim quote for each.
- [1]National Police Agency of Japan. 令和7年中における死体取扱状況(警察取扱死体のうち、自宅において死亡した一人暮らしの者)について (NPA). Published 2026-04. Accessed 2026-10-08.Used for: jp-npa-2025-died-alone-at-home-total
- [2]National Police Agency of Japan. 令和7年中における死体取扱状況(警察取扱死体のうち、自宅において死亡した一人暮らしの者)について (NPA). Published 2026-04. Accessed 2026-10-11.Used for: jp-npa-2025-found-after-1-month, jp-npa-2025-died-alone-at-home-65plus, jp-npa-2025-time-to-discovery-distribution, jp-npa-2025-65plus-found-8plus-days, jp-npa-2025-65plus-found-after-1-month, jp-npa-2025-65plus-found-within-1-day, jp-npa-2025-under65-found-8plus-days, jp-npa-2025-largest-age-band-85plus, jp-npa-2025-under65-share
- [3]Rättsmedicinalverket (Swedish National Board of Forensic Medicine). Ny statistik: Ökat antal dödsfall i hemmet som upptäcks efter en längre tid (RMV press release, 13 May 2026). Published 2026-05-13. Accessed 2026-10-11.Used for: se-rmv-2025-found-after-1-month, se-rmv-2025-stockholm-county-found-after-1-month, se-rmv-2025-found-after-1-week-men-over-65-shares, se-rmv-2025-found-after-1-month-natural-causes, se-rmv-2020-2025-found-after-1-month-increase, se-rmv-2020-found-after-1-month
- [4]Cabinet Office of Japan (高齢社会白書), from Tokyo Metropolitan Medical Examiner's Office statistics. 令和8年版高齢社会白書 第1章第2節4 図1-2-4-13 東京23区内における一人暮らしで65歳以上の人の自宅での死亡者数. Published 2026-06. Accessed 2026-10-11.Used for: jp-tokyo23-me-2024-65plus-living-alone-home-deaths
- [5]Ministry of Health and Welfare, Republic of Korea (보건복지부). 2024년 고독사 전년 대비 증가, “생애주기별 사회적 고립 위험군 발굴하여 맞춤형 지원 예정” (press release with 2024 lonely-death survey results; PDF attachment). Published 2025-11-27. Accessed 2026-10-11.Used for: kr-mohw-godoksa-2017-2024-increase, kr-mohw-godoksa-discoverer-2020-vs-2024, kr-mohw-godoksa-2024-count, kr-mohw-2024-godoksa-per-day, kr-mohw-2024-godoksa-share-of-police-death-scenes, kr-mohw-2024-godoksa-by-region, kr-mohw-2024-godoksa-50s-60s-men-share, kr-mohw-2024-godoksa-by-sex, kr-mohw-2024-godoksa-by-age, kr-mohw-2024-godoksa-aged-60plus-share, kr-mohw-2024-godoksa-rate-by-age, kr-mohw-2024-godoksa-basic-livelihood-share, kr-mohw-2024-godoksa-suicide-share, kr-mohw-2024-godoksa-suicide-share-by-age, kr-mohw-2024-godoksa-by-housing, kr-mohw-godoksa-gosiwon-motel-share-2020-2024, kr-mohw-godoksa-2024-who-found-the-body, kr-mohw-godoksa-2020-count, kr-mohw-godoksa-2020-per-100k, kr-mohw-godoksa-2021-per-100k, kr-mohw-godoksa-2022-per-100k, kr-mohw-godoksa-2023-per-100k, kr-mohw-godoksa-2024-per-100k, kr-mohw-godoksa-2020-per-100-deaths, kr-mohw-godoksa-2021-per-100-deaths, kr-mohw-godoksa-2022-per-100-deaths, kr-mohw-godoksa-2023-per-100-deaths, kr-mohw-godoksa-2024-per-100-deaths, kr-godoksa-statutory-definition, kr-mohw-2024-godoksa-vs-plan-target
- [6]Japan Research Institute for the Ministry of Health, Labour and Welfare (published on mhlw.go.jp). 行旅病人及行旅死亡人取扱法、墓地、埋葬等に関する法律及び生活保護法に基づく火葬等関連事務を行った場合等の遺骨・遺体の取扱いに関する調査研究事業 報告書. Published 2025-03. Accessed 2026-10-11.Used for: jp-mhlw-2023-unclaimed-bodies
- [7]Local Government Association. Local Government Association. Public health funerals 2024 research report (survey of English district and single-tier councils, March-April 2024). Published 2024-09-21. Accessed 2026-10-11.Used for: uk-lga-2022-23-public-health-funerals-england, uk-lga-2022-23-public-health-funerals-65plus, uk-lga-2022-23-phf-reason-no-family-or-friends, uk-lga-2022-23-phf-family-breakdown-reason, uk-lga-2022-23-phf-total-spend, uk-lga-2019-20-public-health-funeral-average-cost, uk-lga-2020-21-public-health-funeral-average-cost, uk-lga-2021-22-public-health-funeral-average-cost, uk-lga-2022-23-phf-average-cost, uk-lga-2019-20-public-health-funerals-england, uk-lga-2020-21-public-health-funerals-england, uk-lga-2021-22-public-health-funerals-england
- [8]National Police Agency of Japan; Ministry of Health, Labour and Welfare of Japan. 人口動態統計(確定数)令和7年 上巻 死亡 第5.5表 死亡の場所別にみた年次別死亡数. Published 2026-09-30. Accessed 2026-10-11.Used for: jp-npa-2025-solitary-home-deaths-share-of-home-deaths, jp-npa-2025-solitary-home-deaths-share-of-all-deaths, jp-cao-2025-isolated-deaths-share-of-all-deaths, jp-npa-2025-police-handled-share-of-all-deaths
- [9]Cabinet Office, Japan (孤独・孤立対策推進室). 令和7年孤立死者数の推計について (報道資料, 2026-04-14). Published 2026-04-14. Accessed 2026-10-08.Used for: jp-cao-2025-isolated-deaths-8plus-days, jp-cao-2025-isolated-deaths-4plus-days-reference, jp-cao-2025-isolated-deaths-men-60-79, jp-cao-2025-isolated-deaths-under65-share
- [10]Rättsmedicinalverket (Swedish National Board of Forensic Medicine). Ny statistik: Flest äldre och män bland dödsfall i hemmet som upptäcks efter en längre tid (RMV press release, 16 October 2025). Published 2025-10-16. Accessed 2026-10-11.Used for: se-rmv-2024-found-after-1-week, se-rmv-2024-found-after-1-week-duration-breakdown, se-rmv-2024-share-of-1-week-cases-found-after-1-month, se-rmv-2024-found-after-1-week-men-share, se-rmv-2024-found-after-1-week-over-65-share, se-rmv-2020-found-after-1-week, se-rmv-2021-found-after-1-week, se-rmv-2022-found-after-1-week, se-rmv-2023-found-after-1-week
- [11]Susanne Loke, doctoral dissertation, Ruhr-Universitaet Bochum (open access, transcript Verlag). Loke S. Einsames Sterben und unentdeckte Tode in der Stadt. Ueber ein verborgenes gesellschaftliches Problem. Bielefeld: transcript, 2023 (Alter - Kultur - Gesellschaft 9). doi:10.14361/9783839466483. Published 2023. Accessed 2026-10-11.Used for: loke-2023-one-in-five-home-deaths-undiscovered, loke-2023-undiscovered-share-of-all-deaths, loke-2023-undiscovered-deaths-two-german-cities-2006-2016, loke-2023-share-found-8plus-days, loke-2023-time-to-discovery-distribution, loke-2023-men-share-undiscovered, loke-2023-half-died-aged-65-or-younger, loke-2023-gelsenkirchen-men-8plus-days-single-divorced, loke-2023-childless-share-aachen, loke-2023-suicide-share-undiscovered, loke-2023-gelsenkirchen-undiscovered-deaths-up-93pct, loke-2023-gelsenkirchen-found-8plus-days-tripled, loke-2023-gelsenkirchen-undiscovered-deaths-2006, loke-2023-aachen-undiscovered-deaths-2006, loke-2023-gelsenkirchen-undiscovered-deaths-2007, loke-2023-aachen-undiscovered-deaths-2007, loke-2023-gelsenkirchen-undiscovered-deaths-2008, loke-2023-aachen-undiscovered-deaths-2008, loke-2023-gelsenkirchen-undiscovered-deaths-2009, loke-2023-aachen-undiscovered-deaths-2009, loke-2023-gelsenkirchen-undiscovered-deaths-2010, loke-2023-aachen-undiscovered-deaths-2010, loke-2023-gelsenkirchen-undiscovered-deaths-2011, loke-2023-aachen-undiscovered-deaths-2011, loke-2023-gelsenkirchen-undiscovered-deaths-2012, loke-2023-aachen-undiscovered-deaths-2012, loke-2023-gelsenkirchen-undiscovered-deaths-2013, loke-2023-aachen-undiscovered-deaths-2013, loke-2023-gelsenkirchen-undiscovered-deaths-2014, loke-2023-aachen-undiscovered-deaths-2014, loke-2023-gelsenkirchen-undiscovered-deaths-2015, loke-2023-aachen-undiscovered-deaths-2015, loke-2023-gelsenkirchen-undiscovered-deaths-2016, loke-2023-aachen-undiscovered-deaths-2016
- [12]Deutsches Ärzteblatt International (peer-reviewed research letter). Dasch B, Bernhardt F, Sudhaus HM, Lenz P. The Prevalence of Lonely Deaths and Suicides in the Home: An Analysis of Death Certificates and Emergency Physician Protocols. Dtsch Arztebl Int 2025;122(1):19-20 (PMID 40009873, PMC12416031). Published 2025-01-10. Accessed 2026-10-11.Used for: dasch-2025-munster-lonely-deaths-5pct-of-home-deaths, dasch-2025-munster-lonely-deaths-men-7-4pct-women-2-5pct, dasch-2025-munster-lonely-deaths-under-60-11-8pct, dasch-2025-munster-emergency-physician-found-already-dead-69-9pct
- [13]Statistisches Bundesamt (Destatis). Statistischer Bericht - Todesursachen in Deutschland - 2025 (table 23211-b11). Published 2026-10-09. Accessed 2026-10-11.Used for: de-destatis-r98-unattended-deaths-2025, de-destatis-2025-r98-men-and-65plus
- [14]Office for National Statistics (Nomis dataset NM_161_1). Mortality statistics - underlying cause, sex and age (Nomis NM_161_1, 'mortsa'), England and Wales, causes R98 and R99. Accessed 2026-10-11.Used for: uk-ons-2025-r99-deaths-ew, uk-ons-2013-r99-deaths-ew, uk-ons-2014-r99-deaths-ew, uk-ons-2015-r99-deaths-ew, uk-ons-2016-r99-deaths-ew, uk-ons-2017-r99-deaths-ew, uk-ons-2018-r99-deaths-ew, uk-ons-2019-r99-deaths-ew, uk-ons-2020-r99-deaths-ew, uk-ons-2021-r99-deaths-ew, uk-ons-2022-r99-deaths-ew, uk-ons-2023-r99-deaths-ew, uk-ons-2024-r99-deaths-ew
- [15]Journal of Forensic and Legal Medicine (peer-reviewed; Public Health Service of Amsterdam). Runtuwene NF, Buster MCA. Domestic-setting corpses, an urban problem? J Forensic Leg Med 2019;61:22-26 (PMID 30412866). Published 2018-10-25. Accessed 2026-10-11. (abstract only)Used for: nl-amsterdam-2019-domestic-setting-corpses-14plus-days
- [16]Revista Española de Salud Pública (Ministerio de Sanidad; peer-reviewed). Esteve-Esteve M et al. Magnitud y factores asociados al fenómeno de la muerte solitaria del anciano en la Comunidad Valenciana. Rev Esp Salud Publica 2021;95:e202103044 (PMID 33759874). Published 2021-03-24. Accessed 2026-10-11.Used for: esteve-2021-valencia-65plus-solitary-deaths-2015-2017-count, esteve-2021-valencia-solitary-death-men-or-2-40, esteve-2021-valencia-solitary-death-divorced-or-29-single-or-23, esteve-2021-valencia-solitary-death-summer-or-2-34, esteve-2021-valencia-65plus-solitary-death-rate-2017, esteve-2021-valencia-65plus-solitary-death-rate-2015, esteve-2021-valencia-65plus-solitary-death-rate-2016
- [17]Polícia de Segurança Pública (PSP), via Lusa / Observador. Observador (Lusa): Morreram 757 idosos sozinhos em casa nos centros urbanos nos últimos três anos (6 Apr 2025). Published 2025-04-06. Accessed 2026-10-11.Used for: pt-psp-2024-65plus-died-alone-at-home, pt-psp-2023-65plus-died-alone-at-home, pt-psp-2022-65plus-died-alone-at-home, pt-psp-2022-2024-65plus-died-alone-male-share
- [18]Statistics Netherlands (CBS). Overledenen; geslacht, leeftijd en positie in het huishouden (StatLine table 83190NED, 2011-2025). Published 2026-09-11. Accessed 2026-10-11.Used for: nl-cbs-2025-deaths-of-people-living-alone, nl-cbs-2025-65plus-deaths-of-people-living-alone, nl-cbs-2011-2025-men-living-alone-deaths-rise, nl-cbs-2011-deaths-of-people-living-alone
- [19]National Police Agency of Japan (警察庁刑事局捜査第一課). 令和6年中における警察取扱死体のうち、自宅において死亡した一人暮らしの者について (NPA, Criminal Affairs Bureau, 1st Investigation Division). Published 2025-04-11. Accessed 2026-10-08.Used for: jp-npa-2024-died-alone-at-home-total
- [20]National Police Agency of Japan. 令和6年中における警察取扱死体のうち、自宅において死亡した一人暮らしの者について (NPA, Criminal Affairs Bureau, 1st Investigation Division). Published 2025-04-11. Accessed 2026-10-08.Used for: jp-npa-2024-died-alone-at-home-65plus, jp-npa-2024-time-to-discovery-distribution, npa-japan-2024-65plus-found-within-1-day-39-2pct, jp-npa-2024-65plus-found-8plus-days, jp-npa-2024-found-after-1-month-all-ages, jp-npa-2024-under65-found-8plus-days, jp-npa-2024-largest-age-band-85plus
- [21]Cabinet Office, Japan (内閣府 孤独・孤立対策推進室; 「孤独死・孤立死」WG). 孤立死者数の推計方法等について ~「警察取扱死体のうち、自宅において死亡した一人暮らしの者」をもとに~ 「孤独死・孤立死」WG取りまとめ (2025-04-11). Published 2025-04-11. Accessed 2026-10-08.Used for: jp-cao-2024-isolated-deaths-8plus-days, jp-cao-2024-isolated-deaths-4plus-days-reference, jp-cao-2024-isolated-deaths-peak-age-70-74, jp-mhlw-npa-2024-suicides-loneliness-motive, jp-npa-solitary-home-death-count-definition, jp-cao-koritsushi-definition
- [22]National Police Agency of Japan. 令和7年上半期(1~6月分)(暫定値)における死体取扱状況(警察取扱死体のうち、自宅において死亡した一人暮らしの者)について. Published 2025-08-08. Accessed 2026-10-08.Used for: jp-npa-2025h1-died-alone-at-home
- [23]National Police Agency of Japan. 令和6年上半期(1~6月分)(暫定値)における死体取扱状況(警察取扱死体のうち、自宅において死亡した一人暮らしの者)について. Published 2024-08. Accessed 2026-10-08.Used for: jp-npa-2024h1-died-alone-at-home
- [24]National Police Agency of Japan (警察庁刑事局捜査第一課). 警察取扱死体のうち、自宅において死亡した一人暮らしの者(令和7年)都道府県別. Published 2026-04. Accessed 2026-10-11.Used for: jp-npa-2025-by-prefecture-top5, jp-npa-2025-tokyo-died-alone-at-home, jp-npa-2025-prefecture-share-range
- [25]National Police Agency of Japan (警察庁刑事局捜査第一課). 警察取扱死体のうち、自宅において死亡した一人暮らしの者(令和6年)都道府県別. Published 2025-04. Accessed 2026-10-11.Used for: jp-npa-2024-tokyo-died-alone-at-home
- [26]Journal of Epidemiology (Japan Epidemiological Association; peer-reviewed, open access). Ninomiya H, Ae R, Suzuki H. Descriptive Epidemiology of solitary death (kodokushi) in Tokyo's 23 wards, Japan, 2016-2023. J Epidemiol 2026 (accepted article, doi:10.2188/jea.JE20260157; PMID 42702562). Published 2026-09-05. Accessed 2026-10-11.Used for: ninomiya-2026-tokyo23-solitary-deaths-2016-2023-total, ninomiya-2026-tokyo23-median-pmi-men-5-days-women-3-days, ninomiya-2026-tokyo23-longest-interval-4849-days, ninomiya-2026-tokyo23-solitary-death-crude-rate-men-2023, ninomiya-2026-tokyo23-solitary-death-crude-rate-women-2023, ninomiya-2026-tokyo23-solitary-deaths-found-within-3-days-men-2016-2023, ninomiya-2026-tokyo23-solitary-deaths-found-within-3-days-men-2005, ninomiya-2026-tokyo23-solitary-deaths-found-within-3-days-women-2016-2023, ninomiya-2026-tokyo23-solitary-deaths-found-within-3-days-women-2005, ninomiya-2026-tokyo23-solitary-death-crude-rate-men-2016, ninomiya-2026-tokyo23-solitary-death-crude-rate-women-2016, ninomiya-2026-tokyo23-unknown-manner-of-death-men-27-4pct, ninomiya-2026-tokyo23-unknown-manner-summer-36-5pct-winter-13-7pct
- [27]Ministry of Health and Welfare, Republic of Korea (보건복지부). 2022년 고독사 실태조사 결과 발표 (first national lonely-death survey, 2017-2021 data; PDF attachment). Published 2022-12-14. Accessed 2026-10-11.Used for: kr-mohw-2021-godoksa-rate-by-region, kr-mohw-2022-godoksa-sex-share-of-deaths, kr-mohw-2021-godoksa-discoverer-detail, kr-mohw-godoksa-2017-count, kr-mohw-godoksa-2018-count, kr-mohw-godoksa-2019-count, kr-mohw-godoksa-2021-count, kr-mohw-godoksa-2017-per-100k, kr-mohw-godoksa-2018-per-100k, kr-mohw-godoksa-2019-per-100k
- [28]Fiscalía General del Estado (Spain). Memoria de la Fiscalía General del Estado 2019, Capítulo IV, 2.6 Protección y defensa de las personas mayores. Published 2019-09. Accessed 2026-10-11.Used for: es-fge-2018-teruel-died-alone-unnoticed
- [29]Bezirksamt Mitte von Berlin (press release). Trauerfeier fuer einsam verstorbene Menschen aus Mitte, Pressemitteilung Nr. 277/2024 vom 18.11.2024. Published 2024-11-18. Accessed 2026-10-11.Used for: de-berlin-mitte-2024-died-alone-46
- [30]National Police Agency of Japan (警察庁刑事局捜査第一課). 死体取扱数等の推移(H26~R5). Published 2024-02-16. Accessed 2026-10-11.Used for: jp-npa-2014-police-handled-bodies, jp-npa-2015-police-handled-bodies
- [31]National Police Agency of Japan (警察庁刑事局捜査第一課). 死体取扱数等の推移(H28~R7). Published 2026-02. Accessed 2026-10-11.Used for: jp-npa-2016-police-handled-bodies, jp-npa-2017-police-handled-bodies, jp-npa-2018-police-handled-bodies, jp-npa-2019-police-handled-bodies, jp-npa-2020-police-handled-bodies, jp-npa-2021-police-handled-bodies, jp-npa-2022-police-handled-bodies, jp-npa-2023-police-handled-bodies, jp-npa-2024-police-handled-bodies, jp-npa-2025-police-handled-bodies, jp-npa-2025-police-handled-bodies-autopsy-rate
- [32]Tokyo Metropolitan Medical Examiner's Office (東京都監察医務院). 死後経過時間(9区分),性・世帯分類別異状死数・構成比,東京都特別区,令和3年 (表4-00-121). Accessed 2026-10-08.Used for: jp-tokyo23-me-2021-single-households-found-8plus-days, jp-tokyo23-me-2021-living-alone-vs-with-others-found-8plus-days
- [33]Hyogo Prefectural Government, Medical Examiner's Office (兵庫県監察医務室). 兵庫県監察医務死因調査統計年報 令和5(2023)年版 独居自宅死亡者の発見までの時間. Published 2024-11. Accessed 2026-10-11.Used for: jp-kobe-me-2023-living-alone-home-deaths-found-after-1-week, jp-kobe-me-2023-living-alone-home-deaths-who-found, jp-kobe-me-2023-living-alone-home-deaths-share-of-cases
- [34]Rättsmedicinalverket (Swedish National Board of Forensic Medicine). Statistik: Personer som varit avlidna en längre period innan de hittats (RMV statistics page, section Rättsmedicin, updated 2026-05-13). Published 2026-05-13. Accessed 2026-10-11.Used for: se-rmv-2025-found-after-1-month-duration-breakdown, se-rmv-2025-found-after-1-month-men-share, se-rmv-2025-found-after-1-month-over-65-share, se-rmv-2021-found-after-1-month, se-rmv-2022-found-after-1-month, se-rmv-2023-found-after-1-month, se-rmv-2024-found-after-1-month
- [35]Health and Social Welfare Review (보건사회연구), Korea Institute for Health and Social Affairs. Na J. 법의부검 자료를 통한 대한민국 고독사에 관한 고찰 (A study of solitary deaths in the Republic of Korea using forensic autopsy data). 보건사회연구 43(4):274-288. doi:10.15709/hswr.2023.43.4.274. Published 2023-12. Accessed 2026-10-11.Used for: na-2023-kr-forensic-mean-time-to-discovery, na-2023-kr-forensic-time-to-discovery-distribution, na-2023-kr-forensic-who-found-them
- [36]Journal of Forensic and Legal Medicine (Elsevier; Forensic Science SA / University of Adelaide). Byard RW. The forensic implications of lonely deaths (Kodokushi) - A South Australian study. J Forensic Leg Med 2025;109:102799 (PMID 39689400). Published 2024-12-14. Accessed 2026-10-11. (abstract only)Used for: byard-2025-south-australia-lonely-deaths-mean-time-to-discovery-21-days, byard-2025-sa-decomposed-60plus-home-deaths-men-78pct, byard-2025-south-australia-lonely-deaths-2019-2023, byard-2025-south-australia-lonely-deaths-2000-2004, byard-2025-sa-decomposed-60plus-home-deaths-share-autopsies-2019-2023, byard-2025-sa-decomposed-60plus-home-deaths-share-autopsies-2000-2004
- [37]Universitaet des Saarlandes, Institute of Legal Medicine Homburg (medical doctoral dissertation). Umstaetter E. Auswertung der Obduktionsfaelle von Wohnungstoten im Einzugsgebiet der Rechtsmedizin Homburg 2014-2018. Dissertation, Universitaet des Saarlandes, 2024 (Promotion 12.03.2025). Published 2025-03-12. Accessed 2026-10-11.Used for: umstaetter-2025-homburg-time-to-discovery, umstaetter-2025-homburg-how-deaths-were-noticed, umstaetter-2025-homburg-who-found-the-body, umstaetter-2025-homburg-home-deaths-46pct-of-autopsies
- [38]BMC Geriatrics (Springer Nature; peer-reviewed, open access). Vural T, Kalkan SA. Decomposition and medicolegal autopsy in geriatric in-home non-traumatic deaths: histopathological findings and a public health perspective. BMC Geriatr 2026;26(1):313 (PMID 41639798, PMC12964670). Published 2026-02-05. Accessed 2026-10-11.Used for: vural-2026-trabzon-decomposed-65plus-pmi-10-days-plus-41pct, vural-2026-trabzon-decomposed-65plus-last-seen-alive-mean-11-days, vural-2026-trabzon-decomposed-65plus-cause-undetermined-30-7pct
- [39]Ev. Fachhochschule Rheinland-Westfalen-Lippe, Bochum (master's teaching-research project). Geser L, Henke N, Loke S. Lehrforschungsprojekt 'Unentdeckte Tode'. Forschungsbericht, Master-Studiengang Soziale Inklusion, Ev. Fachhochschule RWL, Bochum, 31 August 2014. Published 2014-08-31. Accessed 2026-10-11.Used for: geser-2014-gelsenkirchen-municipal-burials-median-8-5-days
- [40]Legal Medicine (Tokyo) (Elsevier; peer-reviewed). Hashizume Y et al. Retrospective study on solitary deaths (kodoku-shi) from the aspects of forensic and social medicine. Leg Med (Tokyo) 2025;78:102712 (PMID 40997669). Published 2025-09-20. Accessed 2026-10-11. (abstract only)Used for: hashizume-2025-wakayama-solitary-deaths-found-7-days-to-1-month-25-7pct, hashizume-2025-wakayama-solitary-deaths-men-74pct
- [41]BMC Public Health (Springer Nature; peer-reviewed, open access). Miyamori D et al. Alcohol abuse as a potential risk factor of solitary death among people living alone: a cross-sectional study in Kyoto, Japan. BMC Public Health 2022;22:545 (PMID 35303850, PMC8933924). Published 2022-03-19. Accessed 2026-10-11.Used for: miyamori-2022-kyoto-living-alone-45-5pct-found-after-1-week, miyamori-2022-kyoto-living-alone-alcohol-abuse-61-8pct-found-after-1-week
- [42]Environmental Health and Preventive Medicine (Springer Nature; peer-reviewed, open access). Kakiuchi Y et al. A descriptive study of solitary death in Yokohama City. Environ Health Prev Med 2019;24:12 (PMID 30764762, PMC6376675). Published 2019-02-14. Accessed 2026-10-11.Used for: kakiuchi-2019-yokohama-home-deaths-found-3plus-days-23pct, kakiuchi-2019-yokohama-found-3plus-days-men-77-9pct, kakiuchi-2019-yokohama-never-married-or-3-05-found-3plus-days
- [43]Legal Medicine (Tokyo) (Elsevier; peer-reviewed). Yamasaki Y et al. Factors that delay discovery in cases of death at home in Japan. Leg Med (Tokyo) 2026;84:102895 (PMID 42364373). Published 2026-06-18. Accessed 2026-10-08. (abstract only)Used for: jp-okayama-2026-delayed-discovery-3plus-days
- [44]BMJ Open (peer-reviewed, open access). Ito T et al. Factors that prolong the 'postmortem interval until finding' (PMI-f) among community-dwelling elderly individuals in Japan: analysis of registration data. BMJ Open 2012;2(5):e001280 (PMID 23024252, PMC3488755). Published 2012-09-27. Accessed 2026-10-11.Used for: ito-2012-yamagata-65plus-living-alone-49pct-found-after-1-day, ito-2012-yamagata-living-alone-65-74-median-1-61-days, ito-2012-yamagata-living-alone-adjusted-hr-3-73, ito-2012-yamagata-65plus-living-alone-found-by-non-family-51pct
- [45]Prilozi / Contributions, Section of Medical Sciences (Macedonian Academy of Sciences and Arts; peer-reviewed). Morita S, Nishi K, Furukawa F, Hitosugi M. A survey of solitary deaths in Japan for shortening postmortem interval until discover. Pril (Makedon Akad Nauk Umet Odd Med Nauki) 2015;36(1):47-51 (PMID 26076774; doi:10.1515/prilozi-2015-0029). Published 2015. Accessed 2026-10-11.Used for: morita-2015-osaka-mean-interval-men-4-2-days-women-1-3-days, morita-2015-osaka-living-alone-no-one-checking-found-after-2-weeks
- [46]Japan Small Amount & Short Term Insurance Association (日本少額短期保険協会), Lonely Death Countermeasures Committee. 第10回 孤独死現状レポート. Published 2025-12. Accessed 2026-10-11.Used for: jp-ssi-2025-kodokushi-average-days-to-discovery, jp-ssi-2025-kodokushi-men-share, jp-ssi-2025-kodokushi-under65-share, jp-ssi-2025-kodokushi-suicide-share, jp-ssi-2025-kodokushi-first-discoverer, jp-ssi-2025-kodokushi-restoration-cost
- [47]Science & Justice (Elsevier; peer-reviewed; Cranfield University). Giles SB, Errickson D, Márquez-Grant N. A retrospective comparative study to evaluate the reliability of post-mortem interval sources in UK and US medico-legal death investigations. Sci Justice 2022;62(2):246-261 (PMID 35277239). Published 2022-02-09. Accessed 2026-10-08. (abstract only)Used for: us-allegheny-2022-decomposition-cases-pmi-sources
- [48]National Police Agency of Japan (reported by Nikkei). 高齢者「孤独死」昨年5.8万人 警察庁初集計、発見に1カ月以上7.8% (Nikkei, 2025-04-11) + NPA PDF table. Published 2025-04-11. Accessed 2026-10-08. (paywalled)Used for: jp-npa-2024-65plus-found-after-1-month
- [49]New England Journal of Medicine. Gurley RJ, Lum N, Sande M, Lo B, Katz MH. Persons found in their homes helpless or dead. N Engl J Med 1996;334:1710-6 (PMID 8637517). Published 1996-06-27. Accessed 2026-10-11. (paywalled)Used for: gurley-1996-incapacitated-over-12h-31pct, us-sf-1993-time-helpless-among-found-dead, gurley-1996-median-time-incapacitated, gurley-1996-helpless-over-3-days-10pct-38pct-survived, us-sf-1993-who-found-them, gurley-1996-mortality-helpless-over-72h, gurley-1996-mortality-helpless-under-1h, gurley-1996-total-mortality-28pct, us-sf-1993-found-helpless-or-dead-share-found-dead, gurley-1996-not-independent-62pct, gurley-1996-two-thirds-hospitalized-died-or-dependent, gurley-1996-admitted-62pct, gurley-1996-icu-52pct, gurley-1996-in-hospital-mortality-10pct, gurley-1996-discharged-to-institutions-77pct, gurley-1996-dehydration-42-of-261, gurley-1996-cost-per-patient-9985, gurley-1996-incidence-65plus-living-alone, gurley-1996-incidence-by-age, gurley-1996-incidence-men-85-living-alone, gurley-1996-events-in-12-weeks, gurley-1996-only-one-had-alarm-device
- [50]Ministry of Health and Welfare, Republic of Korea. 2024년 고독사 사망자 실태조사 결과 발표. Published 2024-10-17. Accessed 2026-10-08.Used for: kr-mohw-godoksa-2023-male-share, kr-mohw-godoksa-non-suicide-2017-2023, kr-mohw-godoksa-growth-rate-2017-2021-vs-2019-2023, kr-mohw-godoksa-2022-count, kr-mohw-godoksa-2023-count, kr-mohw-godoksa-2017-per-100-deaths, kr-mohw-godoksa-2018-per-100-deaths, kr-mohw-godoksa-2019-per-100-deaths, kr-godoksa-definition-time-clause-deleted-2024, kr-mohw-2024-prevention-pilot-229-districts
- [51]BMC Geriatrics (peer-reviewed, open access). Vural T, Kalkan SA. Decomposition and medicolegal autopsy in geriatric in-home non-traumatic deaths: histopathological findings and a public health perspective. BMC Geriatr 2026;26:313 (PMID 41639798). Published 2026-02-05. Accessed 2026-10-11.Used for: tr-2026-decomposed-geriatric-home-deaths-living-alone
- [52]Journal of the Royal Society of Medicine (SAGE; peer-reviewed). Hiam L, Estrin-Serlui T, Dorling D, McKee M, Minton J. A deathly silence: why has the number of people found decomposed in England and Wales been rising? J R Soc Med 2024;117(5) (PMID 37989250, PMC11284264). Published 2024-05. Accessed 2026-10-11.Used for: hiam-2024-ew-undefined-deaths-men-3x-women-by-age, estrin-serlui-2023-decomposed-home-deaths-all-lived-alone, uk-jrsm-2024-undefined-deaths-rising-1979-2020, hiam-2024-london-unascertained-postmortems-90pct-severe-decomposition, hiam-2024-london-severely-decomposed-only-16pct-unascertained
- [53]Archiv fuer Kriminologie (peer-reviewed; Institute of Forensic Medicine, Justus Liebig University Giessen). Merz M, Heidorn F, Birngruber CG, et al. [Definition of a 'domestic-setting corpse': a retrospective study of 211 discoveries]. Arch Kriminol 2012;230(3-4):115-27 (PMID 23136701). Published 2012-09. Accessed 2026-10-11. (abstract only)Used for: merz-2012-giessen-domestic-setting-corpses-men-3-to-1
- [54]Ulusal Travma ve Acil Cerrahi Dergisi / Turkish Journal of Trauma and Emergency Surgery (peer-reviewed; Turkish with English abstract). Erel O et al. [Evaluation of traumatic findings in decomposed bodies in Aydin]. Ulus Travma Acil Cerrahi Derg 2011;17(4):340-3 (PMID 21935833). Published 2011-07. Accessed 2026-10-11. (abstract only)Used for: erel-2011-aydin-decomposed-bodies-4-5pct-of-forensic-autopsies
- [55]Seoul Metropolitan Government (서울특별시), 내 손안에 서울. "외로운 죽음 막는다" 1인가구 고독사 예방사업 강화 (4th Seoul lonely-death prevention plan). Published 2021-05-13. Accessed 2026-10-11.Used for: kr-seoul-2020-godoksa-middle-aged-share, kr-seoul-2020-godoksa-own-count, kr-seoul-2020-unclaimed-deaths
- [56]Office for National Statistics (Nomis dataset NM_161_1). Mortality statistics - underlying cause, sex and age (Nomis NM_161_1), England and Wales, cause R99 by five-year age band. Accessed 2026-10-11.Used for: uk-ons-2025-r99-deaths-age-profile
- [57]SN Social Sciences (Springer Nature; peer-reviewed). Toyama S, Poudyal H. Prevalence of kodokushi (solitary deaths) in the Tokyo metropolitan area. SN Soc Sci 2021;1(7) (doi:10.1007/s43545-021-00169-8). Published 2021-06-25. Accessed 2026-10-11. (abstract only)Used for: toyama-2021-tokyo-kodokushi-quarter-under-60-2016
- [58]Osaka Prefectural Government, Medical Examiner's Office (大阪府健康医療部監察医事務所). 同居の孤独死(孤独死数(同居)の推移). Published 2026-04-20. Accessed 2026-10-11.Used for: jp-osaka-me-2025-kodokushi-living-with-family-4plus-days
- [59]Science & Justice (Elsevier; peer-reviewed). Nomura M, McLean S, Miyamori D, Kakiuchi Y, Ikegaya H. Isolation and unnatural death of elderly people in the aging Japanese society. Sci Justice 2016;56(2):80-3 (PMID 26976464). Published 2016-01-05. Accessed 2026-10-11. (abstract only)Used for: nomura-2016-kyoto-65plus-with-family-found-after-3-days-2009-2013, nomura-2016-kyoto-65plus-with-family-found-after-3-days-1989-1993, nomura-2016-kyoto-65plus-living-alone-found-after-3-days-2009-2013, nomura-2016-kyoto-65plus-living-alone-found-after-3-days-1989-1993, nomura-2016-kyoto-65plus-unknown-cause-of-death-20-30pct
- [60]Legal Medicine (Tokyo) (Elsevier; peer-reviewed). Yamasaki Y et al. Factors that delay discovery in cases of death at home in Japan. Leg Med (Tokyo) 2026;84:102895 (PMID 42364373). Published 2026-06-18. Accessed 2026-10-11. (abstract only)Used for: yamasaki-2026-okayama-late-found-living-with-others-23pct
- [61]Forensic Science International (Elsevier; peer-reviewed; University of Athens). Karydi C et al. Late discovery of bodies in indoor settings: A forensic practitioner's view on recognizing cases of social isolation in eastern Attica, Greece. Forensic Sci Int 2025;368:112395 (PMID 39929032). Published 2025-02-06. Accessed 2026-10-11. (abstract only)Used for: gr-attica-2025-late-discovery-indoor-profile
- [62]Journal of the American Geriatrics Society (Wiley; Icahn School of Medicine at Mount Sinai authors). Plick NP, Ankuda CK, Mair CA, Husain M, Ornstein KA. A national profile of kinlessness at the end of life among older adults: Findings from the Health and Retirement Study. J Am Geriatr Soc 2021;69(8):2143-2151 (PMID 33880751). Published 2021-04-21. Accessed 2026-10-11. (abstract only)Used for: plick-2021-us-decedents-kinless-at-end-of-life-7-4pct
- [63]Journal of the American Geriatrics Society (Wiley; UCSF / University of Chicago authors). Kotwal AA, Cenzer IS, Waite LJ, et al. The epidemiology of social isolation and loneliness among older adults during the last years of life. J Am Geriatr Soc 2021;69(11):3081-3091 (PMID 34247388). Published 2021-07-11. Accessed 2026-10-11. (abstract only)Used for: kotwal-2021-us-socially-isolated-last-3-months-27pct, kotwal-2021-us-socially-isolated-last-4-years-19pct
- [64]Journal of Korean Medical Science (Korean Academy of Medical Sciences; peer-reviewed, open access). Koo HY, Bai H et al. Potential Risk Factors for Lonely Death: A Nationwide Case-Control Study in Korea. J Korean Med Sci 2025;40(50):e335 (PMID 41468915, PMC12748055). Published 2025-12-29. Accessed 2026-10-11.Used for: koo-2025-korea-lonely-death-lowest-income-aor-14, koo-2025-korea-lonely-death-alcohol-use-disorder-19-6pct, koo-2025-korea-lonely-death-mood-disorders-32-7pct
- [65]Journal of Korean Medical Science. Koo HY, Bai H, et al. Potential Risk Factors for Lonely Death: A Nationwide Case-Control Study in Korea. J Korean Med Sci 2025;40(50):e335. doi:10.3346/jkms.2025.40.e335. Published 2025-12-29. Accessed 2026-10-11.Used for: koo-2025-kr-lonely-death-medical-aid-low-income
- [66]Journal of Preventive Medicine and Public Health (peer-reviewed, open access). Bai H et al. Who Dies Alone? Demographics, Underlying Diseases, and Healthcare Utilization Patterns of Lonely Death Individuals in Korea. J Prev Med Public Health 2025;58(2):218-226 (PMID 40045675, PMC11986590). Published 2025-03-04. Accessed 2026-10-11.Used for: bai-2025-korea-lonely-death-medical-aid-30-8pct
- [67]Ministry of Health and Welfare, Republic of Korea (보건복지부), with other ministries. 제1차 고독사 예방 기본계획(’23∼’27) (1st Basic Plan for the Prevention of Lonely Deaths, full text, HWP attachment). Published 2023-05-18. Accessed 2026-10-11.Used for: kr-mohw-2021-godoksa-social-security-history, kr-mohw-2021-godoksa-health-history, kr-mohw-2023-seoul-busan-3-day-criterion, kr-mohw-2019-unclaimed-deaths, kr-mohw-2020-unclaimed-deaths, kr-mohw-2021-unclaimed-deaths, kr-mohw-2023-risk-group-estimate, kr-mohw-2023-risk-group-by-age, kr-mohw-2023-basic-plan-target
- [68]Journal of Nippon Medical School (peer-reviewed, open access). Kanawaku Y, Ohno Y. Solitary Deaths in the Tokyo Metropolis and Labor Force Status: Characteristics of Unnatural Deaths at Home among Persons Living Alone. J Nippon Med Sch 2019;86(6):360-363 (PMID 31308315). Published 2020-01-10. Accessed 2026-10-11.Used for: kanawaku-2020-tokyo23-solitary-deaths-not-employed-men-79pct, kanawaku-2020-tokyo23-non-employed-median-interval-3-8-days
- [69]American Journal of Forensic Medicine and Pathology (Wolters Kluwer; peer-reviewed). Waters DM, Eckhardt M, Eason EA. Characteristics of Deaths With Evidence of Pathological Hoarding in Cook County 2017 to 2018. Am J Forensic Med Pathol 2022;43(1):2-6 (PMID 34334623). Published 2022-03. Accessed 2026-10-11. (abstract only)Used for: waters-2022-cook-county-hoarding-deaths-decomposed-61pct
- [70]Tokyo Metropolitan Medical Examiner's Office (東京都監察医務院). 東京都監察医務院 令和7年版統計表及び統計図表 (13)~(19) (15) 一人暮らしの者の死因. Published 2026-03. Accessed 2026-10-11.Used for: jp-tokyo23-me-2024-living-alone-cause-of-death, jp-tokyo23-me-2024-65plus-living-alone-place-of-death, jp-tokyo23-me-2024-65plus-home-deaths-who-found, jp-tokyo23-me-2024-living-alone-who-found-all-ages, jp-tokyo23-me-2021-living-alone-deaths-examined, jp-tokyo23-me-2022-living-alone-deaths-examined, jp-tokyo23-me-2023-living-alone-deaths-examined, jp-tokyo23-me-2024-living-alone-deaths-examined
- [71]Ministry of Internal Affairs and Communications, Chubu Regional Administrative Evaluation Bureau. 公的住宅における孤立死防止対策に関する実態把握の結果(報道資料). Published 2012-11. Accessed 2026-10-11.Used for: jp-mic-chubu-2012-aichi-public-housing-isolated-deaths
- [72]Cabinet Office of Japan (高齢社会白書), citing the Urban Renaissance Agency. 平成26年版高齢社会白書 第1章第2節6(5) 図1-2-6-18 単身居住者で死亡から相当期間経過後に発見された件数. Published 2014-06. Accessed 2026-10-11.Used for: jp-ur-fy2012-residents-found-after-1-week, jp-ur-fy2008-residents-found-after-1-week, jp-tokyo23-me-2002-65plus-living-alone-home-deaths
- [73]BC Coroners Service (Death Review Panel). Extreme Heat and Human Mortality: A Review of Heat-Related Deaths in B.C. in Summer 2021 (Report to the Chief Coroner of British Columbia). Published 2022-06-07. Accessed 2026-10-11.Used for: ca-bccs-2022-heat-dome-deaths-56pct-lived-alone, ca-bccs-2022-heat-dome-deaths-98pct-indoors, ca-bccs-2022-heat-dome-deaths-67pct-aged-70plus, ca-bccs-2022-heat-dome-deaths-half-found-by-wellness-check
- [74]Multnomah County Health Department (Oregon). Final Report: Health Impacts from Excessive Heat Events in Multnomah County, Oregon, 2021. Published 2022-06. Accessed 2026-10-11.Used for: us-multco-2022-heat-deaths-71pct-lived-alone, us-multco-2022-heat-deaths-94pct-in-own-residence
- [75]Direction régionale de santé publique de Montréal (CIUSSS du Centre-Sud-de-l'Île-de-Montréal). Enquête épidémiologique : Vague de chaleur à l'été 2018 à Montréal (2019). Published 2019. Accessed 2026-10-11.Used for: ca-drsp-montreal-2019-heat-2018-deaths-69pct-lived-alone
- [76]New England Journal of Medicine (CDC Epidemic Intelligence Service authors). Semenza JC, Rubin CH, Falter KH, et al. Heat-related deaths during the July 1995 heat wave in Chicago. N Engl J Med 1996;335(2):84-90 (PMID 8649494). Published 1996-07-11. Accessed 2026-10-11. (abstract only)Used for: semenza-1996-chicago-heat-death-living-alone-or-2-3, semenza-1996-chicago-heat-death-not-leaving-home-or-6-7
- [77]Maricopa County Department of Public Health (Epidemiology & Informatics). 2024 Heat-Related Deaths Report, Maricopa County (May 2025). Published 2025-05. Accessed 2026-10-11.Used for: us-maricopa-2024-indoor-heat-deaths-found-by-welfare-check-68pct
- [78]Maricopa County Department of Public Health (Epidemiology & Informatics). 2025 Heat-Related Deaths Report, Maricopa County (April 2026). Published 2026-04. Accessed 2026-10-11.Used for: us-maricopa-2025-indoor-heat-deaths-found-by-welfare-check-48pct
- [79]Ayuntamiento de Madrid (Coordinator General of Security and Emergencies), via 65ymas and Público. 65ymas: Los bomberos de Madrid han encontrado 62 mayores muertos solos en sus casas durante el confinamiento (21 May 2020). Published 2020-05-21. Accessed 2026-10-11.Used for: es-madrid-2020-firefighters-older-found-dead-lockdown
- [80]Netherlands Forensic Institute (NFI), Ministry of Justice and Security. Onopgemerkt gestorven, niet ongezien gebleven (NFI background story, undated). Accessed 2026-10-11.Used for: nl-nfi-dna-identification-requests-per-week, nl-nfi-identifications-three-big-cities-share
- [81]Tokyo Metropolitan Medical Examiner's Office (東京都監察医務院). 東京都監察医務院 平成15年版統計表 (17) 65歳以上の一人暮らしの者の死亡場所 / (18) 65歳以上の一人暮らしの者の自宅で死亡した時の発見者. Published 2003. Accessed 2026-10-11.Used for: jp-tokyo23-me-2002-65plus-home-deaths-found-by-family
- [82]Tokyo Metropolitan Medical Examiner's Office (東京都監察医務院). 東京都監察医務院 平成25年版統計表 (17) 65歳以上の一人暮らしの者の死亡場所 / (18) 65歳以上の一人暮らしの者の自宅で死亡した時の発見者. Published 2013. Accessed 2026-10-11.Used for: jp-tokyo23-me-2012-65plus-home-deaths-found-by-family
- [83]Osaka Prefectural Government, Medical Examiner's Office (大阪府健康医療部監察医事務所). 独居の孤独死(孤独死数(独居)の推移). Published 2026-07-24. Accessed 2026-10-11.Used for: jp-osaka-me-2025-kodokushi-living-alone-4plus-days, jp-osaka-me-2017-kodokushi-living-alone-4plus-days, jp-osaka-me-2018-kodokushi-living-alone-4plus-days, jp-osaka-me-2019-kodokushi-living-alone-4plus-days, jp-osaka-me-2020-kodokushi-living-alone-4plus-days, jp-osaka-me-2021-kodokushi-living-alone-4plus-days, jp-osaka-me-2022-kodokushi-living-alone-4plus-days, jp-osaka-me-2023-kodokushi-living-alone-4plus-days, jp-osaka-me-2024-kodokushi-living-alone-4plus-days
- [84]Ministry of Health, Labour and Welfare of Japan (人口動態統計). 人口動態統計(確定数)令和7年 下巻 死亡 第1表-1 死亡数,性・年齢(5歳階級)・死因(三桁基本分類)別(ICD-10コード A~T). Published 2026-09-30. Accessed 2026-10-11.Used for: jp-mhlw-2025-icd-r98-unattended-deaths, jp-mhlw-2025-icd-r99-ill-defined-deaths
- [85]Ministry of Health, Labour and Welfare of Japan (人口動態統計). 人口動態統計(確定数)平成7年 下巻 死亡 第1表-1 死亡数,性・年齢(5歳階級)・死因(三桁基本分類)別(ICD-10コード A~T). Published 2019-05-07. Accessed 2026-10-11.Used for: jp-mhlw-1995-icd-r99-ill-defined-deaths, jp-mhlw-1995-icd-r98-unattended-deaths
- [86]World Health Organization, WHO Mortality Database (data supplied by the Federal Statistical Office of Germany, Destatis). WHO Mortality Database, raw data files Morticd10 (ICD-10 detailed list 104), country 4085 Germany. Published 2026-02-22. Accessed 2026-10-11.Used for: de-who-mdb-r98-unattended-deaths-2019, de-who-mdb-r98-unattended-deaths-1998, de-who-mdb-r98-unattended-deaths-1999, de-who-mdb-r98-unattended-deaths-2000, de-who-mdb-r98-unattended-deaths-2001, de-who-mdb-r98-unattended-deaths-2002, de-who-mdb-r98-unattended-deaths-2003, de-who-mdb-r98-unattended-deaths-2004, de-who-mdb-r98-unattended-deaths-2005, de-who-mdb-r98-unattended-deaths-2006, de-who-mdb-r98-unattended-deaths-2007, de-who-mdb-r98-unattended-deaths-2008, de-who-mdb-r98-unattended-deaths-2009, de-who-mdb-r98-unattended-deaths-2010, de-who-mdb-r98-unattended-deaths-2011, de-who-mdb-r98-unattended-deaths-2012, de-who-mdb-r98-unattended-deaths-2013, de-who-mdb-r98-unattended-deaths-2014, de-who-mdb-r98-unattended-deaths-2015, de-who-mdb-r98-unattended-deaths-2016, de-who-mdb-r98-unattended-deaths-2017, de-who-mdb-r98-unattended-deaths-2018, de-who-mdb-r98-unattended-deaths-2020
- [87]Journal of the Royal Society of Medicine (peer-reviewed; Hiam et al.) using ONS mortality data. Hiam L, Estrin-Serlui T, Dorling D, McKee M, Minton J. A deathly silence: why has the number of people found decomposed in England and Wales been rising? J R Soc Med 2024;117(5):172-181, Supplementary Appendix II, Table 1. Published 2023-11-21. Accessed 2026-10-11.Used for: hiam-2024-undefined-deaths-ew-2001-to-2018-rise, hiam-2024-undefined-deaths-ew-1979, hiam-2024-undefined-deaths-ew-1980, hiam-2024-undefined-deaths-ew-1981, hiam-2024-undefined-deaths-ew-1982, hiam-2024-undefined-deaths-ew-1983, hiam-2024-undefined-deaths-ew-1984, hiam-2024-undefined-deaths-ew-1985, hiam-2024-undefined-deaths-ew-1986, hiam-2024-undefined-deaths-ew-1987, hiam-2024-undefined-deaths-ew-1988, hiam-2024-undefined-deaths-ew-1989, hiam-2024-undefined-deaths-ew-1990, hiam-2024-undefined-deaths-ew-1991, hiam-2024-undefined-deaths-ew-1992, hiam-2024-undefined-deaths-ew-1993, hiam-2024-undefined-deaths-ew-1994, hiam-2024-undefined-deaths-ew-1995, hiam-2024-undefined-deaths-ew-1996, hiam-2024-undefined-deaths-ew-1997, hiam-2024-undefined-deaths-ew-1998, hiam-2024-undefined-deaths-ew-1999, hiam-2024-undefined-deaths-ew-2000, hiam-2024-undefined-deaths-ew-2001, hiam-2024-undefined-deaths-ew-2002, hiam-2024-undefined-deaths-ew-2003, hiam-2024-undefined-deaths-ew-2004, hiam-2024-undefined-deaths-ew-2005, hiam-2024-undefined-deaths-ew-2006, hiam-2024-undefined-deaths-ew-2007, hiam-2024-undefined-deaths-ew-2008, hiam-2024-undefined-deaths-ew-2009, hiam-2024-undefined-deaths-ew-2010, hiam-2024-undefined-deaths-ew-2011, hiam-2024-undefined-deaths-ew-2012, hiam-2024-undefined-deaths-ew-2013, hiam-2024-undefined-deaths-ew-2014, hiam-2024-undefined-deaths-ew-2015, hiam-2024-undefined-deaths-ew-2016, hiam-2024-undefined-deaths-ew-2017, hiam-2024-undefined-deaths-ew-2018, hiam-2024-undefined-deaths-ew-2019, hiam-2024-undefined-deaths-ew-2020, hiam-2024-undefined-deaths-ew-2021
- [88]Journal of Forensic Sciences (peer-reviewed). Thiblin IB et al. Relationships between the deinstitutionalization of healthcare for patients with mental disorder, substance abuse, and isolated death. J Forensic Sci 2004;49(2):354-60 (PMID 15027560). Published 2004-03. Accessed 2026-10-11. (abstract only)Used for: thiblin-2004-stockholm-isolated-death-definition-1-week
- [89]Journal of Forensic Sciences (peer-reviewed; Institute of Forensic Medicine, University of Vienna). Hönigschnabl S et al. Discovery of decomposed and mummified corpses in the domestic setting--a marker of social isolation? J Forensic Sci 2002;47(4):837-42 (PMID 12136994). Published 2002-07. Accessed 2026-10-11. (abstract only)Used for: at-vienna-2002-decomposed-at-home-1990s-vs-1960s
- [90]National Records of Scotland. Vital events reference tables 2024, chapter 6, Table 6.01: Deaths by sex and cause, Scotland, 2011 to 2024. Published 2025-08-26. Accessed 2026-10-11.Used for: uk-nrs-2011-r96-r99-deaths-scotland, uk-nrs-2012-r96-r99-deaths-scotland, uk-nrs-2013-r96-r99-deaths-scotland, uk-nrs-2014-r96-r99-deaths-scotland, uk-nrs-2015-r96-r99-deaths-scotland, uk-nrs-2016-r96-r99-deaths-scotland, uk-nrs-2017-r96-r99-deaths-scotland, uk-nrs-2018-r96-r99-deaths-scotland, uk-nrs-2019-r96-r99-deaths-scotland, uk-nrs-2020-r96-r99-deaths-scotland, uk-nrs-2021-r96-r99-deaths-scotland, uk-nrs-2022-r96-r99-deaths-scotland, uk-nrs-2023-r96-r99-deaths-scotland, uk-nrs-2024-r96-r99-deaths-scotland
- [91]Ministry of Health, Labour and Welfare of Japan (人口動態統計). 人口動態統計(確定数)平成17年 下巻 死亡 第1表-1 死亡数,性・年齢(5歳階級)・死因(三桁基本分類)別(ICD-10コード A~T). Published 2006-11-30. Accessed 2026-10-11.Used for: jp-mhlw-2005-icd-r98-unattended-deaths
- [92]Ministry of Health, Labour and Welfare of Japan (人口動態統計). 人口動態統計(確定数)平成27年 下巻 死亡 第1表-1 死亡数,性・年齢(5歳階級)・死因(三桁基本分類)別(ICD-10コード A~T). Published 2021-03-31. Accessed 2026-10-11.Used for: jp-mhlw-2015-icd-r98-unattended-deaths
- [93]Journal of Clinical Pathology (BMJ; peer-reviewed). Estrin-Serlui T, Osborn M. Putrefaction in the pandemic: a comparative study of the frequency of advanced decomposition change in coronial autopsies since the start of the COVID-19 pandemic. J Clin Pathol 2023;76(2):121-125 (PMID 34535567). Published 2021-09-17. Accessed 2026-10-11. (abstract only)Used for: uk-london-2023-lockdown-decomposition-increase
- [94]Academic Forensic Pathology (SAGE; peer-reviewed). Bates AWH. Characteristics of Coronial Autopsy Cases in the London Area of the United Kingdom, Pre and Post COVID-19 Lockdown. Acad Forensic Pathol 2023;13(1):3-8 (PMID 37091199, PMC10119866). Published 2023-04-18. Accessed 2026-10-11.Used for: bates-2023-london-advanced-decomposition-12pct-post-lockdown
- [95]Office for National Statistics. Excess deaths in England and Wales: March 2020 to December 2022. Published 2023-03-09. Accessed 2026-10-11.Used for: uk-ons-2023-private-homes-excess-non-covid-2020-2022, uk-ons-2023-private-homes-ill-defined-excess-2020-2022
- [96]Office for National Statistics. Deaths registered in private homes, England and Wales: 2020 final and January to June 2021 provisional. Published 2021-11-10. Accessed 2026-10-11.Used for: uk-ons-2020-private-home-deaths-excess
- [97]ISTAT (Istituto Nazionale di Statistica). Prima ondata della pandemia. Un'analisi della mortalità per causa e luogo del decesso, marzo-aprile 2020 (21 Apr 2021). Published 2021-04-21. Accessed 2026-10-11.Used for: it-istat-2020-home-deaths-up-27pct-first-wave
- [98]National Institute of Population and Social Security Research (IPSS), Japan. 日本の世帯数の将来推計(全国推計)(令和6(2024)年推計). Published 2024-04-12. Accessed 2026-10-08.Used for: jp-ipss-2050-elderly-single-person-households, jp-ipss-2050-never-married-share-65plus-living-alone, jp-ipss-2050-65plus-living-alone-rate
- [99]Statistics Korea (통계청; now Ministry of Data and Statistics). 장래가구추계 전국편: 2022~2052년 (Household Projections, national, 2022-2052) press release. Published 2024-09-12. Accessed 2026-10-11.Used for: kr-kostat-2052-65plus-one-person-households-4-96-million
- [100]Office for National Statistics (ONS). Household projections for England: 2022-based. Published 2025-10-28. Accessed 2026-10-11.Used for: uk-ons-2032-england-85plus-living-alone-973000
- [101]Proceedings of the National Academy of Sciences (PNAS). Projections of white and black older adults without living kin in the United States, 2015 to 2060. Published 2017-10-02. Accessed 2026-10-11.Used for: verdery-2017-us-kinless-50plus-21-1-million-by-2060, verdery-2017-us-no-close-kin-50plus-6-3-million-by-2060
- [102]The Journals of Gerontology: Series B (Oxford University Press). Older Adults Without Close Kin in the United States. Published 2017-07-01. Accessed 2026-10-11.Used for: margolis-2017-us-55plus-no-spouse-or-children-6-6pct
- [103]U.S. Census Bureau. American Community Survey 2024 1-Year Estimates, Table B09021: Living Arrangements of Adults 18 Years and Over by Age. Accessed 2026-10-09.Used for: us-acs-2024-65plus-lives-alone-count
- [104]Eurostat. Persons by household composition and labour status (EU-LFS, lfst_hhindws) - 'One adult without resident children', age 65+. Published 2026-09-10. Accessed 2026-10-09.Used for: eu-eurostat-lfs-2025-65plus-living-alone-count
- [105]Office for National Statistics (ONS). Families and households, UK (dataset) - Table 6: People living alone by age and sex, United Kingdom, 1996 to 2025. Published 2026-04-17. Accessed 2026-10-09.Used for: uk-ons-lfs-2025-65plus-living-alone-count
- [106]Ministry of Health, Labour and Welfare, Japan (厚生労働省). 2024(令和6)年 国民生活基礎調査の概況 — 世帯の状況 / 65歳以上の者の状況. Published 2025-07-04. Accessed 2026-10-11.Used for: jp-mhlw-2024-65plus-living-alone-count
- [107]Ministry of Data and Statistics, Republic of Korea (국가데이터처). 2025년 인구주택총조사 결과(등록센서스 방식) 보도자료. Published 2026-07-28. Accessed 2026-10-09.Used for: kr-kostat-census-2025-elderly-one-person-households
- [108]Statistics Canada. Table 98-10-0134-01 Census family status and household living arrangements, household type of person, age group and gender. Published 2022-07-13. Accessed 2026-10-11.Used for: ca-statcan-2021-65plus-living-alone
- [109]Australian Bureau of Statistics. Disability, Ageing and Carers, Australia: Summary of Findings, 2022. Published 2024-07-04. Accessed 2026-10-11.Used for: au-abs-sdac-2022-65plus-living-alone-27-6pct
- [110]Stats NZ (Tatauranga Aotearoa). How we live - a look at families and households from the 2023 Census (news release). Published 2024-11-07. Accessed 2026-10-11.Used for: nz-statsnz-2023-65plus-living-alone-25-3pct, nz-statsnz-2023-65plus-living-alone-count
- [111]Instituto Nacional de Estadística (INE). Censos de Población y Viviendas 2021 - Resultados sobre Hogares y Viviendas (nota de prensa, 30 Jun 2023). Published 2023-06-30. Accessed 2026-10-11.Used for: es-ine-2021-65plus-one-person-households
- [112]Singapore Department of Statistics (via data.gov.sg). Residents Aged 65 Years And Over In Resident Households By Living Arrangement And Age Group, Annual (table M810821). Published 2026-06-30. Accessed 2026-10-11.Used for: sg-singstat-2025-65plus-living-alone, sg-singstat-2020-65plus-living-alone, sg-singstat-2015-65plus-living-alone, sg-singstat-2010-65plus-living-alone
- [113]Ministry of Health, Singapore. Data on seniors aged 65 and above living alone and plans for new initiatives to prevent unattended deaths (Parliamentary QA, 15 Oct 2025). Published 2025-10-15. Accessed 2026-10-11.Used for: sg-moh-2024-seniors-living-alone
- [114]Census and Statistics Department, Hong Kong SAR. 2021 Population Census Thematic Report: Older Persons. Published 2023-02-23. Accessed 2026-10-11.Used for: hk-csd-2021-65plus-living-alone
- [115]Census and Statistics Department, Hong Kong SAR. The Profile of the Population in One-person Households in 2021 (Hong Kong Monthly Digest of Statistics, March 2023, feature article). Published 2023-03. Accessed 2026-10-11.Used for: hk-csd-2011-65plus-one-person-households
- [116]Research Office, Legislative Council Secretariat, Hong Kong SAR. Measures to tackle solitary deaths in South Korea (Essentials ISE06/2025). Published 2025-09-30. Accessed 2026-10-11.Used for: hk-legco-2025-one-person-households, hk-legco-2025-unclaimed-bodies
- [117]Directorate-General of Budget, Accounting and Statistics, Taiwan (行政院主計總處). 109年人口及住宅普查初步統計結果 新聞稿 (2020 Population and Housing Census, preliminary results, press release PDF linked from https://www.dgbas.gov.tw/News_Content.aspx?n=3602&s=27386). Published 2021-08-31. Accessed 2026-10-11.Used for: tw-dgbas-census-2020-65plus-living-alone, tw-dgbas-census-2010-65plus-living-alone, tw-dgbas-census-2000-65plus-living-alone
- [118]Department of Statistics, Ministry of the Interior, Taiwan (內政部統計處). 內政統計通報 113年第24週: 112年6月底65歲以上長者419萬人,其中獨居占23.3%. Published 2024-06-14. Accessed 2026-10-11.Used for: tw-moi-2023-register-65plus-living-alone
- [119]National Bureau of Statistics of China (国家统计局), Office of the Seventh National Population Census. 中国人口普查年鉴-2020, 表5-5 各地区有65岁及以上人口的家庭户户数. Published 2022. Accessed 2026-10-11.Used for: cn-nbs-census-2020-65plus-living-alone-households
- [120]National Bureau of Statistics of China (国家统计局), Office of the Sixth National Population Census. 中国2010年人口普查资料, 表5-5 各地区有65岁及以上老年人口的家庭户户数. Published 2012. Accessed 2026-10-11.Used for: cn-nbs-census-2010-65plus-living-alone-households
- [121]National Bureau of Statistics of China (国家统计局), Office of the Seventh National Population Census. 中国人口普查年鉴-2020, 表8-5 全国分性别、居住状况、健康状况的60岁及以上老年人口 (long-form sample). Published 2022. Accessed 2026-10-11.Used for: cn-nbs-census-2020-60plus-living-alone-share
- [122]Centers for Disease Control and Prevention, National Center for Health Statistics (CDC WONDER). CDC WONDER, Underlying Cause of Death 2018-2024, Single Race (NVSS Mortality 2018-2024, released 2026); deaths grouped by Year and Place of Death. Published 2026. Accessed 2026-10-11.Used for: us-cdc-wonder-2022-r98-unattended-death-code-rarely-used, us-cdc-wonder-2024-r99-unknown-cause-deaths-at-home, us-cdc-wonder-2024-home-deaths-share, us-cdc-wonder-2024-medical-facility-deaths-vs-home, us-cdc-wonder-2024-65plus-home-deaths-share, us-cdc-wonder-2018-65plus-home-deaths-share, us-cdc-wonder-2019-65plus-home-deaths-share, us-cdc-wonder-2020-65plus-home-deaths-share, us-cdc-wonder-2021-65plus-home-deaths-share, us-cdc-wonder-2022-65plus-home-deaths-share, us-cdc-wonder-2023-65plus-home-deaths-share, us-cdc-wonder-2018-home-deaths-share, us-cdc-wonder-2018-hospital-inpatient-deaths-share, us-cdc-wonder-2019-home-deaths-share, us-cdc-wonder-2019-hospital-inpatient-deaths-share, us-cdc-wonder-2020-home-deaths-share, us-cdc-wonder-2020-hospital-inpatient-deaths-share, us-cdc-wonder-2021-home-deaths-share, us-cdc-wonder-2021-hospital-inpatient-deaths-share, us-cdc-wonder-2022-home-deaths-share, us-cdc-wonder-2022-hospital-inpatient-deaths-share, us-cdc-wonder-2023-home-deaths-share, us-cdc-wonder-2023-hospital-inpatient-deaths-share, us-cdc-wonder-2024-hospital-inpatient-deaths-share
- [123]Tokyo Metropolitan Medical Examiner's Office (東京都監察医務院). 東京都23区における孤独死統計(平成15~19年):世帯分類別異状死統計調査 第1章. Published 2011. Accessed 2026-10-11.Used for: jp-tokyo-me-kodokushi-definition
- [124]Korea Institute for Health and Social Affairs (한국보건사회연구원) for the Ministry of Health and Welfare. 2022년 고독사 예방 실태조사 연구 (research report behind the first lonely-death survey; posted on the MOHW research board). Published 2024-01-23. Accessed 2026-10-11.Used for: kr-godoksa-act-in-force-2021
- [125]Seoul Welfare Foundation (서울시복지재단). 서울시 고독사 위험계층 실태조사 연구 (Song I, Mo E; research report). Published 2021-11-30. Accessed 2026-10-11.Used for: kr-swf-2020-seoul-at-risk-deaths-found-3plus-days
- [126]Archiv für Kriminologie (peer-reviewed; German with English abstract). Merz M et al. [Criteria for the classification as a 'domestic-setting corpse': a literature search and review to define the term]. Arch Kriminol 2011;228(5-6):191-202 (PMID 22276370). Published 2011-11. Accessed 2026-10-11. (abstract only)Used for: merz-2011-domestic-setting-corpse-definition-24-hours
- [127]Bundesinstitut fuer Arzneimittel und Medizinprodukte (BfArM) / WHO. ICD-10-WHO Version 2019, Block R95-R99 Ungenau bezeichnete und unbekannte Todesursachen. Published 2018-08-24. Accessed 2026-10-11.Used for: de-bfarm-icd10-r98-definition
- [128]Journal of the Royal Society of Medicine (peer-reviewed; Hiam et al.) using ONS mortality data; email from the Office for National Statistics, 26 October 2023. Hiam L, Estrin-Serlui T, Dorling D, McKee M, Minton J. A deathly silence: why has the number of people found decomposed in England and Wales been rising? J R Soc Med 2024;117(5):172-181, Supplementary Appendix I (ONS correspondence). Published 2023-11-21. Accessed 2026-10-11.Used for: uk-ons-2023-r98-unattended-death-never-certified
- [129]Centers for Disease Control and Prevention, National Center for Health Statistics (CDC WONDER). CDC WONDER, Underlying Cause of Death 1999-2020 (NVSS Mortality 1999-2020, released 2021); deaths grouped by Year and Place of Death, all ages, all causes. Published 2021. Accessed 2026-10-11.Used for: us-cdc-wonder-1999-r99-unknown-cause-deaths-at-home, us-cdc-wonder-2016-home-overtakes-hospital-inpatient, us-cdc-wonder-1999-home-deaths-share, us-cdc-wonder-1999-hospital-inpatient-deaths-share, us-cdc-wonder-2000-home-deaths-share, us-cdc-wonder-2000-hospital-inpatient-deaths-share, us-cdc-wonder-2001-home-deaths-share, us-cdc-wonder-2001-hospital-inpatient-deaths-share, us-cdc-wonder-2002-home-deaths-share, us-cdc-wonder-2002-hospital-inpatient-deaths-share, us-cdc-wonder-2003-home-deaths-share, us-cdc-wonder-2003-hospital-inpatient-deaths-share, us-cdc-wonder-2004-home-deaths-share, us-cdc-wonder-2004-hospital-inpatient-deaths-share, us-cdc-wonder-2005-home-deaths-share, us-cdc-wonder-2005-hospital-inpatient-deaths-share, us-cdc-wonder-2006-home-deaths-share, us-cdc-wonder-2006-hospital-inpatient-deaths-share, us-cdc-wonder-2007-home-deaths-share, us-cdc-wonder-2007-hospital-inpatient-deaths-share, us-cdc-wonder-2008-home-deaths-share, us-cdc-wonder-2008-hospital-inpatient-deaths-share, us-cdc-wonder-2009-home-deaths-share, us-cdc-wonder-2009-hospital-inpatient-deaths-share, us-cdc-wonder-2010-home-deaths-share, us-cdc-wonder-2010-hospital-inpatient-deaths-share, us-cdc-wonder-2011-home-deaths-share, us-cdc-wonder-2011-hospital-inpatient-deaths-share, us-cdc-wonder-2012-home-deaths-share, us-cdc-wonder-2012-hospital-inpatient-deaths-share, us-cdc-wonder-2013-home-deaths-share, us-cdc-wonder-2013-hospital-inpatient-deaths-share, us-cdc-wonder-2014-home-deaths-share, us-cdc-wonder-2014-hospital-inpatient-deaths-share, us-cdc-wonder-2015-home-deaths-share, us-cdc-wonder-2015-hospital-inpatient-deaths-share, us-cdc-wonder-2016-home-deaths-share, us-cdc-wonder-2016-hospital-inpatient-deaths-share, us-cdc-wonder-2017-home-deaths-share, us-cdc-wonder-2017-hospital-inpatient-deaths-share
- [130]Ugeskrift for Laeger (Danish Medical Journal; peer-reviewed; Statens Serum Institut authors). Smith E, Larsen DF, Rosdahl N. [To die alone, a big city problem?] Ugeskr Laeger 2001;163(22):3069-73 (PMID 11449832; article in Danish, English abstract). Published 2001-05-28. Accessed 2026-10-11. (abstract only)Used for: smith-2001-copenhagen-found-dead-cause-unknown
- [131]Forensic Science International (Elsevier; peer-reviewed). Ylijoki-Sørensen S, Sajantila A, Lalu K, Bøggild H, Boldsen JL, Boel LW. Coding ill-defined and unknown cause of death is 13 times more frequent in Denmark than in Finland. Forensic Sci Int 2014;244:289-294 (PMID 25300069). Published 2014-09-28. Accessed 2026-10-11. (abstract only)Used for: ylijoki-sorensen-2014-ill-defined-codes-denmark-vs-finland, ylijoki-sorensen-2014-r-coded-deaths-autopsy-rate
- [132]Journal of the Japan Academy of Health Behavioral Science (日本保健医療行動科学会雑誌; peer-reviewed review). Yamazaki K, Hemmi I. 孤独死研究の動向と今後の課題 (Trends and Future Issues in the Study of Solitary Death). J Jpn Acad Health Behav Sci 2017;32(1):66-73. Published 2017. Accessed 2026-10-11.Used for: yamazaki-2017-japan-kodokushi-definitions-7-of-17-require-delay
- [133]Nihon Koshu Eisei Zasshi / Japanese Journal of Public Health (peer-reviewed). Fukukawa Y, Kawaguchi K. A nationwide survey of Japanese municipalities on solitary deaths and countermeasures. Nihon Koshu Eisei Zasshi 2011;58(11):959-966 (PMID 22352068). Published 2011-11-15. Accessed 2026-10-11.Used for: fukukawa-2011-japan-municipalities-kodokushi-survey-16-8pct
- [134]Global Public Health (Taylor & Francis; peer-reviewed). Cho CM, Moon HJ, Yoo JH. Understanding of solitary death in people living in the community: A scoping review. Glob Public Health 2025;20(1):2597627 (PMID 41355040). Published 2025-12-07. Accessed 2026-10-11. (abstract only)Used for: cho-2025-solitary-death-scoping-review-16-studies
- [135]Journal of Forensic and Legal Medicine (peer-reviewed; Dutch public health services). van den Hondel K et al. Undiscovered solitary deaths in the four largest cities in the Netherlands. J Forensic Leg Med 2020;74:102008 (PMID 33012310). Published 2020-07-05. Accessed 2026-10-11. (abstract only)Used for: nl-four-cities-2020-dsc14-incidence
- [136]Legal Medicine (Tokyo) (Elsevier; peer-reviewed). Fukuda H et al. Postmortem computed tomography-based evaluation of brain decomposition: Correlation with postmortem interval and cause-of-death determinability. Leg Med (Tokyo) 2025;78:102710 (PMID 40957259). Published 2025-09-13. Accessed 2026-10-11. (abstract only)Used for: fukuda-2025-gunma-undetermined-cause-92-9pct-advanced-brain-decomposition
- [137]American Journal of Forensic Medicine and Pathology (peer-reviewed). Maujean G et al. Am J Forensic Med Pathol 2016;37(4):270-274 (PMID 27571173). Published 2016-12. Accessed 2026-10-11. (abstract only)Used for: maujean-2016-lyon-decomposed-cause-determined-80pct, maujean-2016-lyon-decomposed-bodies-350
- [138]Forensic Science, Medicine and Pathology (Springer; peer-reviewed). Byard RW, Farrell E, Simpson E. Diagnostic yield and characteristic features in a series of decomposed bodies subject to coronial autopsy. Forensic Sci Med Pathol 2008;4(1):9-14 (PMID 19291464). Published 2007-08-07. Accessed 2026-10-11. (abstract only)Used for: byard-2008-adelaide-decomposed-bodies-cause-ascertained-89pct
- [139]Journal of Clinical Pathology (BMJ; peer-reviewed letter), author-supplied supplementary table. Estrin-Serlui T, Yoon J, Osborn M. Investigating the relative frequencies of unascertained causes of death and advanced decomposition at autopsy. J Clin Pathol 2024;77(5):304-305 (PMID 38286612), online supplementary table. Published 2024-04-18. Accessed 2026-10-11.Used for: estrin-serlui-2024-unascertained-deaths-mostly-decomposed, estrin-serlui-2024-decomposed-bodies-unascertained-share, estrin-serlui-2024-london-913-autopsies-decomposed
- [140]Tokyo Metropolitan Medical Examiner's Office (東京都監察医務院). 東京都監察医務院 令和7年版統計表及び統計図表 (1)~(10) (3) 区部の死亡者数に対する検案と解剖の割合; (15). Published 2026-03. Accessed 2026-10-11.Used for: jp-tokyo23-me-2024-living-alone-share-of-examinations
- [141]Ministry of Justice. Ministry of Justice. Coroners statistics 2025: England and Wales (accredited official statistics). Published 2026-05-14. Accessed 2026-10-11.Used for: uk-moj-2025-deaths-reported-to-coroners, uk-moj-2025-coroner-post-mortems
- [142]PLOS ONE (Emory University / UCLA / University of Amsterdam authors). Sohn H, Timmermans S, Prickett PJ. Loneliness in life and in death? Social and demographic patterns of unclaimed deaths. PLoS One 2020;15(9):e0238348 (PMC7494098). Published 2020-09-16. Accessed 2026-10-11.Used for: sohn-2020-la-county-unclaimed-2-37pct-of-deaths, sohn-2020-la-county-unclaimed-men-3-14pct, sohn-2020-la-county-unclaimed-peak-3-16pct-2009
- [143]Social Science & Medicine (Elsevier; CUNY Institute for Demographic Research authors). Brite J, Heiland FW, Balk D. Understanding deep disadvantage at the end of life: A nationwide analysis of unclaimed deaths. Soc Sci Med 2025;365:117551 (PMID 39675309; NIH author manuscript PMC11769727). Published 2024-11-25. Accessed 2026-10-11.Used for: brite-2025-us-unclaimed-deaths-1-2pct-of-deaths, brite-2025-bronx-manhattan-unclaimed-over-4pct-2020, brite-2025-us-unclaimed-deaths-42942-rising, brite-2025-us-unclaimed-72pct-male-median-age-65
- [144]ESRC Centre for Population Change (University of Southampton), FOI study of all councils and NHS trusts. Thiehoff S, McGowan T, Falkingham J. Public health funerals in England 2014/15 - 2020/21. ESRC Centre for Population Change report, July 2025. Published 2025-07. Accessed 2026-10-11.Used for: uk-cpc-2025-phf-rate-per-1000-deaths-england, uk-cpc-2025-phf-rate-london, uk-cpc-2025-phf-camden-rate, uk-cpc-2025-phf-male-share, uk-cpc-2025-phf-nhs-trusts-share, uk-cpc-2025-phf-nhs-cost-per-funeral, uk-cpc-2014-15-public-health-funerals-england, uk-cpc-2015-16-public-health-funerals-england, uk-cpc-2016-17-public-health-funerals-england, uk-cpc-2017-18-public-health-funerals-england, uk-cpc-2018-19-public-health-funerals-england, uk-cpc-2019-20-public-health-funerals-england, uk-cpc-2020-21-public-health-funerals-england
- [145]Ministry of Internal Affairs and Communications of Japan, Administrative Evaluation Bureau (総務省行政評価局). 遺留金等に関する実態調査 結果報告書. Published 2023-03-28. Accessed 2026-10-11.Used for: jp-mic-2018-2021-unclaimed-deaths, jp-mic-2021-unclaimed-urns-held-by-municipalities, jp-mic-2021-unclaimed-leftover-money-held
- [146]Ministry of Land, Infrastructure, Transport and Tourism of Japan. 宅地建物取引業者による人の死の告知に関するガイドライン. Published 2021-10-08. Accessed 2026-10-11.Used for: jp-mlit-2021-death-disclosure-guideline
- [147]Money Today (머니투데이), reporting Ministry of Health and Welfare data submitted to Rep. Kwon Chil-seung. '무연고 사망' 4년새 두 배… 4명중 3명은 가족이 있었다. Published 2026-09-16. Accessed 2026-10-11.Used for: kr-mohw-2025-unclaimed-deaths, kr-mohw-2025-unclaimed-deaths-relatives-refused, kr-mohw-2025-unclaimed-deaths-65plus, kr-mohw-2022-unclaimed-deaths, kr-mohw-2023-unclaimed-deaths, kr-mohw-2024-unclaimed-deaths
- [148]Ministry of Health and Welfare, Republic of Korea (보건복지부). 「제3차 장사시설 수급 종합계획(’23~’27)」수립 (press release, PDF attachment). Published 2023-01-05. Accessed 2026-10-11.Used for: kr-mohw-2023-public-funeral-target, kr-mohw-2013-unclaimed-deaths, kr-mohw-2017-unclaimed-deaths
- [149]Scientific Reports (Nature Portfolio; CUNY Institute for Demographic Research authors). Heiland FW, Brite J, Balk D. Deep disadvantage in mortality on the frontlines of the COVID-19 pandemic. Sci Rep 2026;16:16593 (PMC13219519). Published 2026-04-07. Accessed 2026-10-11.Used for: heiland-2026-nyc-hart-island-unclaimed-adult-deaths-2020, heiland-2026-nyc-hart-island-unclaimed-adult-deaths-2019, heiland-2026-nyc-hart-island-unclaimed-adult-deaths-2018, heiland-2026-nyc-unclaimed-deaths-peak-22-to-1-april-2020, heiland-2026-nyc-covid-excess-deaths-10pct-unclaimed, heiland-2026-nyc-hart-island-unclaimed-73-6pct-male
- [150]Demography (Duke University Press; CUNY authors). Heiland FW, Ozdogan S, Balk D, Brite J, Marcotullio P. Extreme Weather and Mortality of Vulnerable Urban Populations: An Examination of Temperature and Unclaimed Deaths in New York City. Demography 2026;63(3):893-923 (PMID 42306993). Published 2026-06-01. Accessed 2026-10-11. (abstract only)Used for: heiland-2026-nyc-extreme-heat-days-unclaimed-3x
- [151]New York City Council (Data Team). Hart Island (NYC Council Data Team page). Published 2025. Accessed 2026-10-11.Used for: us-nyc-council-hart-island-1213-buried-2018, us-nyc-council-hart-island-62pct-kin-chose-public-burial, us-nyc-council-hart-island-average-age-65-2016
- [152]NYC Human Resources Administration (data reported by THE CITY). THE CITY: "NYC Is Burying More Bodies in Each Hart Island Mass Grave" (4 Sep 2024), citing HRA data. Published 2024-09-04. Accessed 2026-10-11.Used for: us-nyc-hra-2023-hart-island-burials, us-nyc-hra-2020-hart-island-burials, us-nyc-hra-2019-hart-island-burials
- [153]County of Los Angeles (Board of Supervisors / Department of Health Services, Office of Decedent Affairs). County of Los Angeles news release, Ceremony of the Unclaimed Dead (2025-12-11). Published 2025-12-11. Accessed 2026-10-11.Used for: us-lacounty-2025-unclaimed-dead-laid-to-rest
- [154]County of Los Angeles (Board of Supervisors / Department of Health Services, Office of Decedent Affairs). County of Los Angeles news release, Ceremony of the Unclaimed Dead (2024-12-12). Published 2024-12-12. Accessed 2026-10-11.Used for: us-lacounty-2024-unclaimed-dead-laid-to-rest
- [155]County of Los Angeles (Board of Supervisors / Department of Health Services, Office of Decedent Affairs). County of Los Angeles news release, Ceremony of the Unclaimed Dead (2023-12-14). Published 2023-12-14. Accessed 2026-10-11.Used for: us-lacounty-2023-unclaimed-dead-laid-to-rest
- [156]County of Los Angeles (Board of Supervisors / Department of Health Services, Office of Decedent Affairs). County of Los Angeles news release, Ceremony of the Unclaimed Dead (2022-12-08). Published 2022-12-08. Accessed 2026-10-11.Used for: us-lacounty-2022-unclaimed-dead-laid-to-rest
- [157]Office of the Chief Coroner for Ontario (figures reported by CBC News). CBC News: "Dead bodies are going unclaimed in Ontario, and the numbers are climbing" (8 Mar 2024). Published 2024-03-08. Accessed 2026-10-11.Used for: ca-on-occ-2023-unclaimed-no-next-of-kin-found-37pct, ca-on-occ-2019-unclaimed-bodies, ca-on-occ-2022-unclaimed-bodies, ca-on-occ-2023-unclaimed-bodies
- [158]Revue du CREMIS (CIUSSS du Centre-Sud-de-l'Île-de-Montréal research centre), analysing Bureau du coroner du Québec data. Namian D, Perreault I. Mourir dans l'ombre : le sort des corps non réclamés au Québec. Revue du CREMIS 2025;16(1):30-38. Published 2025. Accessed 2026-10-11.Used for: ca-qc-coroner-2023-unclaimed-bodies-150
- [159]Office of the Chief Coroner for Ontario (figures reported by CBC News). CBC News: "Ontario's 'troubling' surge in unclaimed bodies is not letting up" (3 Feb 2026). Published 2026-02-03. Accessed 2026-10-11.Used for: ca-on-occ-2020-unclaimed-bodies, ca-on-occ-2025-unclaimed-bodies-1710
- [160]Cook County Medical Examiner's Office. Cook County Medical Examiner's Office Annual Report 2018. Published 2019. Accessed 2026-10-11.Used for: us-cook-county-me-2018-unclaimed-bodies
- [161]Cook County Medical Examiner's Office. Cook County Medical Examiner's Office Annual Report 2019. Published 2020. Accessed 2026-10-11.Used for: us-cook-county-me-2019-unclaimed-bodies
- [162]Cook County Medical Examiner's Office. Cook County Medical Examiner's Office Annual Report 2020. Published 2022-04. Accessed 2026-10-11.Used for: us-cook-county-me-2020-unclaimed-bodies
- [163]Cook County Medical Examiner's Office. Cook County Medical Examiner's Office Annual Report 2021. Published 2023-07. Accessed 2026-10-11.Used for: us-cook-county-me-2021-unclaimed-bodies
- [164]Cook County Medical Examiner's Office. Cook County Medical Examiner's Office Annual Report 2022. Published 2024-01. Accessed 2026-10-11.Used for: us-cook-county-me-2022-unclaimed-bodies
- [165]Cook County Medical Examiner's Office. Cook County Medical Examiner's Office Annual Report 2023. Published 2025-02. Accessed 2026-10-11.Used for: us-cook-county-me-2023-unclaimed-bodies
- [166]Cook County Medical Examiner's Office. Cook County Medical Examiner's Office Annual Report 2024. Published 2026-01. Accessed 2026-10-11.Used for: us-cook-county-me-2024-unclaimed-bodies
- [167]City and County of San Francisco, Office of the Chief Medical Examiner. Office of the Chief Medical Examiner Annual Report for Calendar Years 2020, 2021, 2022, and 2023. Published 2025. Accessed 2026-10-11.Used for: us-sf-ocme-2020-unclaimed-decedents, us-sf-ocme-2021-unclaimed-decedents, us-sf-ocme-2022-unclaimed-decedents, us-sf-ocme-2023-unclaimed-decedents
- [168]Local Government Association. Local Government Association. Research: Public health funerals. A survey of authorities in England and Wales, 2010. Published 2010. Accessed 2026-10-11.Used for: uk-lga-2009-10-public-health-funerals-ew, uk-lga-2009-10-phf-men-to-women-ratio, uk-lga-2009-10-phf-average-cost
- [169]Senatsverwaltung fuer Wissenschaft, Gesundheit, Pflege und Gleichstellung Berlin (answer to written question, Abgeordnetenhaus). Abgeordnetenhaus Berlin, Drucksache 19/11706: Schriftliche Anfrage 'Armutsbegraebnisse in 2020 und 2021 in Lichtenberg und im Bezirksvergleich' and answer of 6 May 2022. Published 2022-05-06. Accessed 2026-10-11.Used for: de-berlin-ordnungsbehoerdliche-bestattungen-2021, de-berlin-ordnungsbehoerdliche-bestattungen-2020, de-berlin-2021-municipal-burials-cost
- [170]Bezirksamt Marzahn-Hellersdorf von Berlin (press release). Zentrale Trauerfeier gedenkt einsam Verstorbener in Marzahn-Hellersdorf, Pressemitteilung vom 06.11.2025. Published 2025-11-06. Accessed 2026-10-11.Used for: de-berlin-2025-about-2700-municipal-burials-a-year
- [171]Hamburgische Buergerschaft (Hamburg State Parliament), news release. Einweihung neuer Anlage auf dem Friedhof Oejendorf (20 November 2024). Published 2024-11-20. Accessed 2026-10-11.Used for: de-hamburg-2024-about-1700-burials-without-relatives
- [172]Hamburger Friedhoefe AoeR (figures), reported by trauer-now.de (online magazine of the trade initiative 'Raum fuer Trauer'). Wenn das Amt bestatten laesst, trauer-now.de, 11 October 2023. Published 2023-10-11. Accessed 2026-10-11.Used for: de-hamburg-burials-by-authorities-2022, de-hamburg-burials-by-authorities-2021
- [173]Senat der Freien und Hansestadt Hamburg (answer to written question, Buergerschaft). Buergerschaft Hamburg, Drucksache 21/14371, Schriftliche Kleine Anfrage 'Sozialbestattung in Hamburg' and Senate answer, 21.09.18. Published 2018-09-21. Accessed 2026-10-11.Used for: de-hamburg-2015-2017-burials-by-authorities
- [174]Senat der Freien und Hansestadt Hamburg (answer to written question, Buergerschaft). Buergerschaft Hamburg, Drucksache 21/4906, Schriftliche Kleine Anfrage 'Randthema: Sozialbestattungen in Hamburg?' and Senate answer, 24.06.16. Published 2016-06-24. Accessed 2026-10-11.Used for: de-hamburg-2015-burial-by-authorities-average-cost
- [175]Collectif Les Morts de la Rue (NGO; convention with the City of Paris). Rapport d'activité 2024. Published 2025-12. Accessed 2026-10-11.Used for: fr-paris-2024-morts-isoles-buried-thiais, fr-paris-2024-morts-isoles-male-share, fr-paris-2024-morts-isoles-homeless-share
- [176]Ministerstwo Rodziny, Pracy i Polityki Spolecznej (Ministry of Family, Labour and Social Policy), annual social-assistance report. Sprawozdanie MRiPS-03 za 2024 rok (Dzial 1B - Polska ogolem). Published 2025-06-27. Accessed 2026-10-11.Used for: pl-mrips-social-assistance-funerals-2024
- [177]Ministerstwo Rodziny, Pracy i Polityki Spolecznej (Ministry of Family, Labour and Social Policy), annual social-assistance report. Sprawozdanie MPiPS-03 za styczen-grudzien 2015 r. (Dzial 2B - Polska ogolem). Published 2016-08-26. Accessed 2026-10-11.Used for: pl-mrips-social-assistance-funerals-2015
- [178]City of Vienna health service (MA 15), reported by ORF Wien. Immer mehr 'Einsame Begraebnisse', wien.ORF.at, 1 November 2016. Published 2016-11-01. Accessed 2026-10-11.Used for: at-vienna-burials-by-authorities-2015, at-vienna-burials-by-authorities-2010, at-vienna-burials-by-authorities-2005
- [179]Cemeteries & Crematoria NSW (CCNSW, NSW Government). NSW Annual Cemetery and Crematoria Operator Activity Report 2022/23. Published 2024-05. Accessed 2026-10-11.Used for: au-ccnsw-2022-23-destitute-burials-and-cremations
- [180]Cemeteries & Crematoria NSW (CCNSW, NSW Government). NSW Annual Operator Activity Survey 2020/21 (CCNSW Activity Report 2020-21). Published 2023-01. Accessed 2026-10-11.Used for: au-ccnsw-2020-21-destitute-burials-and-cremations
- [181]Comune di Milano (Assessorato ai Servizi civici), via Il Giorno. Il Giorno: Morti solitari e in povertà. Il Comune nel 2023 ha pagato 163 funerali per 'disinteresse' delle famiglie (8 Jan 2024). Published 2024-01-08. Accessed 2026-10-11.Used for: it-milan-2020-council-funerals-no-family, it-milan-2021-council-funerals-no-family, it-milan-2022-council-funerals-no-family, it-milan-2023-council-funerals-no-family
- [182]Centers for Disease Control and Prevention (MMWR QuickStats, National Center for Health Statistics). QuickStats: Percentage of Deaths, by Place of Death - National Vital Statistics System, United States, 2000-2018. MMWR 2020;69(19):611. Published 2020-05-15. Accessed 2026-10-11.Used for: us-nchs-mmwr-2020-home-deaths-22-7-to-31-4pct
- [183]Public Health Reports (SAGE; authors from CDC National Center for HIV, Viral Hepatitis, STD, and TB Prevention). Adekoya N, Chang MH. Changes in Place of Death Among US Residents for HIV-Related and All-Cause Mortality, 2018-2022. Public Health Rep 2026 (PMID 42541714). Published 2026-08-01. Accessed 2026-10-11. (abstract only)Used for: adekoya-2026-us-home-deaths-33pct-2018-2022
- [184]Office for National Statistics. Deaths registered in England and Wales: 2025 (annual reference tables), Table 5: deaths by place of occurrence, ICD-10 chapter, sex and age group, 2016 to 2025. Published 2026-09-25. Accessed 2026-10-11.Used for: uk-ons-2025-deaths-in-private-homes-ew, uk-ons-2025-65plus-deaths-in-private-homes-ew, uk-ons-2016-65plus-deaths-in-private-homes-ew, uk-ons-2025-home-deaths-share-by-sex-ew, uk-ons-2016-deaths-in-private-homes-ew, uk-ons-2017-deaths-in-private-homes-ew, uk-ons-2018-deaths-in-private-homes-ew, uk-ons-2019-deaths-in-private-homes-ew, uk-ons-2020-deaths-in-private-homes-ew, uk-ons-2021-deaths-in-private-homes-ew, uk-ons-2022-deaths-in-private-homes-ew, uk-ons-2023-deaths-in-private-homes-ew, uk-ons-2024-deaths-in-private-homes-ew
- [185]National Records of Scotland. Vital events reference tables 2024, chapter 5, Table 5.09: Deaths by location of death, 2000 to 2024. Published 2025-08-26. Accessed 2026-10-11.Used for: uk-nrs-2024-home-deaths-scotland, uk-nrs-2019-home-deaths-scotland, uk-nrs-2000-home-deaths-scotland
- [186]Northern Ireland Statistics and Research Agency (Registrar General Annual Report 2024). Registrar General Annual Report 2024, Section 5 Death Tables, Table 5.11: Deaths by place of death, 2014 to 2024. Published 2025-11. Accessed 2026-10-11.Used for: uk-nisra-2024-home-deaths-northern-ireland, uk-nisra-2019-home-deaths-northern-ireland, uk-nisra-2014-home-deaths-northern-ireland
- [187]INSEE. Les décès en 2024 et en séries longues, table T75bis. Published 2025-10-15. Accessed 2026-10-11.Used for: fr-insee-2024-deaths-at-home-count, fr-insee-1975-metro-deaths-at-home-share, fr-insee-1980-metro-deaths-at-home-share, fr-insee-1985-metro-deaths-at-home-share, fr-insee-1990-metro-deaths-at-home-share, fr-insee-1995-metro-deaths-at-home-share, fr-insee-2000-metro-deaths-at-home-share, fr-insee-2005-metro-deaths-at-home-share, fr-insee-2010-metro-deaths-at-home-share, fr-insee-2015-metro-deaths-at-home-share, fr-insee-2019-metro-deaths-at-home-share, fr-insee-2024-metro-deaths-at-home-share
- [188]INSEE. Les décès en 2024 et en séries longues, table T75 'Décès selon le lieu de décès et le groupe d'âges atteints dans l'année - Année 2024'. Published 2025-10-15. Accessed 2026-10-11.Used for: fr-insee-2024-65plus-deaths-at-home
- [189]Statistics Netherlands (CBS). Sterfte in Nederland in 2024, chapter 3 Resultaten, table 3.8 Plaats van overlijden, 2024*. Published 2026-02-13. Accessed 2026-10-11.Used for: nl-cbs-2024-deaths-at-home-share, nl-cbs-2024-80plus-deaths-at-home-share
- [190]Statistics Netherlands (CBS). Sterfte naar locatie van overlijden (maatwerk 2020/37), Tabel 1: Plaats van overlijden en provincie van inschrijving voor totaal sterfte, 2019 (sterfteplaatsovl2019_provincie.xlsx). Published 2020-09-11. Accessed 2026-10-11.Used for: nl-cbs-2019-deaths-at-home
- [191]Mutualité chrétienne (Belgian health insurance fund). Santé & Société 17 (April 2026): Soins en fin de vie, lieu de décès et trajets de soins. Published 2026-04. Accessed 2026-10-11.Used for: be-mc-2024-living-alone-home-death-share, be-mc-2024-deaths-at-home-share
- [192]Statistik Austria. Gestorbene nach demographischen Merkmalen, Tabelle 10: Gestorbene nach Sterbeort und Bundesland seit 2006. Published 2026-05-22. Accessed 2026-10-11.Used for: at-statistik-austria-2025-home-deaths-vienna-vs-burgenland, at-statistik-austria-home-deaths-2006, at-statistik-austria-home-deaths-2007, at-statistik-austria-home-deaths-2008, at-statistik-austria-home-deaths-2009, at-statistik-austria-home-deaths-2010, at-statistik-austria-home-deaths-2011, at-statistik-austria-home-deaths-2012, at-statistik-austria-home-deaths-2013, at-statistik-austria-home-deaths-2014, at-statistik-austria-home-deaths-2015, at-statistik-austria-home-deaths-2016, at-statistik-austria-home-deaths-2017, at-statistik-austria-home-deaths-2018, at-statistik-austria-home-deaths-2019, at-statistik-austria-home-deaths-2020, at-statistik-austria-home-deaths-2021, at-statistik-austria-home-deaths-2022, at-statistik-austria-home-deaths-2023, at-statistik-austria-home-deaths-2024, at-statistik-austria-home-deaths-2025
- [193]Institut fuer Hoehere Studien (IHS), Vienna (research report, own calculation from Statistik Austria data). Lang A. Sterben in Oesterreich: Rahmenbedingungen und Stand der Forschung (Projekt Sterbewelten in Oesterreich), IHS Wien, 2018. Published 2018. Accessed 2026-10-11.Used for: at-ihs-2018-home-deaths-men-vs-women-2016
- [194]Swiss Federal Council / Federal Office of Public Health (BAG). Bessere Betreuung und Behandlung von Menschen am Lebensende. Bericht des Bundesrates in Erfuellung des Postulates 18.3384 (SGK-SR), Bern, 18 September 2020. Published 2020-09-18. Accessed 2026-10-11.Used for: ch-bundesrat-2020-one-in-five-die-at-home-or-elsewhere, ch-bundesrat-2020-home-deaths-younger
- [195]Schweizerisches Gesundheitsobservatorium (Obsan). Obsan Bulletin 2/2019: Aufenthaltsorte von aelteren Menschen im letzten Lebensabschnitt. Published 2019. Accessed 2026-10-11.Used for: ch-obsan-2019-65plus-deaths-at-home-or-elsewhere-2016
- [196]Deutsches Aerzteblatt International (peer-reviewed). Dasch B, Zahn PK. Place of death trends and utilization of outpatient palliative care at the end of life: analysis of death certificates (2001, 2011, 2017) in Westphalia, Germany. Dtsch Arztebl Int 2021;118:331-338 (PMID 34180794). Published 2021-05-17. Accessed 2026-10-11.Used for: dasch-2021-westphalia-home-death-share-2017, dasch-2021-westphalia-home-death-share-2011, dasch-2021-westphalia-home-death-share-2001
- [197]Das Gesundheitswesen (Thieme; peer-reviewed). Dasch B. [The trend in places of death over two decades in the city of Muenster: an observational study based on evaluated death certificates]. Gesundheitswesen 2024;86(4):322-329 (PMID 37816382). Published 2023-10-10. Accessed 2026-10-11.Used for: dasch-2024-muenster-home-deaths-2021
- [198]REHPA, Danish Knowledge Centre for Rehabilitation and Palliative Care (Region of Southern Denmark / University of Southern Denmark). Jarlbæk L, Mikkelsen TB, Hansen RS, Vind AB. Dødssted og dødsårsager blandt voksne i Danmark i perioden 2012-2020. REHPA report, 2nd ed., October 2024. Published 2024-10. Accessed 2026-10-11.Used for: dk-rehpa-2012-2020-natural-deaths-at-home-half
- [199]Central Statistics Office (CSO), Ireland. CSO PxStat table VSD36: Deaths by age group and place of occurrence, 2013-2023. Published 2025-11-03. Accessed 2026-10-11.Used for: ie-cso-2023-65plus-domiciliary-deaths-share, ie-cso-2013-domiciliary-deaths
- [200]Ministry of Health, Labour and Welfare of Japan (人口動態統計). 人口動態統計(確定数)令和7年 上巻 死亡 第5.6表 死亡の場所別にみた年次別死亡数百分率. Published 2026-09-30. Accessed 2026-10-11.Used for: jp-mhlw-2025-deaths-at-home-share, jp-mhlw-1951-deaths-at-home-share, jp-mhlw-2000-deaths-at-home-share, jp-mhlw-2005-deaths-at-home-share, jp-mhlw-2010-deaths-at-home-share, jp-mhlw-2015-deaths-at-home-share, jp-mhlw-2019-deaths-at-home-share, jp-mhlw-2020-deaths-at-home-share, jp-mhlw-2021-deaths-at-home-share, jp-mhlw-2022-deaths-at-home-share, jp-mhlw-2023-deaths-at-home-share, jp-mhlw-2024-deaths-at-home-share
- [201]Statistics Korea (통계청; now Ministry of Data and Statistics). 2024년 출생·사망통계(잠정) 브리핑 (2024 Birth and Death Statistics, provisional: briefing transcript). Published 2025-02-26. Accessed 2026-10-11.Used for: kr-kostat-2024-home-death-share-15-2pct
- [202]Australian Institute of Health and Welfare (AIHW). Interfaces between the aged care and health systems in Australia - where do older Australians die? (Cat. no. AGE 106, June 2021). Published 2021-06. Accessed 2026-10-11.Used for: au-aihw-2021-older-people-died-outside-hospital-or-aged-care-14pct
- [203]EClinicalMedicine (The Lancet Discovery Science; peer-reviewed, open access), EOLinPLACE project. Lopes S, Bruno de Sousa A, Delalibera M, Namukwaya E, Cohen J, Gomes B. The rise of home death in the COVID-19 pandemic: a population-based study of death certificate data for adults from 32 countries, 2012-2021. EClinicalMedicine 2024;68:102399 (PMID 38545089). Published 2024-01-02. Accessed 2026-10-11.Used for: lopes-2024-home-death-share-32-countries-overall, lopes-2024-home-death-share-rise-pandemic, lopes-2024-home-death-rise-northern-ireland-largest, lopes-2024-home-death-men-vs-women, lopes-2024-home-death-share-bg-2012-2021, lopes-2024-home-death-share-ro-2012-2021, lopes-2024-mexico-home-deaths-share-2012-2021, lopes-2024-home-death-share-si-2012-2021, lopes-2024-home-death-share-gr-2012-2021, lopes-2024-home-death-share-lv-2012-2021, lopes-2024-home-death-share-it-2012-2021, lopes-2024-home-death-share-pl-2012-2021, lopes-2024-home-death-share-lt-2012-2021, lopes-2024-home-death-share-nl-2012-2021, lopes-2024-home-death-share-hr-2012-2021, lopes-2024-usa-home-deaths-share-2012-2021, lopes-2024-home-death-share-ee-2012-2021, lopes-2024-home-death-share-sk-2012-2021, lopes-2024-home-death-share-uk-ni-2012-2021, lopes-2024-home-death-share-uk-sco-2012-2021, lopes-2024-home-death-share-at-2012-2021, lopes-2024-home-death-share-es-2012-2021, lopes-2024-home-death-share-pt-2012-2021, lopes-2024-home-death-share-uk-ew-2012-2021, lopes-2024-home-death-share-dk-2012-2021, lopes-2024-home-death-share-be-2012-2021, lopes-2024-home-death-share-cz-2012-2021, lopes-2024-home-death-share-fr-2012-2021, lopes-2024-brazil-home-deaths-share-2012-2021, lopes-2024-home-death-share-cy-2012-2021, lopes-2024-home-death-share-se-2012-2021, lopes-2024-home-death-share-lu-2012-2021, lopes-2024-home-death-share-fi-2012-2021, lopes-2024-home-death-share-mt-2012-2021
- [204]Journal of Epidemiology and Community Health (BMJ). Place of death in the population dying from diseases indicative of palliative care need: a cross-national population-level study in 14 countries. Published 2015-07-22. Accessed 2026-10-11. (abstract only)Used for: pivodic-2016-home-deaths-13-53pct-across-14-countries
- [205]International Journal of Public Health (Springer). Where do people die? An international comparison of the percentage of deaths occurring in hospital and residential aged care settings in 45 populations, using published and available statistics. Published 2012-08-15. Accessed 2026-10-11. (abstract only)Used for: broad-2013-hospital-deaths-median-54pct-45-populations
- [206]OECD. Time for Better Care at the End of Life (OECD Health Policy Studies, 2023). Published 2023-02. Accessed 2026-10-11.Used for: oecd-2023-netherlands-home-deaths-36pct-2017, oecd-2023-chile-home-deaths-47pct-2017, oecd-2023-up-to-84pct-prefer-home-half-die-in-hospital
- [207]Office for National Statistics. Deaths registered in private homes, England and Wales: 2020 final and January to June 2021 provisional (Figure 1 data). Published 2021-11-10. Accessed 2026-10-11.Used for: uk-ons-2001-deaths-in-private-homes-ew, uk-ons-2002-deaths-in-private-homes-ew, uk-ons-2003-deaths-in-private-homes-ew, uk-ons-2004-deaths-in-private-homes-ew, uk-ons-2005-deaths-in-private-homes-ew, uk-ons-2006-deaths-in-private-homes-ew, uk-ons-2007-deaths-in-private-homes-ew, uk-ons-2008-deaths-in-private-homes-ew, uk-ons-2009-deaths-in-private-homes-ew, uk-ons-2010-deaths-in-private-homes-ew, uk-ons-2011-deaths-in-private-homes-ew, uk-ons-2012-deaths-in-private-homes-ew, uk-ons-2013-deaths-in-private-homes-ew, uk-ons-2014-deaths-in-private-homes-ew, uk-ons-2015-deaths-in-private-homes-ew
- [208]Glowny Urzad Statystyczny (GUS, Statistics Poland). Rocznik Demograficzny 2025 (Demographic Yearbook of Poland 2025), Tabl. 101 (125): Zgony wedlug miejsca zgonu / Deaths by place of death. Published 2025-11-24. Accessed 2026-10-11.Used for: pl-gus-home-deaths-1980, pl-gus-home-deaths-1990, pl-gus-home-deaths-2000, pl-gus-home-deaths-2010, pl-gus-home-deaths-2020, pl-gus-home-deaths-2024
- [209]Glowny Urzad Statystyczny (GUS, Statistics Poland). Sytuacja demograficzna Polski do 2020 r. Zgony i umieralnosc (GUS, 2021), Tablica 23: Zgony wedlug miejsca zgonu. Published 2021. Accessed 2026-10-11.Used for: pl-gus-home-deaths-2005, pl-gus-home-deaths-2015
- [210]Norwegian Institute of Public Health (FHI), Cause of Death Registry (Dødsårsaksregisteret). Dødsårsaksregisteret statistikkbank, table D3a_dødssted_fylke (deaths by place of death and county of residence, 1986-2025). Published 2026-04-27. Accessed 2026-10-11.Used for: no-fhi-1986-deaths-in-private-home, no-fhi-2019-deaths-in-private-home, no-fhi-2020-deaths-in-private-home, no-fhi-2021-deaths-in-private-home, no-fhi-2022-deaths-in-private-home, no-fhi-2023-deaths-in-private-home, no-fhi-2024-deaths-in-private-home, no-fhi-2025-deaths-in-private-home
- [211]Central Statistics Office (CSO), Ireland. Vital Statistics Annual Report 2019: Deaths 2019. Published 2021-11-12. Accessed 2026-10-11.Used for: ie-cso-2019-domiciliary-deaths
- [212]Central Statistics Office (CSO), Ireland. Vital Statistics Annual Report 2020: Deaths 2020. Published 2022-10-28. Accessed 2026-10-11.Used for: ie-cso-2020-domiciliary-deaths
- [213]Central Statistics Office (CSO), Ireland. Vital Statistics Annual Report 2021: Deaths 2021. Published 2023-10-31. Accessed 2026-10-11.Used for: ie-cso-2021-domiciliary-deaths
- [214]Central Statistics Office (CSO), Ireland. Vital Statistics Annual Report 2022: Deaths 2022. Published 2024-10-31. Accessed 2026-10-11.Used for: ie-cso-2022-domiciliary-deaths
- [215]Central Statistics Office (CSO), Ireland. Vital Statistics Annual Report 2023: Key Findings. Published 2025-11-03. Accessed 2026-10-11.Used for: ie-cso-2023-domiciliary-deaths
- [216]Statistics Canada. Table 13-10-0715-01 Deaths, by place of death (hospital or non-hospital). Published 2026-01-13. Accessed 2026-10-11.Used for: ca-statcan-1991-deaths-outside-hospital-share, ca-statcan-2000-deaths-outside-hospital-share, ca-statcan-2010-deaths-outside-hospital-share, ca-statcan-2015-deaths-outside-hospital-share, ca-statcan-2019-deaths-outside-hospital-share, ca-statcan-2020-deaths-outside-hospital-share, ca-statcan-2021-deaths-outside-hospital-share, ca-statcan-2022-deaths-outside-hospital-share, ca-statcan-2023-deaths-outside-hospital-share, ca-statcan-2024-deaths-outside-hospital-share
- [217]Kaiser Family Foundation (with The Economist). Views and Experiences with End-of-Life Medical Care in the U.S. (April 2017). Published 2017-04-27. Accessed 2026-10-11.Used for: kff-2017-us-adults-prefer-to-die-at-home-71pct
- [218]Kaiser Family Foundation and The Economist (fieldwork by SSRS). Kaiser Family Foundation/The Economist Four-Country Survey on Aging and End-of-Life Medical Care: topline. Published 2017-04-27. Accessed 2026-10-11.Used for: kff-2017-us-adults-expect-to-die-at-home-41pct, kff-2017-japan-adults-expect-to-die-at-home-21pct, kff-2017-japan-adults-prefer-to-die-at-home-55pct, kff-2017-italy-adults-prefer-to-die-at-home-61pct, kff-2017-italy-adults-expect-to-die-at-home-33pct, kff-2017-brazil-adults-prefer-to-die-at-home-64pct, kff-2017-brazil-adults-expect-to-die-at-home-35pct, kff-2017-us-loved-ones-around-at-death-important-81pct
- [219]BMC Palliative Care (Springer Nature). Heterogeneity and changes in preferences for dying at home: a systematic review. Published 2013-02-15. Accessed 2026-10-11.Used for: gomes-2013-most-prefer-home-death-75pct-of-studies, gomes-2013-public-home-death-preference-49-70pct
- [220]Annals of Oncology (ESMO / Elsevier). Preferences for place of death if faced with advanced cancer: a population survey in England, Flanders, Germany, Italy, the Netherlands, Portugal and Spain. Published 2012-02-16. Accessed 2026-10-11. (abstract only)Used for: gomes-2012-prefer-home-death-51-84pct-seven-countries
- [221]Journal of Pain and Symptom Management (Elsevier). Patient and Family Preferences About Place of End-of-Life Care and Death: An Umbrella Review. Published 2024-01-17. Accessed 2026-10-11. (abstract only)Used for: pinto-2024-home-most-preferred-place-of-death-51-55pct
- [222]Cabinet Office, Government of Japan (内閣府 政策統括官(共生・共助担当)). 令和5年度 高齢者の住宅と生活環境に関する調査結果 図表2-2-12-2 最期はどこで迎えたいか(問12)(CSV). Published 2024. Accessed 2026-10-11.Used for: jp-cao-2023-65plus-living-alone-prefer-to-die-at-home-31-3pct
- [223]Cabinet Office, Government of Japan (内閣府 政策統括官(共生・共助担当)). 令和5年度 高齢社会対策総合調査(高齢者の住宅と生活環境に関する調査)結果(全体版)第2章 2.基本的な生活の状況. Published 2024. Accessed 2026-10-11.Used for: jp-cao-2023-65plus-prefer-to-die-at-home-45-8pct
- [224]Palliative Medicine Reports (Mary Ann Liebert). Older Danes' Preferences for Their Final Days: A Survey of 1499 Participants. Published 2025-09-09. Accessed 2026-10-11.Used for: krarup-2025-older-danes-prefer-to-die-at-home-61pct, krarup-2025-older-danes-worried-about-dying-alone-69pct
- [225]Marie Curie (with Cardiff University Marie Curie Research Centre; fieldwork by Opinium). Public attitudes to death and dying in the UK (2024). Published 2024. Accessed 2026-10-11.Used for: uk-mariecurie-2021-being-at-home-final-year-priority-30pct
- [226]Cabinet Office of Japan. 令和5年度 高齢社会対策総合調査(高齢者の住宅と生活環境に関する調査)結果 クロス集計表 問13. Published 2024-04. Accessed 2026-10-11.Used for: jp-cao-2023-65plus-living-alone-isolated-death-feels-close, jp-cao-2023-never-married-65plus-isolated-death-feels-close
- [227]Cabinet Office of Japan. 令和6年版高齢社会白書 第1章第2節4 図1-2-4-18 65歳以上の者の孤立死に対する意識. Published 2024-06. Accessed 2026-10-11.Used for: jp-cao-2023-65plus-isolated-death-feels-close, jp-tokyo23-me-2012-65plus-living-alone-home-deaths
- [228]Cabinet Office of Japan. 令和元年版高齢社会白書 第1章第2節4 図1-2-4-13 孤立死を身近な問題と感じるものの割合 (高齢者の住宅と生活環境に関する調査 平成30年). Published 2019-06. Accessed 2026-10-11.Used for: jp-cao-2018-60plus-living-alone-isolated-death-feels-close
- [229]Cabinet Office, Government of Japan (Annual Report on the Ageing Society 2022). 令和4年版高齢社会白書(全体版)第1章 第2節 3 生活環境. Published 2022-06. Accessed 2026-10-11.Used for: jp-cao-2018-60plus-isolated-death-feels-close-34-1pct
- [230]Cabinet Office of Japan. 平成30年版高齢社会白書 第1章第2節4 図1-2-4-15 孤独死を身近な問題と感じるものの割合 (高齢者の健康に関する意識調査 平成24年). Published 2018-06. Accessed 2026-10-11.Used for: jp-cao-2012-60plus-living-alone-kodokushi-feels-close, jp-tokyo23-me-2003-65plus-living-alone-home-deaths, jp-tokyo23-me-2004-65plus-living-alone-home-deaths, jp-tokyo23-me-2005-65plus-living-alone-home-deaths, jp-tokyo23-me-2006-65plus-living-alone-home-deaths, jp-tokyo23-me-2007-65plus-living-alone-home-deaths, jp-tokyo23-me-2008-65plus-living-alone-home-deaths, jp-tokyo23-me-2009-65plus-living-alone-home-deaths, jp-tokyo23-me-2010-65plus-living-alone-home-deaths, jp-tokyo23-me-2011-65plus-living-alone-home-deaths
- [231]Seoul Metropolitan Government / Seoul Welfare Foundation (서울시복지재단). 2024년 서울시 노인실태조사 (2024 Seoul Senior Citizen Survey; 서울시복지재단-2024-26). Published 2024-12-31. Accessed 2026-10-11.Used for: kr-seoul-2024-65plus-living-alone-perceived-lonely-death-risk-64-5pct, kr-seoul-2024-65plus-perceived-lonely-death-risk-23-9pct, kr-seoul-2024-65plus-prepared-for-lonely-death-3-7pct
- [232]AARP Research (survey by NORC at the University of Chicago). Solo Agers Are Optimistic About Quality of Life (AARP Research, February 1, 2021). Published 2021-02-01. Accessed 2026-10-11.Used for: us-aarp-2021-solo-agers-fear-dying-alone
- [233]Dignity in Dying (campaign group; survey by YouGov). Survey finds that being alone is Britain's biggest fear about death (press release for the report 'Dying Alone'). Published 2008-04-22. Accessed 2026-10-11.Used for: uk-yougov-2008-greatest-fear-about-dying-being-alone-32pct
- [234]Ministry of Data and Statistics, Republic of Korea (국가데이터처; formerly Statistics Korea). 2025 통계로 보는 1인가구 (One-person households in statistics, 2025). Published 2025-12-09. Accessed 2026-10-11.Used for: kr-mods-2025-living-alone-no-one-to-help-when-sick-31-1pct, kr-mods-2025-living-alone-often-lonely-48-9pct
- [235]Ministry of Health and Welfare, Republic of Korea (보건복지부). 제1차 고독사 예방 기본계획('23∼'27) (First Basic Plan for Lonely Death Prevention 2023-2027). Published 2023-05-18. Accessed 2026-10-11.Used for: kr-mohw-2023-lonely-death-risk-70plus-living-alone-16-2pct
- [236]Seoul Shinmun (서울신문), reporting Ministry of Health and Welfare data submitted to Rep. Seo Mi-hwa. 고독사 위험자 17만 명 첫 집계…수도권·대도시 집중. Published 2025-09-16. Accessed 2026-10-11.Used for: kr-mohw-2024-identified-at-risk-people
- [237]Petits Frères des Pauvres (NGO), survey by CSA Research. Baromètre Solitude et isolement quand on a plus de 60 ans en France en 2025 (Rapport #10, Sept 2025). Published 2025-09. Accessed 2026-10-11.Used for: fr-pfp-2025-social-death-750000, fr-pfp-2021-60plus-social-death-530k, fr-pfp-2017-60plus-social-death-300k, fr-pfp-2025-60plus-lonely-every-day-2-5-million
- [238]Petits Frères des Pauvres (NGO), via franceinfo (Radio France) and AFP. franceinfo: 'Des milliers de cas chaque année ?' Les Petits Frères des Pauvres lancent un observatoire (27 Jan 2026). Published 2026-01-27. Accessed 2026-10-11.Used for: fr-pfp-2025-media-census-lonely-deaths
- [239]Petits Frères des Pauvres (NGO). Communiqué de presse : De la mort sociale à la mort solitaire, bilan 2024 (21 Jan 2025). Published 2025-01-21. Accessed 2026-10-11.Used for: fr-pfp-2024-media-census-lonely-deaths
- [240]Petits Frères des Pauvres (NGO). Morts solitaires : comment en arrive-t-on là ? (27 Jan 2026). Published 2026-01-27. Accessed 2026-10-11.Used for: fr-pfp-2023-media-census-lonely-deaths, fr-pfp-2022-media-census-lonely-deaths
- [241]World Health Organization (WHO Commission on Social Connection). From loneliness to social connection: charting a path to healthier societies. Report of the WHO Commission on Social Connection (ISBN 978-92-4-011236-0). Published 2025-06-30. Accessed 2026-10-11.Used for: who-commission-2025-loneliness-deaths-871000-a-year, who-commission-2025-loneliness-60plus-11-8pct, who-commission-2025-loneliness-16pct-worldwide, who-commission-2025-older-people-socially-isolated-25-34pct
- [242]Perspectives on Psychological Science (SAGE / Association for Psychological Science). Loneliness and social isolation as risk factors for mortality: a meta-analytic review. Published 2015-03. Accessed 2026-10-11. (abstract only)Used for: holt-lunstad-2015-living-alone-mortality-32pct
- [243]Cabinet Office, Government of Japan (内閣府 孤独・孤立対策推進室). 孤独・孤立の実態把握に関する全国調査(令和7年人々のつながりに関する基礎調査)調査結果の概要. Published 2026-04-14. Accessed 2026-10-11.Used for: jp-cao-2025-loneliness-often-living-alone-9-8pct
- [244]Cabinet Office, Government of Japan (内閣府 孤独・孤立対策推進室). 孤独・孤立の実態把握に関する全国調査(令和7年)調査結果のポイント. Published 2026-04-14. Accessed 2026-10-11.Used for: jp-cao-2025-loneliness-often-80plus-3pct
- [245]Department for Culture, Media and Sport (DCMS), UK Government. Community and Engagement Survey 2025/26 - loneliness: report. Published 2026-08-14. Accessed 2026-10-11.Used for: uk-dcms-2025-26-loneliness-often-75plus-5pct
- [246]JAMA (research letter; University of Michigan National Poll on Healthy Aging). Loneliness and Social Isolation Among US Older Adults. Published 2024-12-09. Accessed 2026-10-11.Used for: malani-2024-npha-us-50-80-lack-companionship-33-4pct
- [247]European Commission, Joint Research Centre (JRC). Loneliness prevalence in the EU (EU Loneliness Survey 2022). Published 2023. Accessed 2026-10-11.Used for: eu-jrc-2022-loneliness-most-of-the-time-13pct
- [248]Ministry of Health and Welfare, Republic of Korea (보건복지부). 혼자 사시는 노인 누구나 응급안전안심서비스 신청 가능합니다 (press release, 4 April 2024). Published 2024-04-04. Accessed 2026-10-11.Used for: kr-mohw-2023-emergency-safety-service-155000-emergencies, kr-mohw-2023-emergency-safety-service-240000-households
- [249]Seoul Metropolitan Government (서울특별시). 전기사용 없으면 출동…고독사 예방 '스마트플러그' 2,000가구 확대 (press release). Published 2022-05-03. Accessed 2026-10-11.Used for: kr-seoul-2022-smart-plug-alerts-154-real-emergencies
- [250]Seoul Metropolitan Government (서울특별시), 복지실 고독대응과. “잘 지내셨어요”…안부 확인으로 외로움·고립 없는 서울 (press release). Published 2025-01-21. Accessed 2026-10-11.Used for: kr-seoul-2022-2024-smart-check-alerts, kr-seoul-2024-smart-check-in-services-44923-households, kr-seoul-2024-neighbourhood-care-team-1-99-million-check-in-calls, kr-seoul-2025-at-risk-check-ins, kr-seoul-2023-lonely-deaths-559-city-claim
- [251]Japanese Consumers' Co-operative Union (日本生活協同組合連合会). 生協の「地域見守り協定」締結状況(ニュースリリース). Published 2025-04-30. Accessed 2026-10-11.Used for: jp-jccu-2025-co-op-watch-over-agreements
- [252]Japanese Consumers' Co-operative Union (日本生活協同組合連合会). 生協の「地域見守り協定」締結状況(ニュースリリース). Published 2022-04-14. Accessed 2026-10-11.Used for: jp-jccu-2022-co-op-watch-over-agreements
- [253]Japanese Consumers' Co-operative Union (日本生活協同組合連合会). 生協の「地域見守り協定」締結状況(ニュースリリース). Published 2017-10-12. Accessed 2026-10-11.Used for: jp-jccu-2017-co-op-watch-over-agreements
- [254]Ministry of Health and Welfare, Taiwan (衛生福利部), statistics compiled from city and county governments. 獨居老人服務概況 (The Service Conditions for Elderly Living Alone), quarterly table, updated 2026-09-30. Published 2026-09-30. Accessed 2026-10-11.Used for: tw-mohw-2025-emergency-alarm-linked-share, tw-mohw-2026q2-registered-elderly-living-alone
- [255]Ministry of Health and Welfare, Taiwan (衛生福利部), statistics compiled from city and county governments. 列冊需關懷獨居老人人數及服務概況 (The Service Conditions for Elders Living Alone), 民國104-114年 table (社會福利類性別統計指標 1.4-01). Accessed 2026-10-11.Used for: tw-mohw-2025-registered-elderly-living-alone, tw-mohw-2020-registered-elderly-living-alone, tw-mohw-2015-registered-elderly-living-alone
- [256]La Poste Groupe. La Poste propose la gratuité du service "Veiller sur mes parents" (news release, 26 March 2020). Published 2020-03-26. Accessed 2026-10-11.Used for: fr-laposte-2020-veiller-sur-mes-parents-9000-clients
- [257]Guarda Nacional Republicana (GNR). Comunicado: Operação 'Censos Sénior 2026' (1 Oct 2026). Published 2026-10-01. Accessed 2026-10-11.Used for: pt-gnr-2025-older-people-alone-isolated-flagged
- [258]Cabinet Office, Japan (令和7年版高齢社会白書), from Tokyo Metropolitan Medical Examiner's Office statistics. 令和7年版高齢社会白書 第1章第2節4 生活環境 — 図1-2-4-18 東京23区内における一人暮らしで65歳以上の人の自宅での死亡者数. Published 2025-06. Accessed 2026-10-08.Used for: jp-tokyo23-me-2023-65plus-living-alone-home-deaths, jp-tokyo23-me-2013-65plus-living-alone-home-deaths, jp-tokyo23-me-2014-65plus-living-alone-home-deaths, jp-tokyo23-me-2015-65plus-living-alone-home-deaths, jp-tokyo23-me-2016-65plus-living-alone-home-deaths, jp-tokyo23-me-2017-65plus-living-alone-home-deaths, jp-tokyo23-me-2018-65plus-living-alone-home-deaths, jp-tokyo23-me-2019-65plus-living-alone-home-deaths, jp-tokyo23-me-2020-65plus-living-alone-home-deaths, jp-tokyo23-me-2021-65plus-living-alone-home-deaths, jp-tokyo23-me-2022-65plus-living-alone-home-deaths
- [259]Statistisches Bundesamt (Destatis). Statistischer Bericht - Todesursachen in Deutschland - 2023 (table 23211-04). Published 2024-08-19. Accessed 2026-10-11.Used for: de-destatis-r98-unattended-deaths-2023
- [260]Statistisches Bundesamt (Destatis). Statistischer Bericht - Todesursachen in Deutschland - 2024 (table 23211-b09). Published 2025-10-29. Accessed 2026-10-11.Used for: de-destatis-r98-unattended-deaths-2024
- [261]Collectif Les Morts de la Rue (NGO; convention with the City of Paris). Rapport d'activité 2023. Published 2024-12. Accessed 2026-10-11.Used for: fr-paris-2015-morts-isoles-buried-thiais, fr-paris-2016-morts-isoles-buried-thiais, fr-paris-2017-morts-isoles-buried-thiais, fr-paris-2018-morts-isoles-buried-thiais, fr-paris-2019-morts-isoles-buried-thiais, fr-paris-2020-morts-isoles-buried-thiais, fr-paris-2021-morts-isoles-buried-thiais, fr-paris-2022-morts-isoles-buried-thiais, fr-paris-2023-morts-isoles-buried-thiais
- [262]Collectif Les Morts de la Rue (NGO; convention with the City of Paris). Rapport d'activité 2025. Published 2026-09. Accessed 2026-10-11.Used for: fr-paris-2025-morts-isoles-buried-thiais
- [263]Ministry of Health, Labour and Welfare of Japan (厚生労働省 人口動態統計). 令和6年 人口動態統計(確定数)上巻 死亡 第5.6表 死亡の場所別にみた年次別死亡数百分率. Published 2025-09-16. Accessed 2026-10-11.Used for: jp-mhlw-1960-deaths-at-home-share, jp-mhlw-1970-deaths-at-home-share, jp-mhlw-1980-deaths-at-home-share, jp-mhlw-1990-deaths-at-home-share