Most falls in older adults are survivable. What happens in the hours afterwards often is not: the person cannot get up, nobody is there, and a long lie begins, the clinical term for an hour or more on the floor. This page collects every published figure we could verify about how often that happens, how long people wait, what it does to the body, who is most exposed, and what ambulance services see.
01 / Definition
What is a long lie?
The NIHR Long Lies Study protocol defines a long lie as a person being unable to get up and remaining on the floor for over an hour (Kuczawski et al., NIHR Open Research, 2026, citing Blackburn 2022, Kubitza 2022 and Fleming 2008).[6]
The one-hour threshold is older than most of the research that uses it. It comes from a general-practice survey in Birmingham, England, and it is the definition carried by the standard geriatrics textbook and by the UK's current national study. The literature is startlingly thin, and its definitions are not uniform, which is the first thing to know before comparing any two long-lie figures.
- A 2025 systematic review found only six articles on long lies after falls in 45 years of English-language literature and concluded there is no universal definition of a long lie, even though responders are encouraged to convey to hospital anyone on the floor for an hour or more (Holland & Watkins-Webb, Nursing Older People, 2025).[9]
- A 2022 systematic review of long lies in ambulance-attended older people found only four eligible cohort studies out of 70 identified and concluded that long lies were relatively uncommon in that setting because of rapid ambulance response (Blackburn et al., Int Emerg Nurs, 2022).[10]
- Across 22 papers using the term 'long lie', only 8 set a specific time criterion - 5 used one hour or longer, and one each used 5, 10 and 15 minutes - while 7 used vague durations and 5 set no time limit; in total 2,805 people were unable to get up and 1,121 were affected by a long lie (Kubitza et al., Eur Rev Aging Phys Act, 2023).[11]
- The earliest print use of the term 'long lie' that could be verified is Wild, Nayak & Isaacs (BMJ, 24 January 1981), which puts the phrase in quotation marks in Table IV and operationalises it as remaining on the floor unable to rise for more than one hour.[12]
- The standard geriatrics textbook 'Falls in Older People' (Lord, Sherrington & Menz, Cambridge University Press, 2001) defines the long lie as remaining on the ground or floor for more than an hour after a fall and calls it a marker of weakness, illness and social isolation.[13]
How to read the numbers on this page. Three things change a long-lie statistic by a factor of ten: the time threshold (five minutes, fifteen minutes or an hour), the denominator (per fall or per person who fell), and the population (everyone living at home, people attended by an ambulance, or people over 90). Every statement below says which it uses.
02 / Scale
How many older adults fall each year?
Over 14 million, or 1 in 4, U.S. older adults report falling every year (CDC Older Adult Falls Data, reviewed 2026).[14]
Falls are the denominator for everything that follows. Roughly a quarter to a third of people over 65 fall each year in the United States, the United Kingdom and Canada, and about half of those over 80. In the oldest old the rate is higher still: in the Cambridge cohort of people over 90, three in five fell within a single year.
- 60% of a population-based cohort of people aged over 90 (n=110) fell at least once during one year of prospective follow-up (Cambridge City over-75s Cohort; Fleming & Brayne, BMJ, 2008).[15]
- Around a third of people aged 65 and over, and around half of people aged 80 and over, fall at least once a year (NICE NG249, 2025).[16]
- Approximately 30% of people older than 65 fall at least once a year - around 3 million people in England (NICE impact report on falls and fragility fractures, 2018).[17]
- In 2020, 14 million U.S. adults aged 65 and over (27.6%) reported falling in the previous year (CDC, MMWR, 2023; BRFSS 2020).[18]
- In 2020, 28.9% of U.S. women aged 65 and over reported a fall in the past year, versus 26.1% of men (CDC, MMWR, 2023).[18]
- Around a third of people aged 65+ and around half of people aged 80+ fall at least once a year (OHID, Falls: applying All Our Health, 2022).[19]
- Around a third of all people aged 65 and over fall each year, increasing to half of those aged 80 and over (Public Health England consensus statement, 2017).[20]
- Between 20% and 30% of Canadian seniors fall each year (Public Health Agency of Canada, Seniors' Falls in Canada: Second Report).[21]
- 37.3 million falls severe enough to require medical attention occur worldwide each year (WHO Falls fact sheet, 2021).[22]
- An estimated 684,000 people die from falls globally each year (WHO Falls fact sheet, 2021).[22]
- Adults older than 60 suffer the greatest number of fatal falls (WHO Falls fact sheet, 2021).[22]
| Period | Fell in past year | Scope | Source |
|---|---|---|---|
| 2012 | 27.9% | adults aged 65 and over, community-dwelling (BRFSS; non-institutionalised) · United States | [23] |
| 2016 | 29.6% | adults aged 65 and over, community-dwelling (BRFSS; non-institutionalised) · United States | [23] |
| 2018 | 27.5% | adults aged 65 and over, community-dwelling (BRFSS; non-institutionalised) · United States | [23] |
| 2020 | 27.6% | adults aged 65 and over, community-dwelling (BRFSS; non-institutionalised) · United States | [18] |
Injuries and deaths from falls
In 2024, 43,020 U.S. adults aged 65 and over died from unintentional falls (CDC WISQARS 2024 leading causes chart).[1]
Fall deaths among older Americans have quadrupled this century, and the rate is still climbing: for men over 85 it doubled between 2003 and 2023. The state-by-state range is more than fivefold.
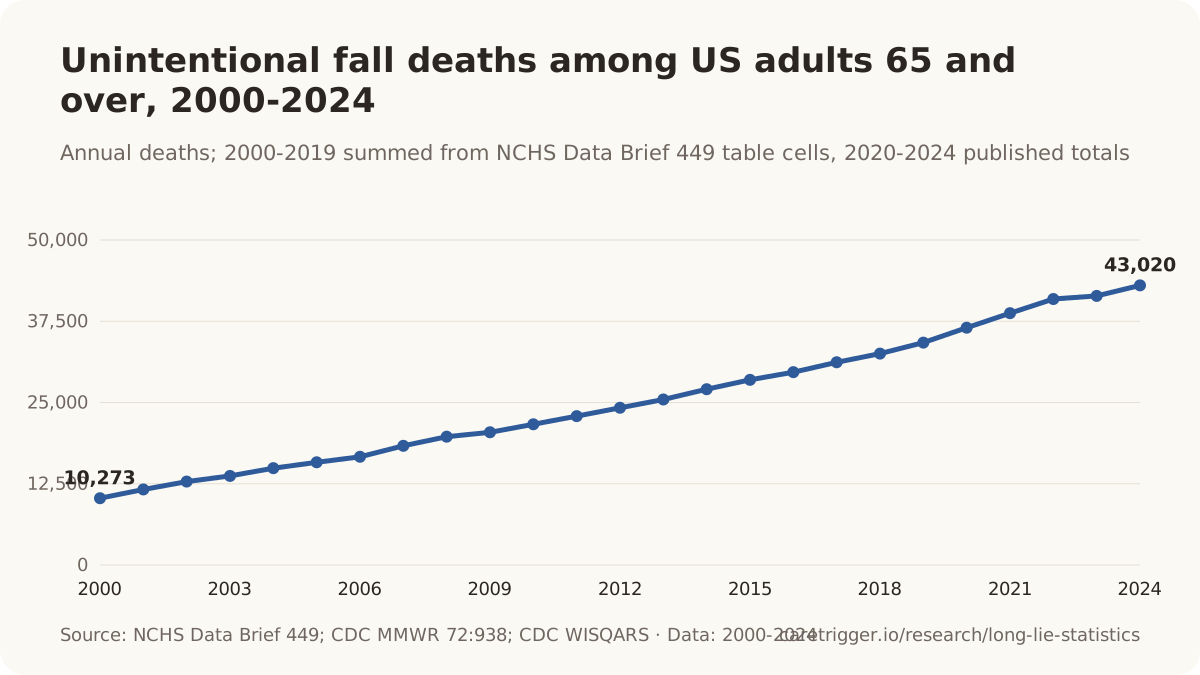
| Period | Deaths | Scope | Source |
|---|---|---|---|
| 2000 | 10,273 deaths | adults aged 65 and over (NVSS, ICD-10 W00-W19) · United States | [24] |
| 2005 | 15,802 deaths | adults aged 65 and over (NVSS, ICD-10 W00-W19) · United States | [24] |
| 2010 | 21,649 deaths | adults aged 65 and over (NVSS, ICD-10 W00-W19) · United States | [24] |
| 2015 | 28,486 deaths | adults aged 65 and over (NVSS, ICD-10 W00-W19) · United States | [24] |
| 2019 | 34,212 deaths | adults aged 65 and over (NVSS, ICD-10 W00-W19) · United States | [24] |
| 2020 | 36,508 deaths | adults aged 65 and over (NVSS, ICD-10 W00-W19) · United States | [24] |
| 2021 | 38,742 deaths | adults aged 65 and over (all residents; NVSS, ICD-10 W00-W19) · United States | [18] |
| 2022 | 40,919 deaths | adults aged 65 and over (NVSS) · United States | [25] |
| 2023 | 41,400 deaths | adults aged 65 and over (NVSS) · United States | [26] |
| 2024 | 43,020 | adults aged 65 and over (NVSS) · United States | [1] |
- Between 2003 and 2023 the fall death rate for U.S. men 85+ doubled (178.3 to 373.3 per 100,000) and for women 85+ rose 2.5 times (128.5 to 319.7) (NCHS Data Brief 532).[27]
- In 2023, the unintentional fall death rate for U.S. adults aged 85 and over was 373.3 per 100,000 for men and 319.7 for women (NCHS Data Brief 532).[27]
- In 2023, state unintentional fall death rates for adults 65+ ranged from 29.5 per 100,000 in Alabama to 158.4 in Wisconsin (NCHS Data Brief 532).[28]
- The age-adjusted unintentional fall death rate among U.S. adults 65+ reached 78.4 per 100,000 in 2024, up 21% from 2018 (CDC Older Adult Falls Data, 2026).[14]
- Deaths due to falls among Canadians aged 65+ increased 51% between 2017 and 2022 (Public Health Agency of Canada, 2025).[4]
- In 2022, 7,621 Canadian adults aged 65 and over died of falls (Public Health Agency of Canada, Health Infobase, 2025; CVSD).[4]
- Older-adult falls cause about 4.5 million U.S. emergency department visits each year, of which 3.1 million are treated and released and 1.4 million are hospitalized (CDC Facts About Falls, WISQARS, 2026).[29]
- Falls lead to about 1.4 million hospitalizations of U.S. older adults each year (CDC Facts About Falls, WISQARS, 2026).[29]
- Nearly 319,000 U.S. older adults are hospitalized for hip fractures each year (CDC Facts About Falls, 2026).[29]
- U.S. adults aged 65 and over experienced an estimated 35.6 million falls in 2018 (CDC, MMWR, 2020; BRFSS).[23]
- U.S. adults aged 65 and over had an estimated 8.4 million fall-related injuries in 2018 (CDC, MMWR, 2020; BRFSS).[23]
- In 2018, 10.2% of U.S. adults aged 65 and over reported an injury from a fall in the past year (CDC, MMWR, 2020; BRFSS).[23]
- CDC estimated about nine million fall injuries among U.S. older adults per year (applying 37% injured to 14 million fallers) - sentence present only on the archived CDC data page.[30]
- One in 10 falls among U.S. older adults results in an injury that restricts activity for a day or more or leads to seeking health care (CDC Facts About Falls, 2026).[29]
- The age-adjusted unintentional fall death rate among U.S. adults 65+ was 78.0 per 100,000 in 2021 (CDC, MMWR, 2023).[18]
- The age-adjusted unintentional fall death rate among U.S. adults 65+ was 64.7 per 100,000 in 2018 (CDC Older Adult Falls Data, 2026).[14]
- The age-adjusted unintentional fall death rate among U.S. adults 65+ was 55.3 per 100,000 in 2012 (CDC Older Adult Falls Data, archived version).[30]
- The unintentional fall death rate among U.S. adults 65+ was 69.9 per 100,000 in 2023; 74.2 for men and 66.3 for women (NCHS Data Brief 532).[27]
- The crude unintentional fall death rate among U.S. adults 65+ was 65.6 per 100,000 in 2020 (NCHS Data Brief 449).[31]
- In 2024, unintentional fall death rates among U.S. adults 65+ were 74.8 per 100,000 for men and 66.6 for women (CDC MMWR QuickStats, 2026; NVSS).[32]
- Between 2019 and 2020 there were around 234,800 emergency hospital admissions in England related to falls among people aged 65 and over; around 157,370 (67%) were aged 80+ (NICE NG249, 2025).[16]
- There were around 220,160 emergency hospital admissions related to falls among patients aged 65 and over in England in 2017 to 2018, 66.6% of them aged 80+ (OHID, 2022).[19]
- PHE cited 255,000 falls-related emergency hospital admissions per year for older people in England (Falls and fracture consensus statement, 2017).[20]
- Emergency admissions due to falls in people aged 65+ in England were 2,114 per 100,000 in 2016/17; 993 per 100,000 at 65-79 and 5,363 at 80+ (NICE impact report, 2018, citing the Public Health Outcomes Framework).[17]
- In 2022 there were 78,076 fall-related hospitalizations among Canadians aged 65 and older; falls cause 89% of injury hospitalizations in this group (PHAC, 2025; CIHI DAD).[4]
- In 2022 there were 200,825 fall-related emergency department visits among adults 65+ reported in Ontario and Alberta alone (PHAC, 2025; NACRS).[4]
- Falls cause over 38 million disability-adjusted life years (DALYs) lost worldwide each year (WHO Falls fact sheet, 2021).[22]
- Over 80% of fall-related deaths occur in low- and middle-income countries (WHO Falls fact sheet, 2021).[22]
03 / Unable to get up
How many people who fall cannot get up on their own?
47% of non-injured fallers aged 72+ (148 of 313) reported being unable to get up without help after at least one fall, over a mean 21-month follow-up in New Haven (Tinetti, Liu & Claus, JAMA, 1993).[5]
This is the gateway statistic. A long lie cannot happen to someone who can get back up, and the inability to rise after a fall is far more common than the long lie itself. In the over-90s, four in five fallers needed help off the floor at least once in a year; among people attended by an ambulance, nearly four in five needed help, and about half were still on the floor when the crew arrived.
- 80% of over-90s who fell (53 of 66) were unable to get up after at least one fall during one year of follow-up (Fleming & Brayne, BMJ, 2008).[15]
- A 2023 scoping review on the concept of the long lie states that 78% of people aged 65+ who fall need help to get up from the floor (citing Johnston et al. 2010, an Australian ambulance audit).[11]
- In 66% of falls (176 of 265) reported by people over 90, the person was unable to get up without help (Fleming & Brayne, BMJ, 2008).[15]
- Just over 53% of older people attended by ambulance after a fall in NSW were still on the floor when the ambulance arrived (Simpson et al. 2014, as restated by Blackburn et al., Int Emerg Nurs, 2022).[33]
- A 2022 BMC Geriatrics scoping review states that half of people over 65 who fall are found on the floor by rescue services (citing Simpson 2014 and Tinetti 1993).[34]
- 54% of fall reports (144 of 265) among people over 90 described the participant as being found on the floor (Fleming & Brayne, BMJ, 2008).[15]
- A 2022 BMC Geriatrics scoping review states that after a fall, more than half of older people living alone are unable to get up or get help independently (citing Simpson 2014, Tinetti 1993 and Vellas 1987).[34]
- A 2022 BMC Geriatrics scoping review states that among people in need of care, 70% of those who fell already had problems getting up (citing Vellas et al., Age Ageing, 1987).[34]
- Including falls with serious injury, 50% of all fallers (185 of 370) and 39% of all falls (259 of 660) involved inability to get up without help (Tinetti, Liu & Claus, JAMA, 1993, Table 1).[5]
- Inability to get up without help was reported after 37% of non-injurious falls (220 of 596) among community-living people aged 72+ (Tinetti, Liu & Claus, JAMA, 1993).[5]
- One in ten of 539 falls among 325 community-dwelling previous fallers left the person unable to get up for at least 5 minutes, and one in four falls led to activity limitation (Nevitt, Cummings & Hudes, J Gerontol, 1991).[35]
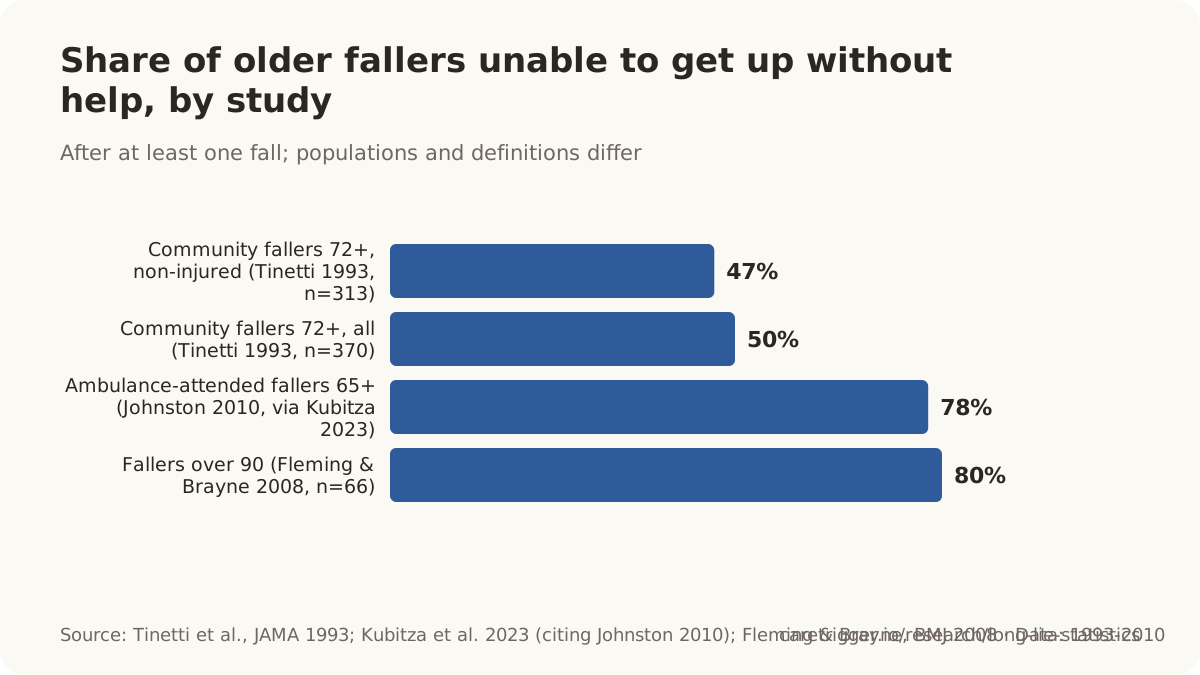
| Study and denominator | Unable to get up | Scope | Source |
|---|---|---|---|
| Non-injured fallers, community 72+ (Tinetti 1993) | 47% | Community-living residents aged 72+ able to follow simple commands and walk unassisted (Project Safety cohort) · New Haven, Connecticut, USA · Baseline 1989; mean follow-up 21 months (falls ascertained over mean 15.9 months) | [5] |
| All fallers incl. injured, community 72+ (Tinetti 1993) | 50% | Community-living residents aged 72+ able to follow simple commands and walk unassisted (Project Safety cohort) · New Haven, Connecticut, USA · Baseline 1989; mean follow-up 21 months (falls ascertained over mean 15.9 months) | [5] |
| Falls in over-90s, per fall (Fleming & Brayne 2008) | 66% | Surviving participants of the Cambridge City over-75s Cohort, aged 91-105 (median 94); 90 women, 20 men · Cambridge, England (own homes and care homes) · 2002-03 survey, 1-year prospective follow-up (2003-04) | [15] |
| Care-dependent fallers with problems getting up (Vellas 1987 via Kubitza 2022) | 70% | Older people affected by a long lie after a fall (scoping review of therapy options; 19 publications) · International (review; included studies from 5 countries) · Literature to 2021 (published 2022) | [34] |
| Fallers 65+ needing help to get up, ambulance-attended (Johnston 2010 via Kubitza 2023) | 78% | Studies using the term 'long lie' (or equivalents) after a fall, mostly in older adults · International (scoping review; 22 papers) · Literature search to 2022 (published 2023) | [11] |
| Fallers over 90, after at least one fall (Fleming & Brayne 2008) | 80% | Surviving participants of the Cambridge City over-75s Cohort, aged 91-105 (median 94); 90 women, 20 men · Cambridge, England (own homes and care homes) · 2002-03 survey, 1-year prospective follow-up (2003-04) | [15] |
04 / Frequency
How many falls become a long lie?
The published protocol of the NIHR Long Lies Study (Kuczawski et al., NIHR Open Research, 2026) states that around one in three adults over 65 fall each year and about one in five of these remain on the floor for over an hour.[6]
There is no single answer, and anyone who gives you one without a denominator is rounding. For older fallers generally, one in eight to one in five is the range quoted; among people attended by an ambulance after a fall, about one in eight. Per fall, the figure runs from a few percent of non-injurious falls in community-living people in their seventies to about one in seven falls in the oldest cohort studied. In the original Birmingham survey, four people lay on the floor for more than six hours.
- A 2022 BMC Geriatrics scoping review states that one in eight older people who fall report lying on the floor for more than an hour (citing Simpson 2014 and Vellas 1987).[34]
- Long lies (more than 60 minutes on the ground) occurred in 13% of 1,610 emergency ambulance cases for people aged 65+ who had fallen in New South Wales, with a median response time of 15 minutes (Simpson et al., Prehosp Emerg Care, 2014).[36]
- 4 of 125 home fallers aged 65+ (3.2%) remained on the floor for more than six hours (Wild, Nayak & Isaacs, BMJ, 1981).[12]
- 20 of 125 people aged 65+ who fell at home (16%) remained on the floor unable to rise for more than one hour, in a six-practice Birmingham survey (Wild, Nayak & Isaacs, BMJ, 1981).[12]
- Lord, Sherrington & Menz (2001) report that Vellas (1987) found more than 20% of patients admitted to hospital because of a fall had been on the ground for an hour or more.[13]
- At baseline, 31% of fallers (8 of 26) in six California memory care facilities spent more than one hour on the ground after a fall; with real-time video fall detection this fell to zero (Bayen et al., JMIR, 2021).[38]
- Only 3% of non-injurious falls among community-living people aged 72+ left the person on the floor for over 60 minutes, and 9% for over 30 minutes (Tinetti, Liu & Claus, JAMA, 1993).[5]
- 30% of over-90s who fell (20 of 66) lay on the floor for an hour or more after at least one fall during one year of follow-up (Fleming & Brayne, BMJ, 2008).[15]
- 15% of all reported falls (40 of 265) among people over 90 resulted in the person lying on the floor for an hour or more (Fleming & Brayne, BMJ, 2008).[15]
- 28% of unwitnessed falls in which the over-90 faller could not get up (40 of 143) led to lying on the floor for an hour or more (Fleming & Brayne, BMJ, 2008).[15]
- Johnston & Grimmer-Somers (2010) note that in the over-90 cohort 30% (n=20) of fallers were on the floor an hour or more and for a further 9% (n=6) the maximum time on the floor was unknown, adding that 'the incidence of long lies is largely unknown'.[39]
- 12% of men and 19% of women aged 65+ who sought medical attention after a fall in Finland lay where they fell for 15 minutes or more (Ryynänen et al., Z Gerontol, 1992).[40]
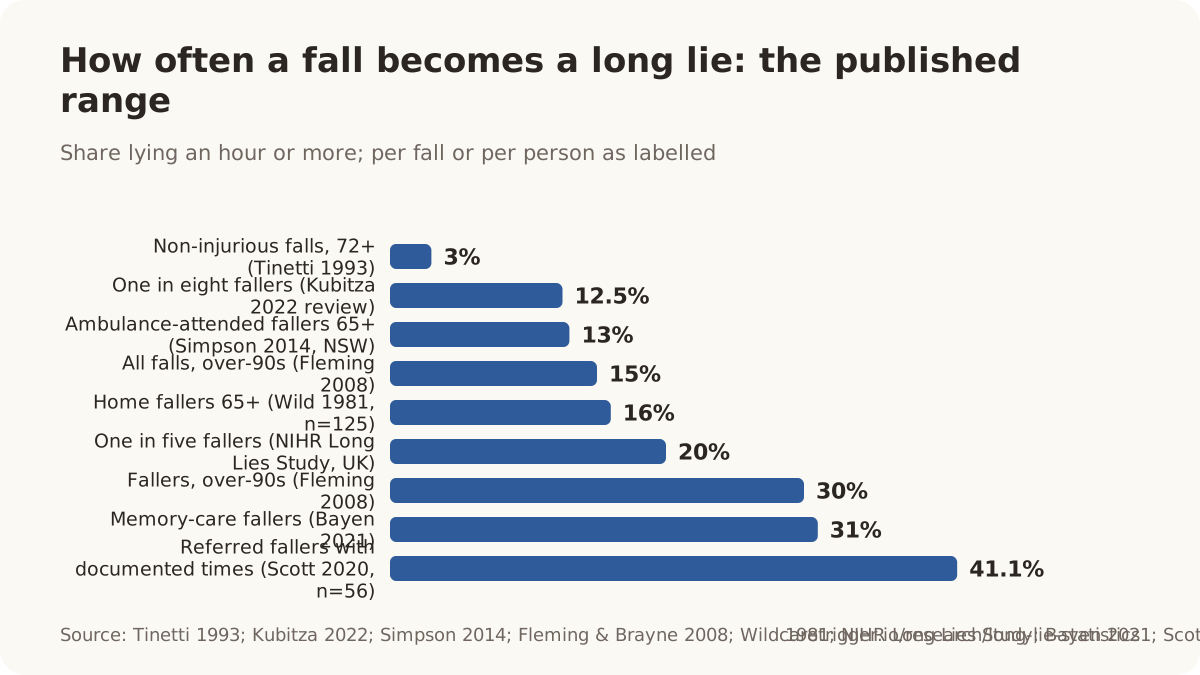
| Population and denominator | Long lie | Scope | Source |
|---|---|---|---|
| Non-injurious falls over 60 minutes, community 72+ (Tinetti 1993) | 3% | Community-living residents aged 72+ able to follow simple commands and walk unassisted (Project Safety cohort) · New Haven, Connecticut, USA · Baseline 1989; mean follow-up 21 months (falls ascertained over mean 15.9 months) | [5] |
| Home fallers 65+ over six hours (Wild 1981, 4 of 125) | 3.2% | People aged 65+ who fell in their own homes and were notified by their general practice (biased toward injured/frail fallers, per Tinetti 1993) · Birmingham area, England (six general practices) · Survey of falls at home with 1-year follow-up; accepted 7 Nov 1980, published 24 Jan 1981 | [12] |
| People with multiple sclerosis aged 55+, long lie after most recent fall (Bisson 2015) | 4.7% | Community-dwelling people with multiple sclerosis aged 55+ who provided a fall story (not a general older-adult population) · United States and Canada (NARCOMS registry) · Cross-sectional survey, data collected c. 2012-13; published 2015 | [41] |
| Older fallers over an hour, review estimate (Kubitza 2022) | 1 in 8 | Older people affected by a long lie after a fall (scoping review of therapy options; 19 publications) · International (review; included studies from 5 countries) · Literature to 2021 (published 2022) | [34] |
| Ambulance-attended fallers 65+ over 60 minutes (Simpson 2014, NSW) | 13% | People aged 65+ who had fallen and called an emergency ambulance · New South Wales, Australia (Ambulance Service of NSW) · 1 Oct 2010 - 30 Jun 2011 | [36] |
| All falls an hour or more, over-90s (Fleming & Brayne 2008) | 15% | Surviving participants of the Cambridge City over-75s Cohort, aged 91-105 (median 94); 90 women, 20 men · Cambridge, England (own homes and care homes) · 2002-03 survey, 1-year prospective follow-up (2003-04) | [15] |
| Home fallers 65+ over an hour (Wild 1981, 20 of 125) | 16% | People aged 65+ who fell in their own homes and were notified by their general practice (biased toward injured/frail fallers, per Tinetti 1993) · Birmingham area, England (six general practices) · Survey of falls at home with 1-year follow-up; accepted 7 Nov 1980, published 24 Jan 1981 | [12] |
| Adults 65+ who fall and remain over an hour, UK framing (NIHR Long Lies Study protocol 2026) | 1 in 5 | Patients who have a long lie after a fall (study protocol; background statistics on older adults) · United Kingdom (Yorkshire Ambulance Service region for quantitative data) · Protocol published 25 Feb 2026; data 2024-2026 | [6] |
| Hospital-admitted fallers on the ground an hour or more (Vellas 1987 via Lord 2001) | over 20% | Older people (textbook chapter 'Epidemiology of falls') · International (textbook; Australian authors) · First edition 2001 | [13] |
| Fallers over 90, per person, one year (Fleming & Brayne 2008) | 30% | Surviving participants of the Cambridge City over-75s Cohort, aged 91-105 (median 94); 90 women, 20 men · Cambridge, England (own homes and care homes) · 2002-03 survey, 1-year prospective follow-up (2003-04) | [15] |
| Memory-care fallers over an hour on the ground (Bayen 2021) | 31% | Residents with Alzheimer disease or related dementias (mean age 87; 66 participants, 436 falls) · California, USA (6 memory care facilities) · 10-month observational study (published 2021) | [38] |
| Referred fallers with documented fall time, an hour or more before ambulance arrival (Scott 2020, n=56) | 41% | Service users aged 65+ who fell and were referred by paramedics to a falls prevention service (75 of 1,079 fall incidents); long-lie share computed among 56 with documented onset time · South Eastern division, Northern Ireland Ambulance Service, UK · 1 Jul - 30 Sep 2017 | [37] |
Why the same 1981 study is quoted as "16%" and "20%". The Birmingham survey reported twenty of its one hundred and twenty-five home fallers lying for more than an hour, which is sixteen percent. Later papers restated it as a fifth of falls, and the rounded version has travelled further than the original. We record both the primary figure and the restatements so you can see where a number came from.
- Fleming & Brayne (BMJ, 2008) restate the 1981 Birmingham general-practice survey as finding that 16% of home fallers aged over 65 lay on the floor for more than an hour (20 of 125).[15]
- Tinetti et al. (JAMA, 1993) characterise the 1981 British study as reporting that 20% of falls resulted in a lie of more than one hour, noting those falls were reported to physicians and likely over-represent frail or injured fallers.[5]
- Tinetti et al. (JAMA, 1993) summarise two earlier prospective studies (Nevitt 1991; Campbell 1990) as finding that almost half of fallers required help getting up but only 10% of falls resulted in a lie of more than one hour.[5]
05 / Duration
How long do people lie on the floor after a fall?
The median estimated time spent incapacitated was 4.5 hours across all events; 2 hours for those found alive and 18 hours for those found dead (Gurley et al., NEJM, 1996; San Francisco, 1993).[3]
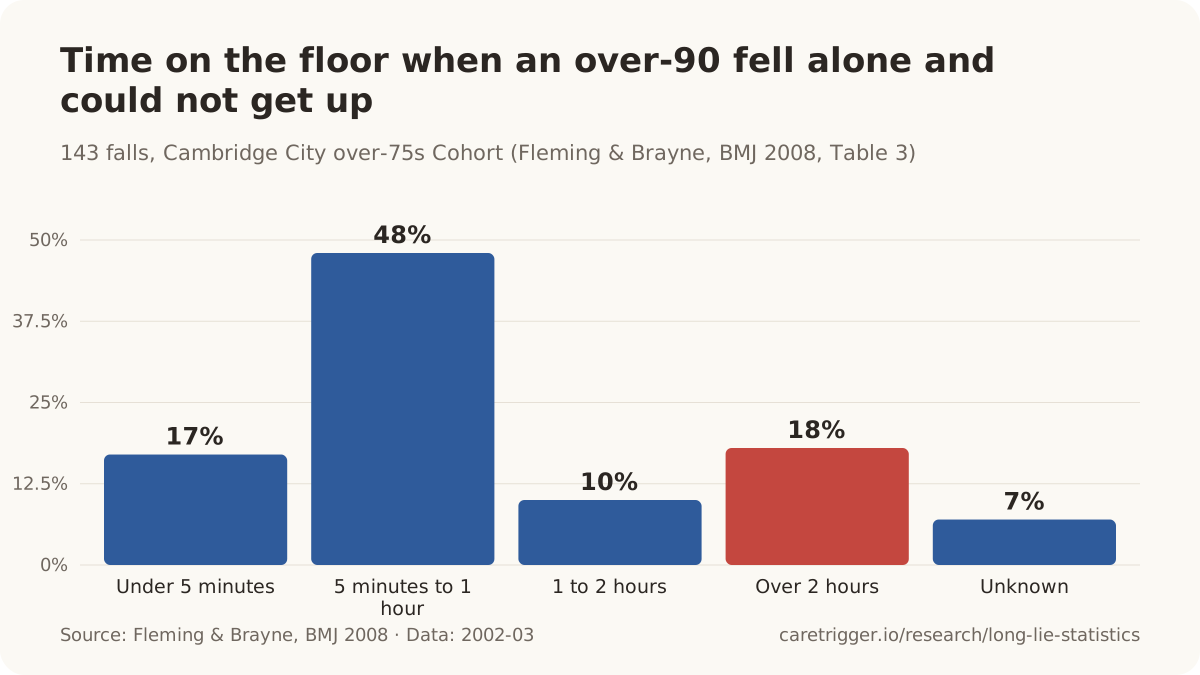
The honest shape of the answer is a long tail. Most people who fall and cannot get up are helped within the hour; a minority wait for hours, and a small group for days, and the people who were found dead had been down the longest. The San Francisco figures above cover people living alone found helpless at home from any cause. The only prospective study that timed every fall in a cohort, the Cambridge over-90s, gives the fall-specific distribution below.
- 10% of people found helpless or dead at home had been unable to summon help for more than three days, and only 38% of that group survived (Gurley et al., NEJM, 1996; San Francisco, 1993).[3]
- Among the 90 people found dead at home in the San Francisco study, paramedics estimated 29% had been down for more than 72 hours (median 18 hours), versus a median of 2 hours for those found alive, of whom 31% had been helpless under an hour.[3]
- When over-90s fell alone and could not get off the floor, help to get up arrived within five minutes in only 17% of such falls (25 of 143) (Fleming & Brayne, BMJ, 2008).[15]
- Among 143 falls where an over-90 was alone and unable to get up, time on the floor was under 5 minutes in 17%, 5 minutes to under 1 hour in 48%, 1-2 hours in 10%, over 2 hours in 18% and unknown in 7% (Fleming & Brayne, BMJ, 2008, Table 3).[15]
- Among 265 falls in people over 90, time on the floor was under 5 minutes in 43%, 5 minutes to under 1 hour in 36%, 1-2 hours in 5%, over 2 hours in 10% and unknown in 6% (Fleming & Brayne, BMJ, 2008, Table 3).[15]
- Among non-injured fallers aged 72+ who could not get up, mean time on the floor was 11.7 minutes (SD 22.0; range 1-180 minutes); for seriously injured fallers it was 19.1 minutes (Tinetti, Liu & Claus, JAMA, 1993).[5]
Two numbers we will not publish. The claim that "the average long lie lasts more than twelve hours" and the "golden hour" claim that nine in ten people who get help within an hour recover appear on many medical-alert marketing pages. We could not trace either to a primary source, and neither matches the distributions above. If you have a citation, tell us and we will add it.
Waiting for an ambulance (England)
In December 2022 one in ten Category 3 ambulance incidents in England waited more than 11 hours 5 minutes 56 seconds (90th centile), per NHS England Ambulance Quality Indicators.[42]
A fall without obvious injury is usually triaged as urgent rather than life-threatening, which in England means a Category 3 response with a national standard of two hours for nine in ten calls. In the winter of 2022 the slowest tenth of those calls waited more than eleven hours, and in one year more than a thousand older fallers waited over twelve. Response times have since recovered to roughly the standard, but a person on the floor who has phoned for help is still on the floor until the crew arrives.
- In 2022/23, 1,411 older patients in England waited more than 12 hours for an ambulance after a fall, a more than tenfold increase on 2019/20, per ambulance-trust FOI responses compiled by the Liberal Democrats (March 2024).[43]
- In 2022/23 there were 19,904 incidents in England where a person aged over 65 who had fallen waited more than four hours for an ambulance, an average of 54 a day, per Freedom of Information responses from ambulance trusts compiled by the Liberal Democrats (March 2024).[43]
- In December 2022, the worst month on record, the mean Category 3 ambulance response time in England was 4 hours 19 minutes 10 seconds, per NHS England Ambulance Quality Indicators (published January 2023).[42]
- The NHS England national standard for Category 3 (urgent) ambulance calls is a response within 120 minutes for 90% of incidents, per NHS England / Nuffield Trust (standard in force since the 2017 Ambulance Response Programme).[44]
- In December 2025 the mean Category 3 ambulance response time in England was 2 hours 1 minute 17 seconds, in the month with the largest ever number of ambulance incidents, per NHS England Ambulance Quality Indicators (published January 2026).[45]
- In December 2025 the 90th-centile Category 3 ambulance response time in England was 4 hours 48 minutes 28 seconds, per NHS England Ambulance Quality Indicators.[45]
- In May 2026 one in ten Category 3 ambulance incidents in England waited more than 4 hours 8 minutes 14 seconds (90th centile), about twice the 120-minute standard, per NHS England Ambulance Quality Indicators.[46]
- In a prospective NSW cohort of 1,610 ambulance responses to fallers aged 65+ (2010-11), the median response time was 15 minutes and 13% of patients had a long lie of more than 60 minutes on the ground; 28% were not transported, per Simpson et al., Prehospital Emergency Care 2014.[47]
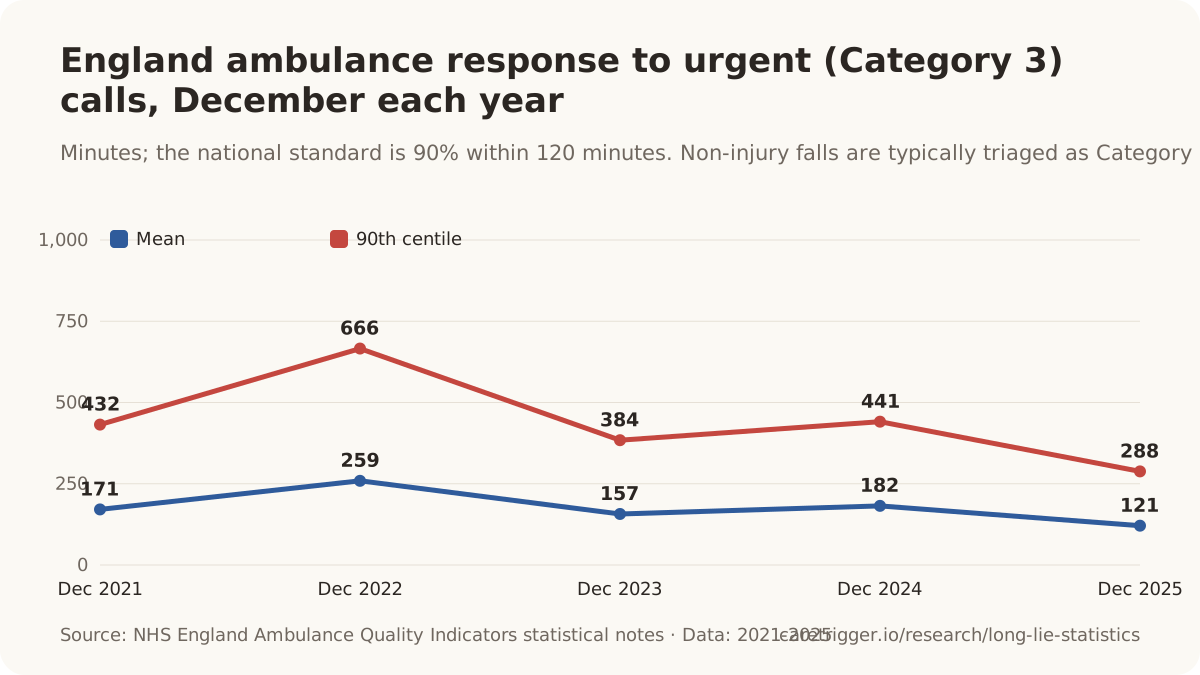
| Period | Mean response | Scope | Source |
|---|---|---|---|
| October 2021 | 3 h 10 min | All Category 3 ambulance incidents, all 10 English ambulance trusts · England | [48] |
| December 2021 | 2 h 51 min | All Category 3 ambulance incidents · England | [49] |
| February 2022 | 2 h 16 min | All Category 3 ambulance incidents · England | [50] |
| December 2022 | 4 h 19 min | All Category 3 ambulance incidents · England | [42] |
| December 2023 | 2 h 37 min | All Category 3 ambulance incidents · England | [51] |
| December 2024 | 3 h 02 min | All Category 3 ambulance incidents · England | [52] |
| January 2025 | 1 h 55 min | All Category 3 ambulance incidents · England | [53] |
| November 2025 | 2 h 02 min | All Category 3 ambulance incidents · England | [54] |
| December 2025 | 2 h 01 min | All Category 3 ambulance incidents · England | [45] |
| February 2026 | 1 h 42 min | All Category 3 ambulance incidents · England | [55] |
| May 2026 | 1 h 48 min | All Category 3 ambulance incidents · England | [46] |
| Period | 90th centile | Scope | Source |
|---|---|---|---|
| October 2021 | 7 h 47 min | All Category 3 ambulance incidents · England | [48] |
| December 2021 | 7 h 12 min | All Category 3 ambulance incidents · England | [49] |
| February 2022 | 5 h 30 min | All Category 3 ambulance incidents · England | [50] |
| December 2022 | 11 h 06 min | All Category 3 ambulance incidents · England | [42] |
| December 2023 | 6 h 24 min | All Category 3 ambulance incidents · England | [51] |
| December 2024 | 7 h 21 min | All Category 3 ambulance incidents · England | [52] |
| January 2025 | 4 h 29 min | All Category 3 ambulance incidents · England | [53] |
| November 2025 | 4 h 47 min | All Category 3 ambulance incidents · England | [54] |
| December 2025 | 4 h 48 min | All Category 3 ambulance incidents · England | [45] |
| February 2026 | 3 h 52 min | All Category 3 ambulance incidents · England | [55] |
| May 2026 | 4 h 08 min | All Category 3 ambulance incidents · England | [46] |
06 / Complications
What happens to the body during a long lie?
Among 50 'long lie trauma' ED patients (median 13.5 h on the ground), associated diagnoses were hypovolaemia 66%, infection 52%, injury 22%, severe rhabdomyolysis (CK >=5000 U/l) 21%, acute kidney injury 20% and severe hypothermia <32 C 20% (Hüser et al., 2023, Cologne).[56]
The damage of a long lie is mostly not the fall. It is hours of unrelieved pressure on skin and muscle, no fluids, a cooling floor, and in many cases a bladder emptied where the person lies. Pressure damage to deep tissue begins within hours; muscle breakdown releases proteins that can shut down the kidneys, and in people over 70 almost every case of that condition is a long lie; hypothermia is common in winter even indoors. How often each complication appears depends heavily on which patients a study counts.
- Integrated evidence from human, animal and cell studies indicates pressure ulcers in deep tissue under bony prominences very likely begin between the first hour and 4 to 6 hours of sustained loading (Gefen, Ostomy/Wound Management, 2008).[57]
- In a French hospital cohort of 343 rhabdomyolysis patients (CK >5x normal), 90% of cases in patients aged 70 and over were explained by prolonged immobilization, principally after a fall (Morin, Somme & Corvol, BMC Geriatrics, 2024).[58]
- In a London case-control study, 79% of patients admitted with hypothermia after being found ill indoors (mean age 80) had been found on the floor, versus 14% of controls; 86% lived alone (vs 43%) (Woodhouse, Keatinge & Coleshaw, The Lancet, 1989).[59]
- In a 10-year Australian regional hospital series of 383 rhabdomyolysis cases (median age 71), the leading cause was prolonged immobility after a fall (71.5%); 50.7% developed acute kidney injury, 9.9% needed kidney replacement therapy and 7.6% died (Choy et al., Renal Society of Australasia Journal, 2020).[60]
- Acute renal failure occurred in 57.7% of 343 rhabdomyolysis cases (median age 75; most older cases due to prolonged immobilization after a fall) at Rennes University Hospital, 2013-2019 (Morin et al., BMC Geriatrics, 2024).[58]
- In 308 emergency-department rhabdomyolysis cases (CPK >=500 U/L) at two Florida community hospitals in 2017-2018, pressure injury / prolonged immobility was the most common cause (53.6%); 90.3% were admitted and 4.3% needed haemodialysis (Alter et al., JACEP Open, 2025).[61]
- Among 370 patients over 80 presenting to a UK tertiary hospital after a fall with long lie and no trauma (Dec 2021-Jul 2022), 65% had a creatine kinase result and 39% of those were elevated; 4% (15 patients) developed acute kidney injury (Walters & Baxter, University Hospital Southampton, World Falls Congress abstract via British Geriatrics Society, 2026).[62]
- Only 4% (15 of 370) of over-80s presenting to a UK hospital after a fall with long lie and no trauma developed acute kidney injury, while 25% were discharged the same day (Walters & Baxter, BGS/World Falls Congress abstract, 2026).[62]
- Dehydration was diagnosed in 42 of 261 people (16%) transported to hospital after being found helpless at home; decubitus ulcers in 10 and aspiration pneumonia in 10 (Gurley et al., NEJM, 1996).[3]
- Among 86 hypothermic elderly patients treated in a UK department between 1980 and 1985, mortality within 48 hours was 36%, and 90% of those who survived the hypothermia died within one year (Gautam et al., Public Health, 1989).[63]
- In Japan's nationwide accidental-hypothermia registry (2018-2020, 1,194 patients, median age 79), 73.4% of cases occurred indoors, 49.3% were caused by acute medical illness, and 30-day mortality was 24.5% (Takauji et al., Acute Medicine & Surgery, 2021).[64]
Why "kidney injury after a long lie" ranges from 4% to 57.7%. The low figure counts every over-80 who arrived at one hospital after a long lie without trauma; the high figure counts only patients who already had rhabdomyolysis severe enough to be diagnosed. Both are correct for their denominator. Quote the denominator with the number.
The psychological aftermath
- In the study that defined the 'post-fall syndrome', 10 of 36 older patients admitted after a fall showed severe clutching/grabbing and could not walk unaided, and 9 of those 10 had died or were still in hospital four months later (Murphy & Isaacs, Gerontology, 1982).[65]
- A 2024 meta-analysis of 153 studies with 200,033 older adults in 38 countries estimated the global prevalence of fear of falling at 49.60% (range 6.96-90.34%), higher among patients than community residents (52.2% vs 48.4%) (Xiong et al., BMC Geriatrics, 2024).[66]
- 32% (70 of 219) of older people who fell during a two-year study reported a fear of falling afterwards; fearful fallers went on to develop greater mobility restriction (Vellas et al., Age and Ageing, 1997; New Mexico, USA).[67]
07 / Outcomes
What are the chances of surviving a long lie, and of going home afterwards?
Total mortality was 67% for people estimated to have been helpless for more than 72 hours versus 12% for those helpless for under 1 hour; overall mortality was 28% (Gurley et al., NEJM, 1996).[3]
Time on the floor predicts death in every study that has measured it, and it predicts loss of independence almost as strongly: most survivors of being found helpless at home never returned to independent living. The San Francisco figures cover people living alone found helpless from any cause, so they bound the problem rather than isolate falls; the fall-specific cohorts from Birmingham, New Haven and Cambridge point the same way.
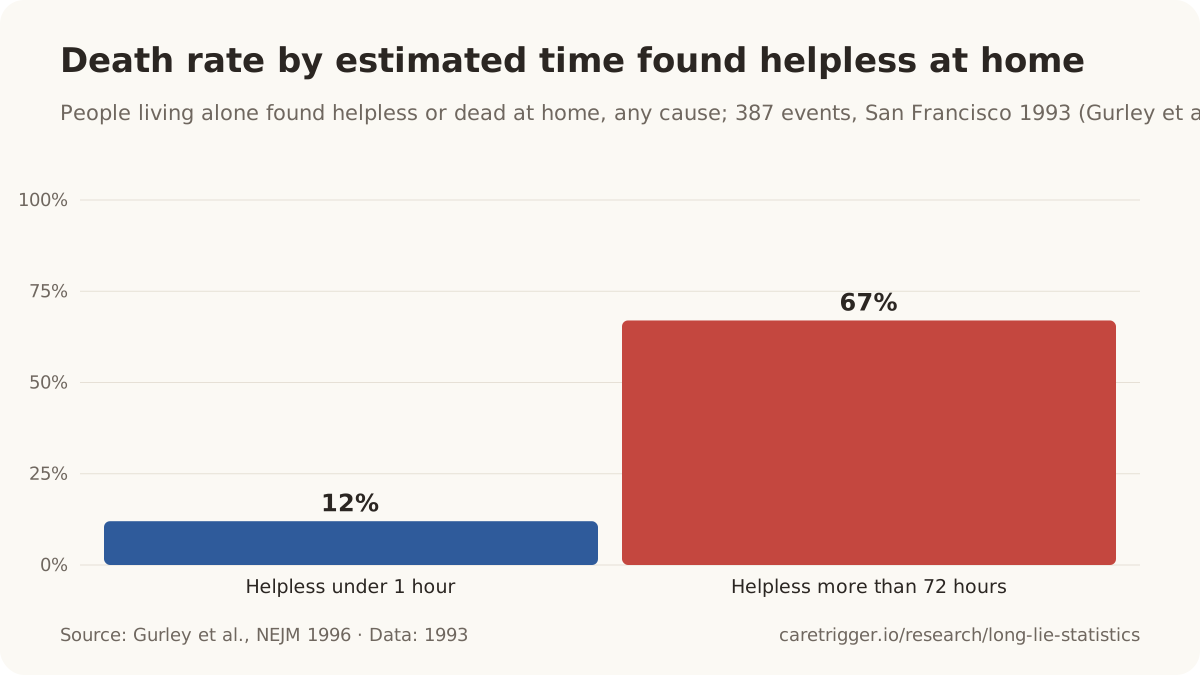
- Half of the home fallers who lay on the floor for more than one hour died within six months of the fall (Wild, Nayak & Isaacs, BMJ, 1981).[12]
- 62% of survivors of being found helpless at home were unable to return to independent living (Gurley et al., NEJM, 1996; San Francisco, 1993).[3]
- Of people hospitalised after being found helpless at home, two thirds either died or did not return to independent living (Gurley et al., NEJM, 1996; San Francisco, 1993).[3]
- Among people aged 90+ who lay on the floor for an hour or more after a fall, 36% (5 of 14) moved into long-term care within one year and 53% (8 of 15) by the end of the study (Fleming & Brayne, BMJ, 2008).[68]
- 60% (12 of 20) of people aged 90+ who had lain on the floor for an hour or more were admitted to hospital for a fall during the follow-up year (adjusted OR 4.0, 95% CI 1.3-12.3) (Fleming & Brayne, BMJ, 2008).[68]
- Among people aged 90+, lying on the floor for an hour or more after a fall was associated with serious injury (adjusted odds ratio 4.2, 95% CI 1.2-14.8) (Fleming & Brayne, BMJ, 2008; Cambridge, UK).[68]
- In Table IV of Wild, Nayak & Isaacs (BMJ, 1981), 11 of 20 fallers with a 'long lie' after the fall (55%) had died within one year, versus 21 of 105 without (20%).[12]
- One quarter of 125 home fallers aged 65+ (32) died within one year, five times the number in an age- and sex-matched control group (8) (Wild, Nayak & Isaacs, BMJ, 1981).[12]
- One-year mortality was 11% (17) among fallers unable to get up vs 5% (9) among fallers able to get up and 6% (47) among non-fallers; the trend was not statistically significant (Tinetti, Liu & Claus, JAMA, 1993, Table 5).[5]
- Fallers who could not get up without help were more likely to suffer lasting decline in activities of daily living than fallers who could get up (35% vs 26%) (Tinetti, Liu & Claus, JAMA, 1993).[69]
- Among community-dwelling people over 71, at least one fall causing serious injury carried an adjusted odds ratio of 10.2 (95% CI 5.8-17.9) for long-term nursing-home admission over three years; one non-injurious fall 3.1; two or more non-injurious falls 5.5 (Tinetti & Williams, NEJM, 1997).[70]
- 12.1% (133 of 1,103) of community-dwelling people over 71 had long-term admissions to nursing homes during three years of follow-up (Tinetti & Williams, NEJM, 1997; New Haven, USA).[70]
- Of 387 episodes of people living alone being found helpless or dead at home in San Francisco in 1993, 23% were found dead and a further 5% died in hospital, a total mortality of 28% (Gurley et al., NEJM, 1996).[3]
- Of people found alive but helpless at home, 62% were admitted to hospital, with an average stay of eight days (Gurley et al., NEJM, 1996; San Francisco, 1993).[3]
- 52% of hospital-admitted people who had been found helpless at home required intensive care, with an average ICU stay of seven days (Gurley et al., NEJM, 1996; San Francisco, 1993).[3]
- In-hospital mortality was 10% overall and 16% among those requiring intensive care, for people admitted after being found helpless at home (Gurley et al., NEJM, 1996; San Francisco, 1993).[3]
- Of survivors discharged to supportive care after being found helpless at home, 77% went to nursing homes, skilled-nursing or rehabilitation facilities and only 4% to live with family or friends (Gurley et al., NEJM, 1996).[3]
- Of 50 'long lie trauma' patients (median age 76, median 13.5 hours on the ground) presenting to a German university emergency department in 2018-2020, 69% were admitted to intensive care and in-hospital mortality was 50% (Hüser et al., Med Klin Intensivmed Notfmed, 2023).[56]
- 30-day in-hospital mortality was 10.5% (23 deaths) among 343 rhabdomyolysis patients, median age 75, at Rennes University Hospital, 2013-2019 (Morin et al., BMC Geriatrics, 2024).[58]
| Outcome | Share | Scope | Source |
|---|---|---|---|
| Total mortality, helpless under 1 hour | 12% | Persons living alone found helpless or dead at home, estimated time incapacitated <1 h · San Francisco, California, USA · 12 weeks, March-May 1993 | [3] |
| for those found helpless at home after 72+ hours, compared to just 12% when found within an hour (NEJM, 1996) | 67% | Persons living alone found helpless or dead in their homes by city paramedics; all causes of helplessness (falls, weakness, stroke, etc.), median age 73 · San Francisco, California, USA · 12 weeks, March-May 1993 | [3] |
| Total mortality, all events (23% found dead + 5% died in hospital) | 28% | Persons living alone found helpless or dead at home by paramedics · San Francisco, California, USA · 12 weeks, March-May 1993 | [3] |
| Found alive and admitted to hospital | 62% | Persons living alone found alive but helpless at home (n=297 episodes) · San Francisco, California, USA · 12 weeks, March-May 1993 | [3] |
| Admitted patients needing intensive care | 52% | Hospital-admitted persons living alone found helpless at home · San Francisco, California, USA · 12 weeks, March-May 1993 | [3] |
| Survivors unable to return to independent living | 62% | Persons living alone found helpless at home who survived to hospital discharge · San Francisco, California, USA · 12 weeks, March-May 1993 | [3] |
| Lay over an hour after a fall: died within 6 months (Wild 1981, n=20) | 1 in 2 | People aged 65+ who fell in their own homes and were notified by their general practice (biased toward injured/frail fallers, per Tinetti 1993) · Birmingham area, England (six general practices) · Survey of falls at home with 1-year follow-up; accepted 7 Nov 1980, published 24 Jan 1981 | [12] |
| All home fallers 65+: died within a year, 5x matched controls (Wild 1981, n=125) | 25% | People aged 65+ who fell in their own homes and were notified by their general practice (biased toward injured/frail fallers, per Tinetti 1993) · Birmingham area, England (six general practices) · Survey of falls at home with 1-year follow-up; accepted 7 Nov 1980, published 24 Jan 1981 | [12] |
| Lasting decline in daily activities, fallers unable vs able to get up (Tinetti 1993) | 35% vs 26% | Community-dwelling non-injured fallers aged 72+ · New Haven, Connecticut, USA · Mean 21-month follow-up | [69] |
| Over-90s after a long lie: admitted for a fall within the year (Fleming & Brayne 2008, n=20) | 60% | People aged 90+ who lay on the floor >=1 h after at least one fall · Cambridge, United Kingdom · One-year follow-up | [68] |
| Over-90s after a long lie: moved to long-term care within a year (53% by study end) | 36% | People aged 90+ living outside institutions who lay on the floor >=1 h · Cambridge, United Kingdom · One-year follow-up and end of study | [68] |
| In-hospital mortality, severe long-lie ED cohort, median 13.5 h on the ground (Huser 2023, n=50) | 50% | ED patients found after prolonged lying ('Liegetrauma'); median age 76 (range 36-103); 58% male; causes mostly medical (40% primary cerebral, 12% intoxication, 10% domestic trauma) · Cologne, Germany (University Hospital Cologne ED, single centre) · July 2018-December 2020 | [56] |
When the fall broke a hip
- In a multicentre cohort of 1,733 surgically treated osteoporotic hip-fracture patients aged 50+, each additional day between fracture and hospital admission raised one-year mortality risk by 6% (adjusted HR 1.06, 95% CI 1.04-1.08), and admission beyond 4 days doubled it (HR 2.01) (Fu et al., BMC Musculoskeletal Disorders, 2026).[71]
- In 78 geriatric hip-fracture patients at a north Indian tertiary centre (2019-2020), 41% presented more than 48 hours after injury; injury-to-admission time was a risk factor for 30-day mortality (OR 1.22 per day, 95% CI 1.03-1.44), with 30-day mortality 19.2% (Ghosh et al., Cureus, 2023).[72]
- Among 567 hip-fracture patients aged 70+ in a Paris orthogeriatric pathway (2009-2015), 12% developed pressure ulcers, and a pressure ulcer was associated with 2.38 times the risk of death at six months (95% CI 1.31-4.32) (Magny et al., Archives of Osteoporosis, 2017).[73]
- In 19,520 US hip-fracture surgery patients (NSQIP, 2016-2019), 2.7% arrived with a pre-existing pressure ulcer; a preoperative pressure ulcer was independently associated with higher 30-day mortality (OR 1.21, 99% CI 1.02-1.43) and pneumonia (OR 1.39) (Porter et al., JAAOS Global Research & Reviews, 2022).[74]
08 / Alone
How many falls happen when no one else is there?
Half of the 125 home fallers aged 65+ lived alone and one fifth lived with an aged spouse only (Wild, Nayak & Isaacs, BMJ, 1981).[12]
A long lie needs two things: a fall the person cannot get up from, and nobody there to notice. The second condition is the one demography is quietly making more common. In the San Francisco study, family found the person in barely one case in ten, and the rate of being found helpless or dead at home climbed almost tenfold between the early sixties and the mid-eighties.
- Only 11% of people found helpless or dead at home in the San Francisco study were found by family; carers, visiting nurses and home aides (76), friends (41), neighbours (36) and landlords (3) found most others, and calls from landlords were linked to the longest time down (median >72 hours).[3]
- 82% of falls (217 of 265) among people over 90 occurred when the person was alone, over one year of prospective follow-up (Fleming & Brayne, BMJ, 2008).[15]
- Among people aged 65 or older living alone, 31.6 per 1,000 per year were found helpless or dead at home (men 42.2, women 27.6 per 1,000) in San Francisco, 1993 (Gurley et al., NEJM, 1996).[3]
- The annual rate of being found helpless or dead at home rose from 3 per 1,000 people aged 60-64 to 27 per 1,000 aged 85 and over, in San Francisco in 1993 (Gurley et al., NEJM, 1996).[3]
- Among men aged 85 or older living alone, the rate of being found helpless or dead at home was 123 per 1,000 per year (women 85+ living alone: 59 per 1,000) in San Francisco, 1993 (Gurley et al., NEJM, 1996).[3]
How many older adults live alone
In 2022, 28.0% of U.S. adults aged 65 and over (15.7 million of 56.1 million) lived alone - 'nearly 3 in 10' (derived from Census P20-587 Table 2).[75]
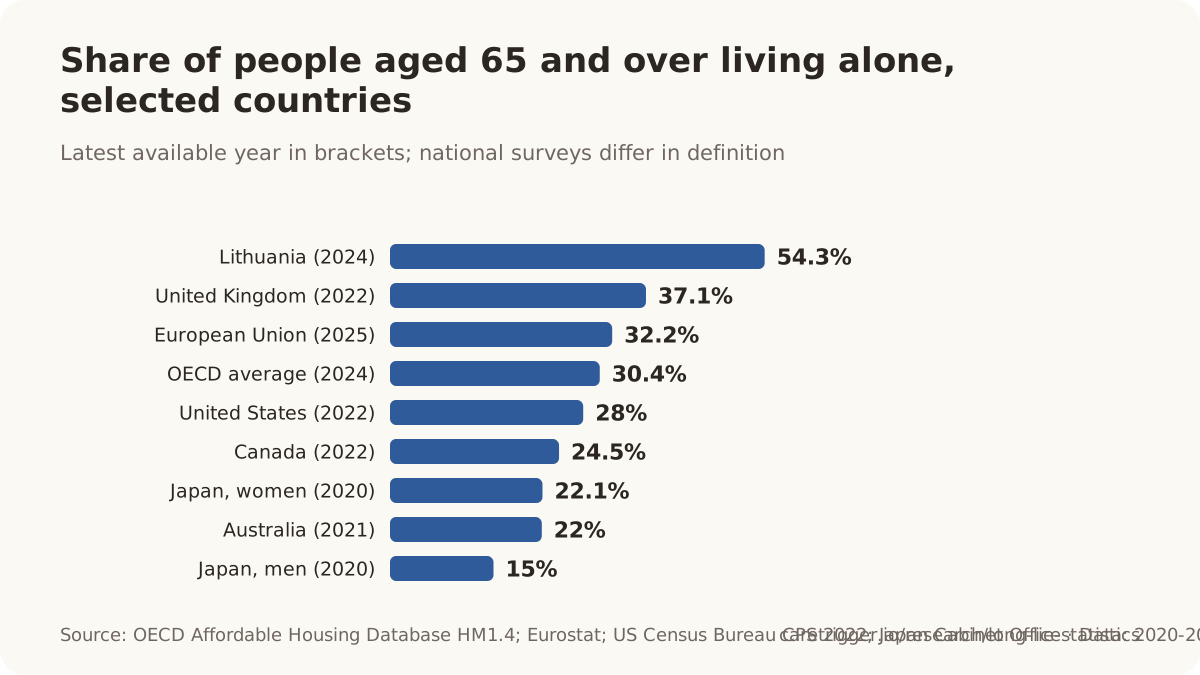
| Geography | Living alone | Scope | Source |
|---|---|---|---|
| Lithuania | 54.3% | people aged 65+ in private households · 2024 | [76] |
| United Kingdom | 37.1% | people aged 65+ in private households · 2022 | [76] |
| European Union (EU-27) | 32.2% | adults aged 65+ in private households · 2025 | [77] |
| OECD (37 countries with data) | 30.4% | people aged 65+ in private households · 2024 or latest available (US 2023, UK 2022, Canada 2022, Australia 2021) | [76] |
| United States | 28% | civilian non-institutionalised adults aged 65+ · 2022 | [75] |
| United States | 26.5% | people aged 65+ in private households · 2023 | [76] |
| Canada | 24.5% | people aged 65+ in private households · 2022 | [76] |
| Australia | 22% | people aged 65+ in private households · 2021 | [76] |
| Japan | 22.1% | people aged 65+ (one-person households) · 2020 (Census) | [78] |
- 43% of U.S. women aged 75 and over lived alone in 2022 (U.S. Census Bureau America Counts, 2024; CPS ASEC).[80]
- In 2019, four in ten EU women aged 65 and over (40%) lived alone, compared with 19% of men (Eurostat news, EU-LFS lfst_hhindws).[81]
- Latvia had the EU's highest share of women aged 65+ living alone in 2019 (49%); Estonia the lowest (26%) (Eurostat news, 2020).[81]
- 4.3 million people aged 65 and over lived alone in the UK in 2024, up from 3.5 million in 2014 (ONS, Families and households in the UK: 2024).[79]
- 3.5 million people aged 65 and over lived alone in the UK in 2014 (ONS, Families and households in the UK: 2024).[79]
- In 2024, 40.9% of UK women aged 65 and over lived alone, versus 27.0% of men (ONS).[79]
- In 2022, 33.3% of U.S. women aged 65 and over (10.15 million) lived alone (U.S. Census Bureau, CPS ASEC 2022, P20-587 Table 2).[75]
- In 2022, 21.8% of U.S. men aged 65 and over (5.58 million) lived alone (U.S. Census Bureau, CPS ASEC 2022, P20-587 Table 2).[75]
- About 27% of U.S. women aged 65 to 74 lived alone in 2022 (U.S. Census Bureau America Counts, 2024; CPS ASEC).[80]
- In 2022, 23.8% of U.S. men aged 75 and over lived alone, versus 42.5% of women (U.S. Census Bureau, P20-587 Table 2).[75]
- 27% of U.S. adults aged 60 and older live alone, versus 16% across 130 countries and territories (Pew Research Center, 2020).[82]
- In 2018, 40.2% of EU-27 women aged 65+ and 21.8% of men lived in single-person households (Eurostat, Ageing Europe 2020 edition, EU-SILC ilc_lvps30).[83]
- 2.6 million Australians lived alone in 2021; between 3.4 and 4.0 million are projected to live alone in 2046 (ABS Household and Family Projections, 2024).[85]
- Between 31% and 35% of Australians aged 85 and over are projected to be living alone in 2046 (ABS Household and Family Projections, 2024).[85]
- Around 87,000 Singapore residents aged 65 and above were living alone in 2024, according to the Ministry of Health's reply to a parliamentary question on preventing seniors from dying alone.[86]
Living alone rises with age
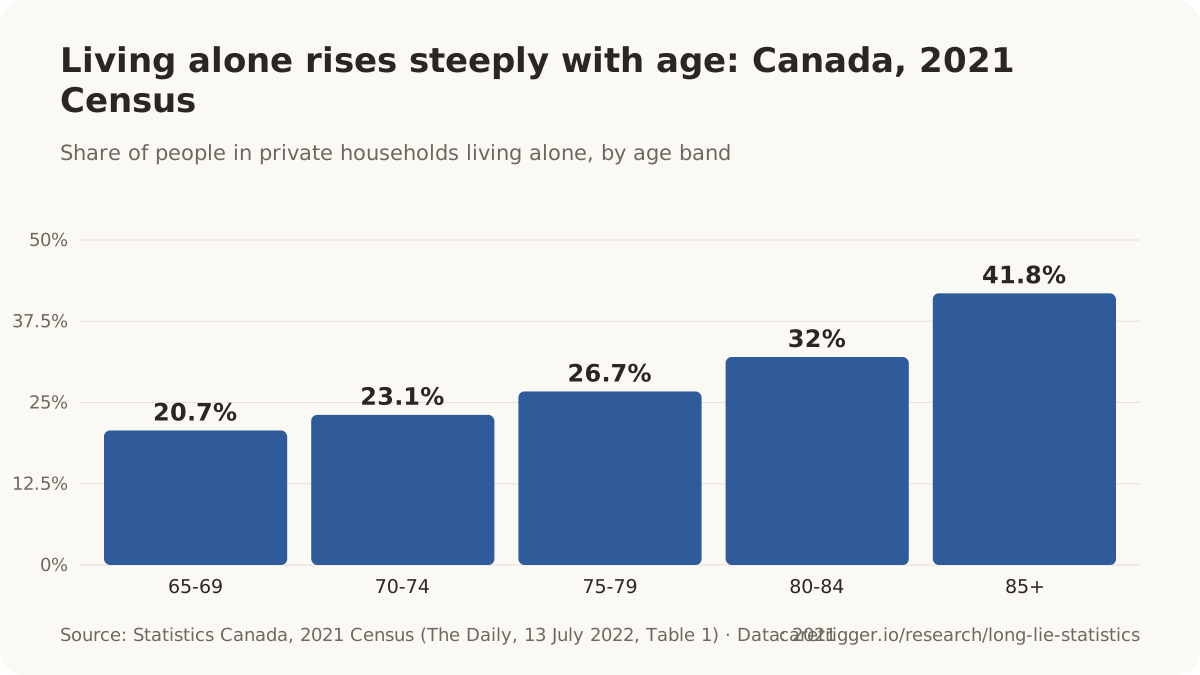
- 53% of Canadian women aged 85 and older in private households lived alone in 2021, down from 60% in 2001 (Statistics Canada, 2021 Census).[87]
- In 2021, 41.8% of Canadians aged 85 and older in private households lived alone - 'two in five' (Statistics Canada, 2021 Census, The Daily Table 1).[88]
- In 2021, 32.0% of Canadians aged 80 to 84 lived alone (Statistics Canada, 2021 Census, The Daily Table 1).[88]
- In 2021, 26.7% of Canadians aged 75 to 79 lived alone (Statistics Canada, 2021 Census, The Daily Table 1).[88]
- In 2021, 23.1% of Canadians aged 70 to 74 lived alone (Statistics Canada, 2021 Census, The Daily Table 1).[88]
- In 2021, 20.7% of Canadians aged 65 to 69 lived alone - 'one in five' (Statistics Canada, 2021 Census, The Daily Table 1).[88]
- 4.4 million people lived alone in Canada in 2021 (15% of adults 15+), up from 1.7 million in 1981 (Statistics Canada, 2021 Census).[87]
The population behind the numbers
- By 2050 the world's population aged 60 and over will double to 2.1 billion; the 80+ population will triple to 426 million (WHO Ageing and health, 2025).[89]
- By the late 2070s the global population aged 65 and older is projected to reach 2.2 billion, surpassing the number of children under 18 (UN DESA, World Population Prospects 2024).[90]
- By 2050 one in six people in the world will be over 65, up from one in 11 in 2019 (UN DESA, World Population Prospects 2019, cited on UN Ageing page).[90]
- By 2030, 1 in 6 people in the world will be aged 60 or over, rising from 1 billion (2020) to 1.4 billion (WHO Ageing and health fact sheet, 2025).[89]
- The U.S. population aged 65 and older reached 61.2 million in 2024, 18.0% of the population, up from 12.4% in 2004 (U.S. Census Bureau, Vintage 2024 estimates).[91]
09 / Ambulance data
How much ambulance work is falls, and how often do crews just help someone up?
In 2024 Wisconsin EMS responded to over 140,000 falls, which made up 21% of 911 ambulance runs with patient contact, per the Wisconsin Department of Health Services EMS and Falls Report (September 2025).[8]
Falls are the largest single cause of injury that emergency medical services respond to: more than three and a half million US 911 responses in a year, more than eight hundred thousand UK calls. A growing share of those calls end with no treatment and no transport: the crew lifts the person off the floor and leaves. These "lift assists" are the closest thing we have to a routine count of people who fell and could not get up, and they are rising far faster than call volumes overall.
- Falls were the leading documented cause of injury in US 911 EMS activations with patient contact in 2024: 3,566,186 events, 52.9% of the 6,741,486 injury events with a recorded cause, per the NEMSIS 2024 National EMS Data Report.[93]
- Over 800,000 calls were made to UK ambulance services in 2024 relating to slips, trips and falls, about 91 an hour, per Freedom of Information responses compiled by Spire Healthcare (11 of 13 services responded in full).[94]
- Among Americans aged 65 and over, falls accounted for 17% of all 911 EMS calls in 2012, and 21% of those fall calls did not result in transport, per CDC analysis of NEMSIS data from 42 states (Faul et al., American Journal of Preventive Medicine 2016).[95]
- In 2021 falls were the leading documented cause of injury in US 911 EMS activations with patient contact: 2,667,567 events, 51.5% of 5,176,176 injury events with a recorded cause, per the NEMSIS 2021 National EMS Data Report.[96]
- Falls account for up to 10% of 999 calls to UK ambulance services, per the Association of Ambulance Chief Executives on launching the National Falls Governance Framework (October 2025).[97]
- Falls account for 8% of 999 calls with over 50,000 on-scene ambulance responses a year in the Yorkshire and Humber ambulance region, per the NIHR-funded Long Lies study protocol (Kuczawski et al., February 2026).[6]
- In 2017/18 the Welsh Ambulance Service received over 62,000 calls relating to falls, half of which resulted in a journey to hospital, and fallers account for over 10% of its emergency calls, per a Welsh Government ministerial written statement (April 2019).[99]
- The Scottish Ambulance Service attended 41,875 falls incidents involving people aged 65 and over in calendar 2024, out of 322,442 incidents attended for that age group, per its FOI response 25-168 (May 2025).[100]
- Ambulance Victoria attended 324,060 falls patients aged 65+ between 2010 and 2017, 9.7% of its attended workload, with 78.8% transported to hospital and only 3.8% receiving a lights-and-sirens transport, per Cox et al., Injury 2018.[101]
- There were 314,041 occasions of fall-related ambulance use by NSW residents aged 65+ between 2006 and 2013, with rates continuing to increase over time, per Paul et al., Public Health Research & Practice 2017.[102]
- The Ambulance Service of New South Wales responded 42,331 times to people aged 65+ who had fallen in 2008/09, 5.1% of total emergency workload, with 76% transported (median age 83), per Simpson et al., Australasian Journal on Ageing 2013.[103]
- Queensland Ambulance Service falls attendances at 54 regional residential aged-care facilities rose from 1,916 in 2021 to 2,528 in 2023 (6,663 attendances for 3,545 residents; 88% transported), per Hughes et al., Australasian Journal on Ageing 2026.[104]
- Falls caused more than 53,700 Hato Hone St John ambulance callouts in New Zealand in the latest year, about 12% of total workload, with a median patient age of 81 and over two-thirds aged 75+, per the Hato Hone St John falls-prevention release (April 2026).[105]
- Hato Hone St John attends approximately 34,000 fall-related incidents nationwide each year and processed 3,970 fall-prevention referrals in 2021, per Reid, Williams & Leonard, New Zealand Medical Journal 2026 (citing Safety Collective Tamaki Makaurau Auckland 2024).[106]
| Service and measure | Share | Scope | Source |
|---|---|---|---|
| Wisconsin, 911 ambulance runs with patient contact (2024) | 21% | 911 ambulance runs reported to WARDS with patient contact · Wisconsin, USA · calendar 2024 | [8] |
| United States, 911 EMS calls for people 65+ (NEMSIS 2012) | 17% | 911 EMS call events, patients aged 65+ · United States (42 states reporting to NEMSIS) · 2012 | [95] |
| Scotland, incidents attended for people 65+ (2024, derived) | 13% | People aged 65+ attended by the Scottish Ambulance Service · Scotland · calendar year 2024 | [100] |
| New Zealand, St John ambulance workload (2025/26) | 12% | All Hato Hone St John ambulance callouts · New Zealand · 'last year' relative to 1 April 2026 (i.e., 2025 or 2024/25) | [105] |
| United Kingdom, 999 calls (AACE, 2025) | up to 10% | All 999 ambulance calls · United Kingdom · 2025 (as stated) | [97] |
| Emergency ambulance calls for adults 65+ who have fallen (Gunson 2025, Age and Ageing) | ~10% | Adults 65+ who have fallen and are attended by ambulance (9 studies) · United Kingdom/international (systematic review in Age and Ageing) · Published August 2025 | [98] |
| Victoria, Australia, attended workload: falls in people 65+ (2010-2017) | 9.7% | Falls patients aged 65+ attended by Ambulance Victoria · Victoria, Australia · 2010-2017 | [101] |
| Yorkshire and Humber, 999 calls (YAS 2023) | 8% | 999 ambulance calls · England (Yorkshire & Humber / Yorkshire Ambulance Service region, as framed by the protocol) · circa 2024-2026 (protocol background) | [6] |
| Period | Incidents | Scope | Source |
|---|---|---|---|
| calendar year 2022 | 42,206 falls incidents attended, patients aged 65+ | People aged 65+ attended by the Scottish Ambulance Service in the 'Falls' category · Scotland | [100] |
| calendar year 2023 | 44,053 falls incidents attended, patients aged 65+ | People aged 65+ attended in the 'Falls' category · Scotland | [100] |
| calendar year 2024 | 41,875 falls incidents attended, patients aged 65+ | People aged 65+ attended in the 'Falls' category · Scotland | [100] |
Lift assists: found on the floor, not taken to hospital
About 42.8% of Falls Protocol 911 calls across three US agencies were lift assists (6,701 of 15,666), derived from the Annals of Emergency Dispatch & Response (2020).[108]
- In Maplewood, Minnesota, EMS fall calls for people aged 60+ rose 268% between 2007 and 2017, lift assists nearly doubled, and non-transport fall calls cost the community an estimated US$1.5 million over the decade at about US$825 per untreated run, per Quatman et al., Geriatric Orthopaedic Surgery & Rehabilitation 2018.[109]
- Non-transport (lift-assist and similar) EMS runs for falls at private residences in Wisconsin have risen by 16,000 a year since 2018, an 86% increase, and at nursing homes by 2,933 a year (285%), per the Wisconsin DHS EMS and Falls Report (September 2025).[8]
- Colorado Springs Fire Department lift-assist calls rose from 1,567 in 2020 to 3,051 in 2025, roughly doubling in five years, per CSFD figures reported by KOAA News5.[110]
- Decatur (Illinois) Fire Department lift-assist calls grew from 430 in 2014 to more than 1,000 in 2023; after a $500 fee for non-medical lift assists at care facilities, such calls fell about 60% against the prior two-year average, per EMS1 (April 2025).[111]
- Chattanooga Fire Department non-emergency 'citizen assist' calls (including lift assists) rose from 435 in 2013 to 1,320 in 2018, a more than 300% increase, per the Chattanooga Times Free Press via FireRescue1 (May 2019).[112]
- Lift-assist 911 responses to assisted living and other senior-care settings in the US rose 30% between 2019 and 2022, three times the growth in overall 911 volume, and in Illinois lift assists were 1 in 20 of all fire-department 911 calls, per a Washington Post analysis reported by Senior Housing News (May 2024).[113]
- Wisconsin EMS responded to 35,564 more falls in 2024 than in 2019, an average rise of 6.1% a year (nearly 10,000 extra falls a year), per the Wisconsin DHS EMS and Falls Report (September 2025).[8]
- In a suburban US fire-based EMS system, 1,087 lift-assist responses made up 4.8% of all EMS incidents from 2004 to 2009, and two-thirds of them went to one-third of the 535 addresses involved, per Cone et al., Prehospital Emergency Care 2013.[114]
- After a lift-assist call, 563 return EMS visits to the same address occurred within 30 days; where patients could be matched, 47.3% were for medical complaints and 55.5% ended in hospital transport, per Cone et al., Prehospital Emergency Care 2013.[114]
- In London, Ontario in 2013, 804 of 42,055 EMS calls (1.9%) were lift assists for 414 people; within 14 days 21% had an emergency department visit, 11.6% a hospital admission and 1.1% died, per Leggatt et al., Prehospital Emergency Care 2017.[115]
- Middlesex-London EMS handled 1,121 lift-assist calls for 611 people aged 65+ in 2015; 32% called more than once, calls averaged 43 minutes (6 minutes to 2 hours 23 minutes), and paramedics spent 801 hours (33 full days) solely on older-adult lift assists, per Schierholtz et al., Prehospital Emergency Care 2019.[116]
- In a suburban Midwest fire-based EMS agency (2008-2017), 1,169 of 21,760 calls (5.4%) were older-adult falls, and lift assists were transported only 7% of the time versus 78% for falls, per Archives of Gerontology and Geriatrics Plus (2024).[117]
- In the Newcastle study, 165 of 1,504 falls attended in people over 65 (11%) required assistance only, with no conveyance to A&E, per Newton et al., Emergency Medicine Journal 2006.[118]
- Across 12 studies, non-transport rates for older people attended by ambulance after a fall ranged from 11% to 56%, and up to 49% of non-transported fallers had unplanned health-care contact within 28 days, per a systematic review by Mikolaizak et al., Australasian Journal on Ageing 2013.[119]
The same people call again
A 2023 scoping review reports that 78.8% of older fallers who had a long lie later re-contacted the ambulance service, versus 60.6% of fallers without a long lie, citing Simpson et al. 2014 (Kubitza et al., European Review of Aging and Physical Activity, 2023).[120]
- Among patients who refused EMS transport after a fall in Camden County, New Jersey (July 2021-July 2022), 37.9% were repeat callers and 21.8% 'super-users', with repeat callers having 17-fold higher odds of a 30-day ED visit, per Barr et al., Western Journal of Emergency Medicine 2025.[121]
- In one US urban EMS service (year to October 2024), 433 of 7,329 geriatric calls were refusals of transport after a fall; 32.8% of those patients had a repeat EMS call in the same month, 71.1% of whom were transported and 65.9% of those admitted, per Moore et al., American Journal of Emergency Medicine 2025.[122]
- 32% of older adults who received a Middlesex-London EMS lift assist in 2015 called more than once that year, per Schierholtz et al., Prehospital Emergency Care 2019.[116]
- Over ten years in one suburban US community, 11% of 37,324 EMS calls were fall-related calls for people aged 60+, 29% of those fallers called again, and the 15% who called five or more times were transported only 21% of the time versus 75% for first-time callers, per Quatman et al., Journal of the American Geriatrics Society 2018.[123]
- In a suburban US EMS system with about 120,000 dispatches a year, most repeat EMS encounters after a non-transported lift assist in patients aged 60+ occurred within 72 hours, 76% resulted in transport and 61% had a medical cause, per Dorsett et al., Prehospital Emergency Care (2026; 2022 data).[124]
- Of 1,079 falls attended by the Northern Ireland Ambulance Service in people aged 65+ over three months in 2017, 7% were referred to a falls prevention service; of those, 37.3% re-contacted the ambulance service within a month and 70.7% within six months, per Scott, British Paramedic Journal 2020.[125]
- Among older fallers attended by Ambulance Victoria, 13.2% had a repeat fall attendance within 12 months, with a median of 98 days between the first and second fall, per Cox et al., Injury 2018.[101]
What services are doing about it
- After 600 Welsh care homes received lifting cushions and the ISTUMBLE assessment app in 2018, falls needing an ambulance fell from 379 to 75 (an 80% reduction) and 87% of falls were managed in-house, per NHS England's falls-response guidance (2022).[126]
- In the Welsh Ambulance Service Falls Assistants pilot (Oct 2018-Mar 2019), 65% of 1,776 fallers attended did not need to attend hospital and the average response was 24 minutes after allocation, per the Welsh Government (April 2019).[99]
- East of England Ambulance Service Community Wellbeing Officers helped 443 people who had fallen between November 2023 and September 2024, with 40% discharged without further ambulance attendance, per EEAST (September 2024).[127]
- About 6,000 Community First Responders in England responded to 236,000 incidents in 2021/22, and most ambulance trusts already use them for falls, per NHS England's community-based falls response guidance (October 2022).[126]
- A multifactorial fall-prevention intervention delivered by community EMS clinicians would save US$964 per patient over one year versus no intervention and remain cost-saving up to a programme cost of $1,634 per patient, per a decision-tree model in Injury Prevention (Ordoobadi et al., 2025).[128]
10 / Alarms and detection
Do pendant alarms and fall detectors prevent long lies?
After falls, the PERS was not activated by 83% of subscribers who fell alone and lay on the floor for more than 5 minutes.[129]
The uncomfortable finding, in every study that has looked, is not that alarms are missing. They are within reach in almost every fall. They are not pressed: because the person is confused, cannot reach the pendant, is not wearing it, or does not want to be a bother. When an alarm is pressed, a long lie almost never follows. The gap between "having" and "using" is where most of the long-lie problem lives, and it starts with wearing: fewer than one in five alert users say they wear the device at all times.
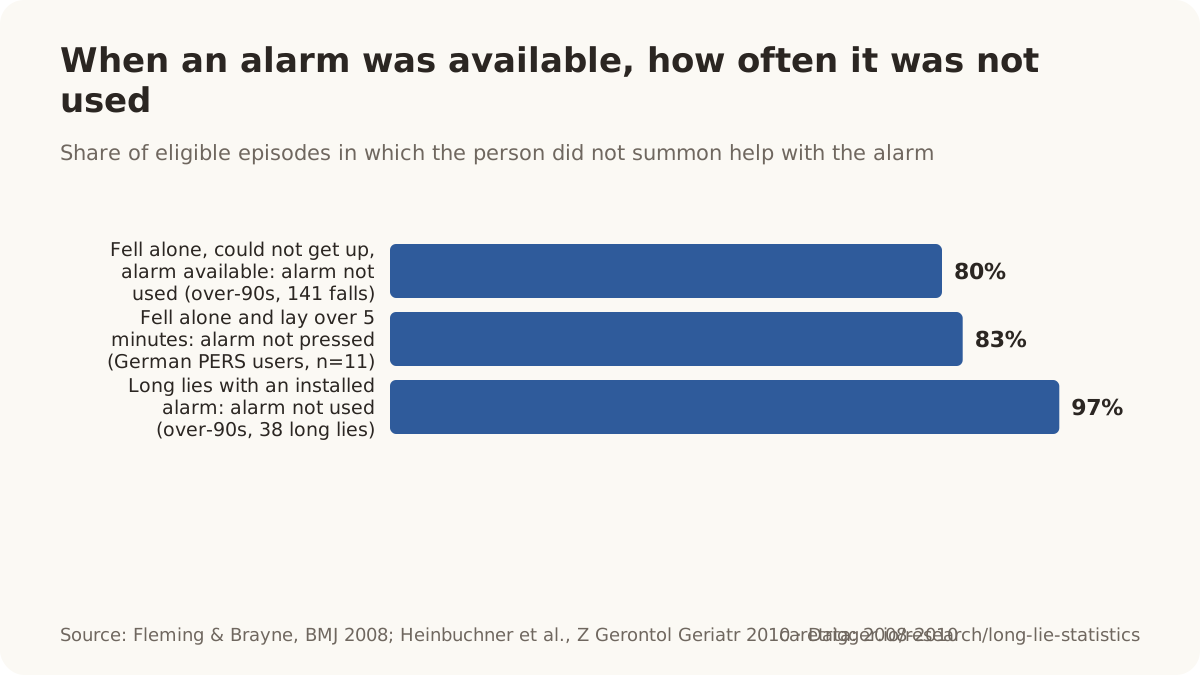
- In 97% of 'long lies' (an hour or more on the floor) that occurred despite an installed alarm, the person who fell alone did not use their alarm to summon help.[15]
- In 80% of falls in which a person aged over 90 fell alone, could not get up, and had a call alarm available, the alarm was not used to summon help.[15]
- Some form of call alarm was available in 99% of falls in which a person over 90 fell alone and could not get up.[15]
- When a call alarm was activated after a fall alone by someone unable to rise, lying on the floor for an hour or more occurred in only one, or perhaps two, of 28 such falls.[15]
- Only one of the 367 people found helpless or dead at home in the San Francisco study possessed a commercially available device to summon help (Gurley et al., NEJM, 1996).[3]
- Only 18% of current medical-alert users say they wear or carry their device at all times (industry survey).[130]
- 64% of medical-alert users report not wearing the device in the shower (industry survey).[130]
- 24% of community-dwelling PERS subscribers reported that they never wear the alarm button.[129]
- Only 14% of PERS subscribers wear the alarm button 24 hours a day.[129]
- Two of the 33 reviewed PERS studies found that about 25% of respondents never wore the pendant.[131]
- In a six-month pilot of older adults at risk of falls given a PERS pendant, the median share of days the pendant was worn was 68.0% (IQR 56.1-84.4%).[132]
- In institutional (care-home) settings, 94% of falls where the person was alone, could not get up and had an alarm did not involve alarm use.[15]
- Among people over 90 living in the community (own homes), 78% of falls where the person was alone, could not get up and had an alarm did not involve alarm use.[15]
- Only 10 of 125 home fallers had an alarm system; of nine with a call system, two used it successfully, one tried and failed and six made no attempt; no faller used the telephone after falling (Wild, Nayak & Isaacs, BMJ, 1981).[12]
- Of 31 older people interviewed after calling an ambulance following a fall, 20 owned a personal alarm; the study identified a group who owned an alarm but did not use it effectively.[133]
- In a 12-month prospective cohort of 295 community-dwelling older adults, outcomes after an emergency were similar for personal-alarm purchasers and non-purchasers, with no difference in time spent on the floor or hospitalisations.[134]
- An integrative review of research on personal emergency response systems from the users' perspective identified 33 peer-reviewed studies published 1987-2014.[131]
How reliable is automatic fall detection?
A pendant-worn automatic fall-detection device detected 17 of 89 falls recorded by nursing-home staff (sensitivity 19%) over six months.[135]
- In a real-world trial of a wearable automatic fall-detection device with community-dwelling older adults, 83 of 84 fall alarms recorded were false alarms.[136]
- Only one genuine fall was automatically detected; three further falls occurred while the device was worn but were not identified as falls.[136]
- Of 128 fall events the automatic fall-detection pendant recorded, 111 (87%) were false positives.[135]
- Apple Watch Series 5 Fall Detection recognised only 14 of 300 intentional falls from a wheelchair by able-bodied young adults (sensitivity 4.7%).[137]
- Thirteen published accelerometer fall-detection algorithms re-tested on 29 real-world falls achieved an average sensitivity of only 57.0% (SD 27.3; best 82.8%).[138]
- During one day of monitoring three representative fallers, the number of false alarms generated by the 13 fall-detection algorithms ranged from 3 to 85.[138]
- Of 57 wearable fall-detection projects in a systematic review, only 7.1% reported monitoring older adults in a real-world setting.[139]
- A threshold-based smartwatch fall-detection app detected 77% of 226 induced falls (specificity 99%) in healthy adults aged 18-52.[140]
- One early PERS service evaluation cited in the review found that 40% of all alarm calls were false alarms.[131]
- Apple states that Apple Watch cannot detect all falls, and that high-impact activity can trigger Fall Detection in error.[141]
- Lifeline (formerly Philips Lifeline) states that its AutoAlert fall detection does not detect 100% of falls and that users should press their button when they need help.[142]
- Apple Watch Fall Detection is turned on automatically for users aged 55 and over (if their age is set up in Medical ID / Health Profile).[141]
- If Apple Watch senses immobility for 60 seconds after a fall notification, it automatically calls emergency services.[143]
What older adults actually have
9% of US adults aged 65+ currently use a medical alert system / PERS, unchanged from the same survey in 2023 (industry online-panel survey).[130]
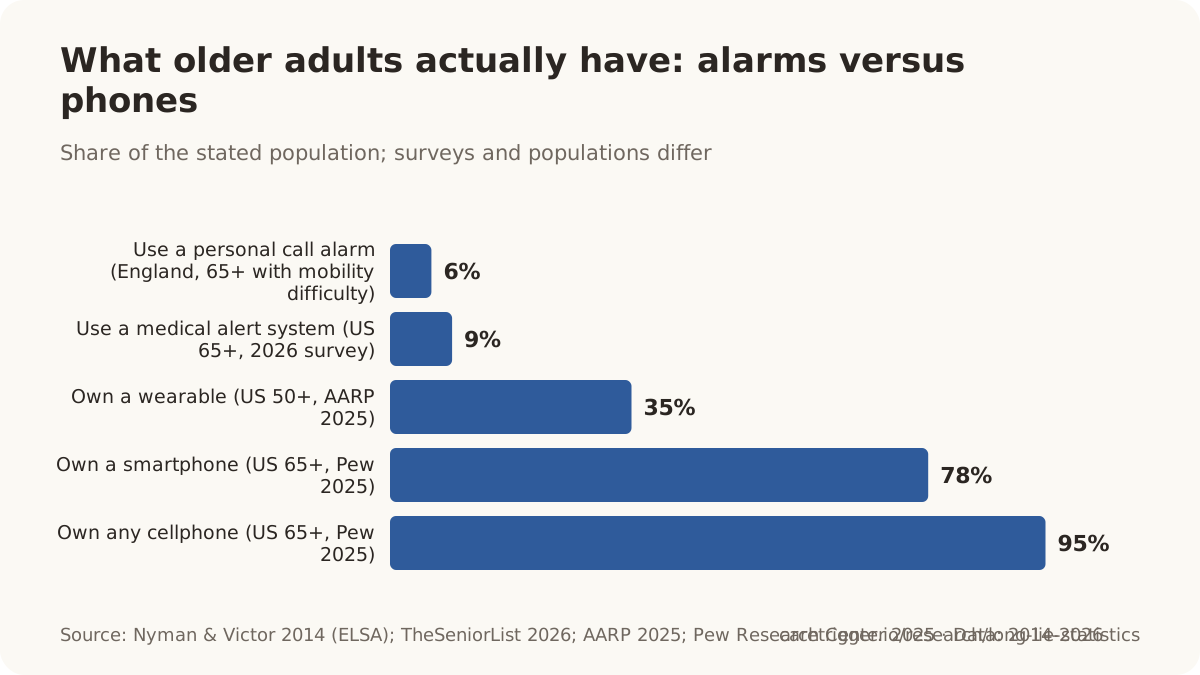
- 95% of US adults aged 65 and older own a cellphone of any kind (2025).[144]
- 78% of US adults aged 65 and older own a smartphone (2025).[144]
- Only 6% of community-dwelling adults aged 65+ with mobility or daily-living difficulties in England reported using a personal call alarm.[7]
- Among US adults 50+ who have provided caregiving, 12% currently use an emergency response system (physically or voice-activated) for the person they care for; 36% are interested.[145]
- In 2025, 12% of Medicare Advantage enrollees were in plans offering a personal emergency response system (PERS) benefit, up from 7% in 2018.[146]
- 35% of US adults aged 50+ own a wearable device (2025), up from 11% in 2016; wearables are the one device category still owned more by adults 18-49.[145]
- 36% of US Baby Boomers (ages 65-74) own a smartwatch or connected health device (2024), versus 66% of Millennials.[147]
- 90% of US adults aged 50+ own a smartphone in 2025, up from 55% in 2016.[148]
11 / Found too late
How many people are found too late?
In 2025, 76,941 people in Japan who lived alone died at home and were handled by police — 37.6% of 204,562 police-handled bodies, up from 76,020 in 2024.[2]
No country counts long lies directly. The closest official series are the counts of people who lived alone and died at home, published by Japan's National Police Agency and South Korea's welfare ministry, and the forensic studies of bodies found days or weeks after death in European and American cities. These are deaths from any cause, so they bound the "nobody noticed" problem rather than measure falls. They are also the only numbers of their kind, and they show how long discovery can take: in Japan, more than seven thousand people in a single year were not found for a month or more.
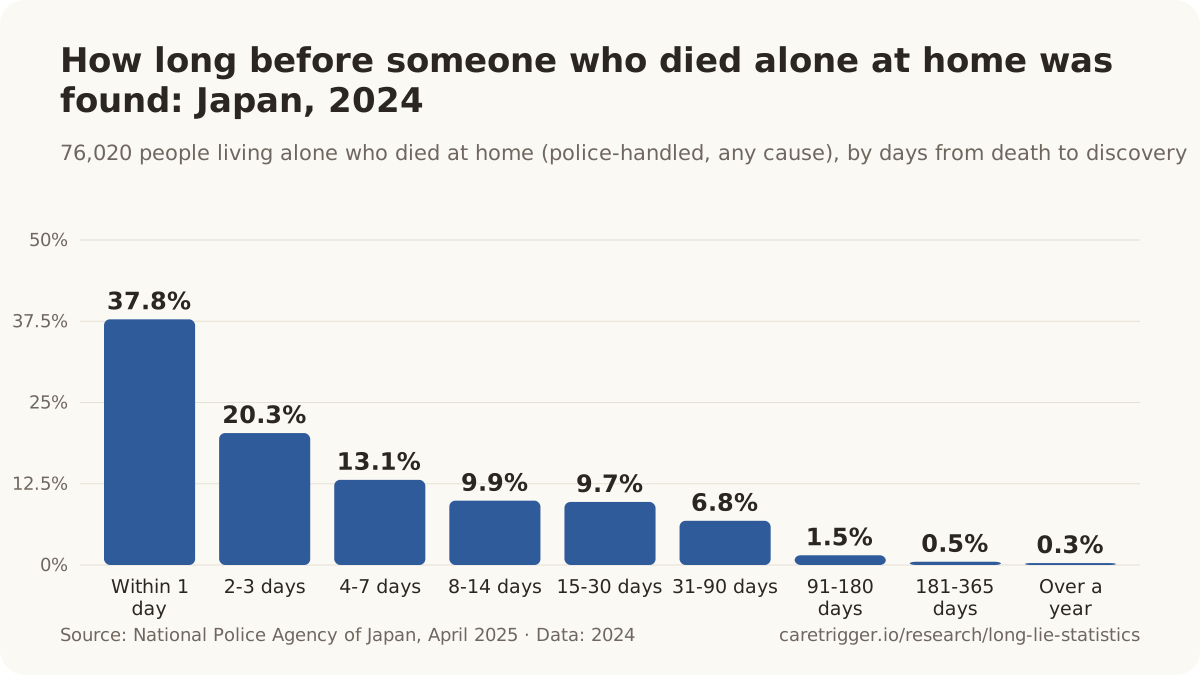
- Of 58,044 people aged 65+ who lived alone and were found dead at home in Japan in 2024, 22,734 (39.2%) were found within one day of death, while 4,538 (7.8%) were not found for more than 30 days (National Police Agency of Japan, 2025).[151]
South Korea's lonely deaths
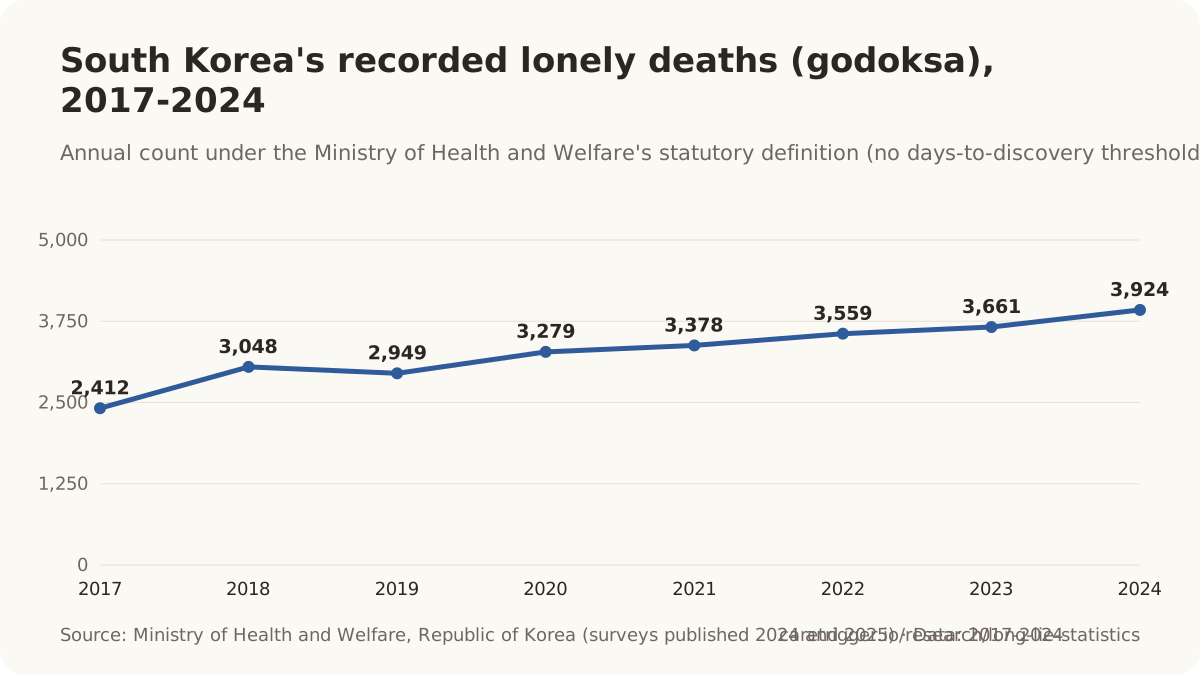
South Korea's lonely deaths rose 7.2% to 3,924 in 2024 (from 3,661 in 2023) — 1.09% of all deaths and 7.7 per 100,000 population.[159]
- In South Korea in 2024, lonely-death bodies were most often found by a landlord, security guard or building manager (43.1%), then family (26.6%), neighbours (12.0%) and health/welfare workers (7.7%); in 2023 the shares were 34.5%, 26.2%, 19.3% and 7.0%.[159]
- South Korea recorded 3,661 'lonely deaths' (고독사) in 2023, up from 3,559 in 2022 and 2,412 in 2017; they equalled 1.04 of every 100 deaths in 2023.[160]
- South Korea's statutory definition of a lonely death: 'a person who lived in social isolation, cut off from family, relatives and others around them, dying by suicide, illness or other cause' — with no minimum days-to-discovery.[159]
Forensic and public-health signals elsewhere
- San Francisco paramedics identified 387 events in which 367 people were found helpless or dead in their homes over 12 weeks (Gurley et al., NEJM, 1996).[3]
- At a central London mortuary, markedly decomposed bodies among coronial autopsies rose 70.5% in the year after the first UK lockdown (23 March 2020) versus the year before, alongside a 38% rise in home deaths and a 52.4% fall in hospital deaths coming to autopsy.[161]
- In Amsterdam, bodies lying unnoticed at home for two weeks or more occurred at 5.3 per 100,000 person-years (379 cases) versus 1.4 per 100,000 in surrounding municipalities (58 cases); all but three of the 437 people lived alone, and among people living alone the rate was 2.7 times higher in the city.[162]
- Of 88 decomposed bodies from non-traumatic in-home deaths of older people examined in Turkey, 85.2% had lived alone, 83.0% were men and the mean age was 70.9.[164]
- In England and Wales, age-standardised rates of deaths coded R98/R99 ('unattended' / 'ill-defined and unknown cause' — a proxy for bodies found too decomposed to ascertain cause) rose from 1979 to 2020 while all other mortality fell; by the 2000s the male rate was more than double the female rate.[165]
- Across the four largest Dutch cities, the incidence of single-household bodies found 14+ days after death was similar in Amsterdam, The Hague and Rotterdam and almost twice that of Utrecht (IRR 1.9, 95% CI 1.1-3.0).[166]
- In eastern Attica (Greece), 217 decomposing bodies were found indoors over 2012-2021; the typical case was a Greek man over 65, single, childless and living alone, found by relatives or neighbours within a month of death, with a natural cause.[167]
- In Vienna, 320 people were found decomposed or mummified at home in 1993-1997 (versus 412 in 1963-1967), with a significantly higher share aged over 64 in the 1990s and a suicide rate nearly three times higher.[168]
- A review of 1,714 decomposition cases at the Allegheny County (Pittsburgh) Medical Examiner's Office over 2007-2016 found reported post-mortem intervals ranging from 1 to 2,920 days, with 'last known social contact' the main basis for the interval in 82% of US cases.[169]
12 / Cost
What does a long lie cost?
The estimated average cost of care for each person found helpless at home was $9,985 (70% of 1993 charges for paramedic, hospital and ICU days) in San Francisco (Gurley et al., NEJM, 1996).[3]
The only per-patient cost of being found helpless at home is three decades old and in 1993 dollars; nobody has repeated it. What exists instead are the national cost of falls as a whole, which sets the scale, and the unit costs of the ambulance response.
- Medical costs attributable to fatal and nonfatal falls among U.S. adults 65+ were approximately $50.0 billion in 2015 (Florence et al., J Am Geriatr Soc, 2018).[170]
- Falls in people aged 65 and over have an estimated cost to the NHS of GBP 2.3 billion per year (NICE impact report, 2018; figure originates in NICE CG161, 2013).[17]
- The direct cost of fall-related injuries among Canadians aged 65+ was estimated at CAD 5.6 billion in 2018 (PHAC, 2025).[4]
- Hip fractures alone account for 1.8 million hospital bed days and GBP 1.1 billion in hospital costs every year in the UK; fragility fractures cost GBP 4.4 billion (OHID, 2022).[19]
- Medical spending for fatal falls among U.S. adults 65+ was an estimated $754 million in 2015 (Florence et al., 2018).[170]
- The total cost of an EMS run that did not result in treatment (e.g., a lift assist) was approximately US$825 in Maplewood, Minnesota, per Quatman et al., Geriatric Orthopaedic Surgery & Rehabilitation 2018.[109]
- NHS England's falls-response guidance costs an ambulance call-out at £252, so 92 avoided call-outs in a six-week care-home lifting-equipment pilot in Mid and South Essex saved £23,184 (October 2022).[126]
- Attending fallers in the community cost the North East Ambulance Service £145.83 per fall and £376,018 a year in Newcastle (based on 1,504 falls in people over 65 across 7 months), per Newton et al., Emergency Medicine Journal 2006.[118]
13 / What's coming
What will the NIHR Long Lies Study add?
The Long Lies study expects about 16,000 documented long lies among roughly 115,000 Yorkshire Ambulance Service fall calls (April 2019-March 2023), per the NIHR study protocol (2026).[6]
The largest study of long lies ever attempted is under way at the University of Sheffield, funded by the UK's National Institute for Health and Care Research. It links four years of Yorkshire Ambulance Service fall records to hospital and death data, which will give the first population-scale estimate of how many long lies occur, how long they last, and what happens afterwards. Results are expected from late 2026. We will add them here when they are published.
- Around one in five falls among adults over 65 results in a long lie of over one hour on the floor, per the University of Sheffield CURE Long Lies Study page (NIHR158676).[171]
- 30% of people over 65 and 50% of those over 80 experience at least one fall annually (UK framing cited to NICE CG161 and Rubenstein 2006 in Kuczawski et al., NIHR Open Research, 2026).[6]
- Among over-90-year-olds, 58% were reported to have fallen in the previous year and 60% fell during 1-year prospective follow-up, at a prospectively measured rate of 2.8 falls per person-year (Fleming et al., BMC Geriatrics, 2008).[172]
14 / Data
Download the dataset
Every statistic on this page, with its verbatim source quote, locator, population, period and verification status, in one file. Each chart's CSV is linked under the chart.
Download all statistics (CSV) Download all statistics (JSON)
Charts and figures on this page may be reused with a link to https://caretrigger.io/research/long-lie-statistics as the source. Each chart's CSV is published next to it.
15 / Methodology
Methodology
What we included. Published figures about older adults who fall and cannot get up, the time they spend on the floor, the clinical consequences, the ambulance response, alarm use, and the official and forensic counts of people found too late. Primary studies, official statistics and peer-reviewed reviews are preferred; industry surveys and news reports are included only where no better source exists and are labelled as such in the dataset.
How each figure was verified. Every record carries the exact sentence or table cell from the source (quote) and where it sits (locator). A researcher confirmed each one against the source document; a script then re-fetched every source on the date shown at the top of the page, using publisher APIs and PDF text where the web page blocks automated access, and checked for the quote. Records the script could not confirm are kept only if the researcher's check was complete, and are marked for human review in the dataset. Restatements (a later paper quoting an earlier one) are recorded as restatements, with the primary figure alongside.
What we excluded. Figures we could not trace to a document, figures whose source page no longer exists, and two widely repeated marketing claims described in the duration section. Where a source gives a figure only in a form we could not confirm (for example, a chart with no data table), the record is marked unverified and is not exported.
Rounding and derivation. Numbers are reproduced as published. The few derived figures (a percentage computed from two published counts) say so in the statement and name both inputs. The bold figure in each statement is a reading aid, not an edit.
Updates. Sources are re-checked and new figures added quarterly; the next scheduled refresh is January 2027. Corrections are welcome through the support page.
Cite this page
CareTrigger. "Statistics on Falls Among Older Adults, the Long Lie, and What Happens Next." https://caretrigger.io/research/long-lie-statistics. Last updated 2026-10-08.
16 / FAQ
Frequently asked questions
What is a long lie after a fall?
A long lie is when someone falls, cannot get up, and remains on the floor for an hour or more. The one-hour threshold comes from the 1981 Birmingham general-practice study that first used the term, and it is the definition used in the standard geriatrics textbook and in the UK's NIHR Long Lies Study. Some researchers use shorter cut-offs (five, ten or fifteen minutes), so check the definition before comparing figures.[6][13][12][11]
How common are long lies among older adults?
It depends on who is counted. The UK's NIHR Long Lies Study uses the working figure of one in five adults over 65 who fall. Among ambulance-attended fallers aged 65+ in Australia the share was 13%; among community-living people in their seventies only 3% of non-injurious falls lasted over an hour; and in the one year-long study that timed every fall, in people over 90, 30% of those who fell lay on the floor for an hour or more at least once.[6][36][5][15]
How long do people lie on the floor after a fall?
There is no single average, and we could not trace any published source for the widely repeated claim that the average long lie lasts more than twelve hours. In the Cambridge over-90s study, when a person fell alone and could not get up, help arrived within five minutes in 17% of falls, within an hour in 65%, and 18% waited more than two hours. Among community fallers in their seventies who could not get up, the mean time on the floor was under twelve minutes. For people living alone who were found helpless at home from any cause, the median time down was 4.5 hours.[15][5][3]
What are the dangers of lying on the floor for a long time?
Dehydration, pressure injuries, muscle breakdown (rhabdomyolysis) that can damage the kidneys, hypothermia, pneumonia and a lasting fear of falling. In a German emergency-department series of people who had been on the ground for a median of 13.5 hours, two thirds were dehydrated and half had an infection. Pressure damage to deep tissue is estimated to begin between one and six hours of unrelieved loading.[56][57][58]
What percentage of people die after a long lie?
In the original 1981 study, half of the older people who lay on the floor for more than an hour after a fall at home died within six months. In a San Francisco study of people living alone who were found helpless at home from any cause, death rates rose from 12% when the person was found within an hour to 67% when they had been down for more than 72 hours. Fallers who could not get up were also twice as likely to die within a year as fallers who could.[12][3][5]
Do medical alert buttons prevent long lies?
Only when they are worn and pressed, and the evidence says that is the exception. In a German study of alarm subscribers, 83% of those who fell alone and lay for more than five minutes did not activate their device; in England, only 6% of older adults with mobility difficulties use a call alarm at all. In the Cambridge study that timed every fall, an alarm was available in 99% of falls where the person was alone and could not get up, yet it was not used in 80% of those falls, and in 97% of the long lies. When the alarm was activated, a long lie almost never followed.[129][7][15][15][15][15]
How many older adults live alone?
About 28% of Americans aged 65 and over lived alone in 2022 (15.7 million people), 32% of EU residents 65+ in 2025, and 4.3 million people 65+ in the UK in 2024. The share rises steeply with age: in Canada it goes from one in five at ages 65 to 69 to more than two in five at 85 and over.[75][77][79][88][88]
Which sources should I cite for long lie statistics?
Four primary studies carry most of the field: Wild, Nayak and Isaacs (BMJ, 1981) for the one-hour definition and six-month mortality; Tinetti, Liu and Claus (JAMA, 1993) for how many fallers cannot get up; Fleming and Brayne (BMJ, 2008) for time on the floor and alarm use in the over-90s; and Gurley and colleagues (NEJM, 1996) for mortality by time spent helpless. Every figure on this page links to the exact source and carries a verbatim quote in the downloadable dataset.[12][5][15][3]
17 / Sources
Sources
Numbered in order of first appearance. Each entry lists the record ids it supports; the dataset carries the verbatim quote for each.
- [1]CDC WISQARS. 10 Leading Causes of Injury Deaths, United States, 2024, Both sexes, All ages, All races (PDF). Accessed 2026-10-08.Used for: us-fall-deaths-2024
- [2]National Police Agency of Japan. 令和7年中における死体取扱状況(警察取扱死体のうち、自宅において死亡した一人暮らしの者)について (NPA). Published 2026-04. Accessed 2026-10-08.Used for: jp-npa-2025-died-alone-at-home-total
- [3]New England Journal of Medicine (Massachusetts Medical Society). Persons found in their homes helpless or dead. Published 1996-06-27. Accessed 2026-10-08. (paywalled)Used for: gurley-1996-mortality-helpless-over-72h, gurley-1996-median-time-incapacitated, gurley-1996-helpless-over-3-days-10pct-38pct-survived, us-sf-1993-time-helpless-among-found-dead, gurley-1996-dehydration-42-of-261, gurley-1996-mortality-by-time-helpless, gurley-1996-not-independent-62pct, gurley-1996-two-thirds-hospitalized-died-or-dependent, gurley-1996-total-mortality-28pct, gurley-1996-admitted-62pct, gurley-1996-icu-52pct, gurley-1996-in-hospital-mortality-10pct, gurley-1996-discharged-to-institutions-77pct, gurley-1996-mortality-helpless-under-1h, us-sf-1993-who-found-them, gurley-1996-incidence-65plus-living-alone, gurley-1996-incidence-by-age, gurley-1996-incidence-men-85-living-alone, gurley-1996-only-one-had-alarm-device, us-sf-1993-found-helpless-or-dead-share-found-dead, gurley-1996-events-in-12-weeks, gurley-1996-cost-per-patient-9985
- [4]Public Health Agency of Canada (Health Infobase). Falls among older adults in Canada (data blog). Published 2025-11-28. Accessed 2026-10-08.Used for: ca-fall-deaths-increase-2017-2022, ca-fall-deaths-2022, ca-fall-hospitalizations-2022, ca-fall-ed-visits-on-ab-2022, ca-fall-direct-costs-2018
- [5]JAMA (American Medical Association). Predictors and prognosis of inability to get up after falls among elderly persons (Tinetti, Liu & Claus, JAMA 1993;269(1):65-70). Published 1993-01-06. Accessed 2026-10-08. (abstract only)Used for: tinetti-1993-non-injured-fallers-unable-to-get-up, tinetti-1993-cohort-share-who-fell, tinetti-1993-all-fallers-unable-to-get-up-including-injured, tinetti-1993-non-injurious-falls-unable-to-get-up, tinetti-1993-non-injurious-falls-over-60-minutes-on-floor, tinetti-1993-restates-wild-1981-as-20-percent-of-falls, tinetti-1993-restates-prior-studies-half-need-help-10pct-over-hour, tinetti-1993-mean-time-on-floor-when-unable-to-get-up, tinetti-1993-one-year-death-unable-vs-able
- [6]NIHR Open Research (National Institute for Health and Care Research). Understanding the scale, impact, and care trajectory for patients who experience a long lie after a fall: mixed methods study protocol (Kuczawski, Sampson, Cotterill et al., NIHR Open Res 2026;6:19). Published 2026-02-25. Accessed 2026-10-08.Used for: kuczawski-2026-protocol-one-in-five-fallers-remain-on-floor-over-an-hour, kuczawski-2026-definition-of-long-lie-over-an-hour, uk-yas-falls-8pct-50000-responses, uk-yas-long-lie-16000-of-115000, kuczawski-2026-uk-denominator-30-percent-over-65-50-percent-over-80
- [7]Ageing & Society (Cambridge University Press). Use of personal call alarms among community-dwelling older people (Nyman SR, Victor CR). Published 2014-01. Accessed 2026-10-08. (abstract only)Used for: nyman-victor-2014-elsa-personal-call-alarm-use-6pct
- [8]Wisconsin Department of Health Services. EMS and Falls in Wisconsin, 2024 Report (P-03493). Published 2025-09-01. Accessed 2026-10-08.Used for: us-wisconsin-falls-21pct-911-runs-2024, us-wisconsin-non-transport-fall-runs-86pct-rise, us-wisconsin-falls-growth-2019-2024
- [9]Nursing Older People (RCN Publishing). Exploring the concept of a 'long lie' after a fall to inform clinical pathways in pre-hospital services: a systematic literature review (Holland & Watkins-Webb, Nurs Older People 2025;37(4):20-26). Published 2025-05-29. Accessed 2026-10-08. (abstract only)Used for: holland-2025-no-universal-definition-six-articles
- [10]International Emergency Nursing (Elsevier). Exploring the impact of experiencing a long lie fall on physical and clinical outcomes in older people requiring an ambulance: a systematic review (Blackburn, Ousey, Stephenson & Lui, Int Emerg Nurs 2022;62:101148). Published 2022-03-01. Accessed 2026-10-08.Used for: blackburn-2022-four-studies-long-lies-relatively-uncommon
- [11]European Review of Aging and Physical Activity (Springer Nature). Concept of the term long lie: a scoping review (Kubitza, Schneider & Reuschenbach, Eur Rev Aging Phys Act 2023;20:16). Published 2023-08-29. Accessed 2026-10-08.Used for: kubitza-2023-definitions-and-time-thresholds-across-22-studies, kubitza-2023-78-percent-of-over-65-fallers-need-help-to-get-up
- [12]British Medical Journal. How dangerous are falls in old people at home? (Wild, Nayak & Isaacs, BMJ 1981;282:266-268). Published 1981-01-24. Accessed 2026-10-08.Used for: wild-1981-earliest-verified-print-use-of-term-long-lie, wild-1981-home-fallers-on-floor-more-than-six-hours, wild-1981-home-fallers-on-floor-more-than-one-hour, wild-1981-half-of-long-liers-died-within-six-months, wild-1981-table-iv-long-lie-one-year-deaths, wild-1981-one-year-mortality-fallers-vs-controls, wild-1981-home-fallers-living-alone, wild-1981-call-alarm-and-telephone-use-after-falling
- [13]Cambridge University Press. Falls in Older People: Risk Factors and Strategies for Prevention, 1st ed., ch. 1 'Epidemiology of falls' (Lord, Sherrington & Menz, 2001). Published 2001. Accessed 2026-10-08.Used for: lord-2001-textbook-definition-of-long-lie, lord-2001-citing-vellas-1987-over-20-percent-of-admitted-fallers-on-ground-an-hour
- [14]CDC Injury Center. Older Adult Falls Data. Published 2026-09-04. Accessed 2026-10-08.Used for: us-cdc-1-in-4-fall, us-fall-death-rate-aa-2024, us-fall-death-rate-aa-2018
- [15]BMJ. Inability to get up after falling, subsequent time on floor, and summoning help: prospective cohort study in people over 90 (Fleming & Brayne, BMJ 2008;337:a2227). Published 2008-11-17. Accessed 2026-10-08.Used for: fleming-2008-over-90s-who-fell-in-one-year, fleming-2008-fallers-unable-to-get-up-after-at-least-one-fall, fleming-2008-falls-unable-to-get-up-without-help, fleming-2008-fall-reports-found-on-floor, fleming-2008-fallers-on-floor-an-hour-or-more, fleming-2008-falls-resulting-in-hour-or-more-on-floor, fleming-2008-unwitnessed-falls-unable-to-rise-hour-or-more, fleming-2008-restates-wild-1981-as-16-percent, fleming-2008-alone-unable-helped-within-five-minutes, fleming-2008-time-on-floor-distribution-alone-and-unable, fleming-2008-time-on-floor-distribution-all-falls, fleming-2008-falls-occurring-when-alone, fleming-2008-long-lies-alarm-unused-97pct, fleming-2008-alarm-available-not-used-80pct, fleming-2008-alarm-available-99pct-of-unable-to-rise-falls, fleming-2008-alarm-activated-falls-rarely-long-lie, fleming-2008-alarm-not-used-care-homes-94pct, fleming-2008-alarm-not-used-own-home-78pct
- [16]NICE. NG249 Falls: assessment and prevention in older people and in people 50 and over at higher risk - Context. Published 2025-04-29. Accessed 2026-10-08.Used for: uk-nice-third-and-half-fall, uk-falls-admissions-2019-20
- [17]NICE (PDF hosted by British Geriatrics Society). NICEimpact falls and fragility fractures (2018). Published 2018. Accessed 2026-10-08.Used for: uk-nice-3-million-fallers-england, uk-falls-admission-rate-2016-17, uk-nhs-falls-cost-2-3bn
- [18]CDC (MMWR). Nonfatal and Fatal Falls Among Adults Aged >=65 Years - United States, 2020-2021 (MMWR 72(35):938-943). Published 2023-09-08. Accessed 2026-10-08.Used for: us-fallers-2020-count, us-fallers-2020-women-pct, us-fallers-2020-pct, us-fall-deaths-2021, us-fall-death-rate-aa-2021
- [19]Office for Health Improvement and Disparities (GOV.UK). Falls: applying All Our Health. Published 2022-02-25. Accessed 2026-10-08.Used for: uk-ohid-third-and-half-fall, uk-falls-admissions-2017-18, uk-hip-fracture-bed-days-cost
- [20]Public Health England (PDF hosted by NHS England South). Falls and fracture consensus statement: supporting commissioning for prevention. Published 2017-01. Accessed 2026-10-08.Used for: uk-phe-third-and-half-fall, uk-falls-admissions-255k-phe-2017
- [21]Public Health Agency of Canada. Seniors' Falls in Canada: Second Report. Accessed 2026-10-08.Used for: ca-fallers-20-30pct
- [22]World Health Organization. Falls - Fact sheet. Published 2021-04-26. Accessed 2026-10-08.Used for: who-falls-medical-attention-37-3m, who-fall-deaths-684k, who-falls-60plus-greatest-fatal, who-falls-dalys-38m, who-fall-deaths-lmic-80pct
- [23]CDC (MMWR). Trends in Nonfatal Falls and Fall-Related Injuries Among Adults Aged >=65 Years - United States, 2012-2018 (MMWR 69(27):875-881). Published 2020-07-10. Accessed 2026-10-08.Used for: us-fallers-2012-pct, us-fallers-2016-pct, us-fallers-2018-pct, us-falls-events-2018, us-fall-injuries-2018, us-fall-injury-pct-2018
- [24]NCHS (CDC). NCHS Data Brief No. 449 - data tables PDF (db449-tables.pdf). Published 2022-11. Accessed 2026-10-08.Used for: us-fall-deaths-2000, us-fall-deaths-2005, us-fall-deaths-2010, us-fall-deaths-2015, us-fall-deaths-2019, us-fall-deaths-2020, us-fall-deaths-2001, us-fall-deaths-2002, us-fall-deaths-2003, us-fall-deaths-2004, us-fall-deaths-2006, us-fall-deaths-2007, us-fall-deaths-2008, us-fall-deaths-2009, us-fall-deaths-2011, us-fall-deaths-2012, us-fall-deaths-2013, us-fall-deaths-2014, us-fall-deaths-2016, us-fall-deaths-2017, us-fall-deaths-2018
- [25]CDC WISQARS. 10 Leading Causes of Injury Deaths by Age Group, 2022, Both sexes, All ages, All races (PDF). Accessed 2026-10-08.Used for: us-fall-deaths-2022
- [26]CDC WISQARS. 10 Leading Causes of Injury Deaths by Age Group, 2023, Both sexes, All ages, All races (PDF). Accessed 2026-10-08.Used for: us-fall-deaths-2023
- [27]NCHS (CDC). NCHS Data Brief No. 532: Unintentional Fall Deaths in Adults Age 65 and Older: United States, 2023. Published 2025-06-18. Accessed 2026-10-08.Used for: us-fall-death-rate-85plus-2003-vs-2023, us-fall-death-rate-85plus-2023, us-fall-death-rate-crude-2023
- [28]NCHS (CDC). NCHS press release: New Reports Examine Chronic Conditions and Fall Deaths Among Older Adults in the U.S.. Published 2025-06-18. Accessed 2026-10-08.Used for: us-fall-death-rate-state-range-2023
- [29]CDC Injury Center. Facts About Falls. Published 2026-09-04. Accessed 2026-10-08.Used for: us-fall-ed-visits-4-5m, us-fall-hospitalizations-1-4m, us-hip-fracture-hospitalizations-319k, us-fall-injury-share-37pct, us-one-in-ten-falls-injury
- [30]CDC Injury Center (archived copy on restoredcdc.org mirror). Older Adult Falls Data (archived pre-2025 version). Accessed 2026-10-08.Used for: us-fall-injuries-9m-2020, us-fall-death-rate-aa-2012
- [31]NCHS (CDC). NCHS Data Brief No. 449: Unintentional Fall Deaths Among Adults Aged 65 and Over: United States, 2020. Published 2022-11. Accessed 2026-10-08.Used for: us-fall-death-rate-crude-2020
- [32]CDC (MMWR). QuickStats: Death Rates from Unintentional Falls Among Adults Aged >=65 Years, by Sex and Age Group - United States, 2024 (MMWR 75:579). Published 2026-09-24. Accessed 2026-10-08.Used for: us-fall-death-rate-2024-by-sex
- [33]International Emergency Nursing (Elsevier) - author manuscript via QUT ePrints. Exploring the impact of experiencing a long lie fall on physical and clinical outcomes in older people requiring an ambulance: a systematic review (Blackburn, Ousey, Stephenson & Lui, Int Emerg Nurs 2022;62:101148) - restating Simpson et al. 2014. Published 2022-03-01. Accessed 2026-10-08.Used for: simpson-2014-still-on-floor-at-ambulance-arrival, johnston-2010-ajp-personal-alarm-share-of-ambulance-fall-calls
- [34]BMC Geriatrics (Springer Nature). Therapy options for those affected by a long lie after a fall: a scoping review (Kubitza, Haas, Keppeler & Reuschenbach, BMC Geriatr 2022;22:582). Published 2022-07-15. Accessed 2026-10-08.Used for: kubitza-2022-half-of-over-65-fallers-found-on-floor-by-rescue-services, kubitza-2022-more-than-half-living-alone-cannot-get-up-or-get-help, kubitza-2022-vellas-70-percent-care-dependent-problems-getting-up, kubitza-2022-one-in-eight-fallers-over-an-hour
- [35]Journal of Gerontology (Gerontological Society of America). Risk factors for injurious falls: a prospective study (Nevitt, Cummings & Hudes, J Gerontol 1991;46(5):M164-M170). Published 1991-09. Accessed 2026-10-08. (abstract only)Used for: nevitt-1991-falls-leaving-faller-unable-to-get-up-5-minutes
- [36]Prehospital Emergency Care (Taylor & Francis). Epidemiology of emergency medical service responses to older people who have fallen: a prospective cohort study (Simpson, Bendall, Tiedemann, Lord & Close, Prehosp Emerg Care 2014;18(2):185-194). Published 2014-01-08. Accessed 2026-10-08. (abstract only)Used for: simpson-2014-nsw-ambulance-long-lies-13-percent
- [37]British Paramedic Journal (College of Paramedics). Re-contact rates with a UK ambulance service following paramedic referral to a falls prevention service for those aged ≥65 years: a retrospective cohort study (Scott, Br Paramed J 2020;5(2):18-25). Published 2020-09-01. Accessed 2026-10-08.Used for: scott-2020-northern-ireland-ambulance-long-lie-share
- [38]Journal of Medical Internet Research (JMIR Publications). Reduction of time on the ground related to real-time video detection of falls in memory care facilities: observational study (Bayen et al., J Med Internet Res 2021). Published 2021-06-17. Accessed 2026-10-08.Used for: bayen-2021-memory-care-fallers-over-one-hour-on-ground-at-baseline
- [39]International Journal of General Medicine (Dove Medical Press). Perspectives on use of personal alarms by older fallers (Johnston & Grimmer-Somers, Int J Gen Med 2010;3:231-237). Published 2010-08-30. Accessed 2026-10-08.Used for: johnston-2010-ijgm-restates-fleming-30-percent-plus-9-percent-unknown
- [40]Zeitschrift für Gerontologie. Falls and lying helpless in the elderly (Ryynänen, Kivelä, Honkanen & Laippala, Z Gerontol 1992;25(4):278-282). Published 1992-07. Accessed 2026-10-08. (abstract only)Used for: ryynanen-1992-finland-lay-15-minutes-or-more-after-fall
- [41]Archives of Physical Medicine and Rehabilitation (Elsevier). Delayed initial recovery and long lie after a fall among middle-aged and older people with multiple sclerosis (Bisson, Peterson & Finlayson, Arch Phys Med Rehabil 2015;96(8):1499-1505). Published 2015-04-28. Accessed 2026-10-08. (abstract only)Used for: bisson-2015-multiple-sclerosis-long-lie-share
- [42]NHS England. AQI Statistical Note, 12 January 2023. Published 2023-01-12. Accessed 2026-10-08.Used for: uk-c3-90th-dec-2022, uk-c3-mean-dec-2022
- [43]Liberal Democrats (compiling FOI responses from NHS ambulance trusts). Almost 20,000 older people waited over four hours for an ambulance after falls last year. Published 2024-03-19. Accessed 2026-10-08.Used for: uk-foi-older-fallers-waited-over-12h-2022-23, uk-foi-older-fallers-waited-over-4h-2022-23
- [44]Nuffield Trust (restating NHS England standard). Ambulance response times (QualityWatch explainer). Published 2026-06-25. Accessed 2026-10-08.Used for: uk-c3-standard-120-min
- [45]NHS England. AQI Statistical Note, 15 January 2026. Published 2026-01-15. Accessed 2026-10-08.Used for: uk-c3-mean-dec-2025, uk-c3-90th-dec-2025
- [46]NHS England. AQI Statistical Note, 11 June 2026. Published 2026-06-11. Accessed 2026-10-08.Used for: uk-c3-90th-may-2026, uk-c3-mean-may-2026
- [47]Prehospital Emergency Care. Epidemiology of emergency medical service responses to older people who have fallen: a prospective cohort study (Simpson PM, Bendall JC, Tiedemann A, Lord SR, Close JC). Published 2014-04-01. Accessed 2026-10-08. (abstract only)Used for: au-nsw-long-lies-13pct-median-response-15-min
- [48]NHS England. AQI Statistical Note, 11 November 2021. Published 2021-11-11. Accessed 2026-10-08.Used for: uk-c3-mean-oct-2021, uk-c3-90th-oct-2021
- [49]NHS England. AQI Statistical Note, 13 January 2022. Published 2022-01-13. Accessed 2026-10-08.Used for: uk-c3-mean-dec-2021, uk-c3-90th-dec-2021
- [50]NHS England. AQI Statistical Note, 10 March 2022. Published 2022-03-10. Accessed 2026-10-08.Used for: uk-c3-mean-feb-2022, uk-c3-90th-feb-2022
- [51]NHS England. AQI Statistical Note, 11 January 2024. Published 2024-01-11. Accessed 2026-10-08.Used for: uk-c3-mean-dec-2023, uk-c3-90th-dec-2023
- [52]NHS England. AQI Statistical Note, 9 January 2025. Published 2025-01-09. Accessed 2026-10-08.Used for: uk-c3-mean-dec-2024, uk-c3-90th-dec-2024
- [53]NHS England. AQI Statistical Note, 13 February 2025. Published 2025-02-13. Accessed 2026-10-08.Used for: uk-c3-mean-jan-2025, uk-c3-90th-jan-2025
- [54]NHS England. AQI Statistical Note, 11 December 2025. Published 2025-12-11. Accessed 2026-10-08.Used for: uk-c3-mean-nov-2025, uk-c3-90th-nov-2025
- [55]NHS England. AQI Statistical Note, 12 March 2026. Published 2026-03-12. Accessed 2026-10-08.Used for: uk-c3-mean-feb-2026, uk-c3-90th-feb-2026
- [56]Medizinische Klinik - Intensivmedizin und Notfallmedizin. 'Long lie trauma' patients: retrospective analysis of a patient cohort presenting to a university hospital emergency department. Published 2022-04-11 (online); print 2023. Accessed 2026-10-08.Used for: huser-2023-long-lie-trauma-complications, huser-2023-long-lie-trauma-in-hospital-mortality-50pct
- [57]Ostomy/Wound Management. How much time does it take to get a pressure ulcer? Integrated evidence from human, animal, and in vitro studies. Published 2008-10. Accessed 2026-10-08. (abstract only)Used for: gefen-2008-pressure-ulcer-onset-1-to-6-hours
- [58]BMC Geriatrics (Springer Nature). Rhabdomyolysis in older adults: outcomes and prognostic factors. Published 2024-01-11. Accessed 2026-10-08.Used for: morin-2024-rhabdo-70plus-90pct-prolonged-immobilization, morin-2024-rhabdo-aki-57-7pct, morin-2024-rhabdo-30-day-mortality-10-5pct
- [59]The Lancet. Factors associated with hypothermia in patients admitted to a group of inner city hospitals. Published 1989-11-18. Accessed 2026-10-08. (abstract only)Used for: woodhouse-1989-hypothermia-found-on-floor-79pct
- [60]Renal Society of Australasia Journal. Rhabdomyolysis cases and acute kidney injury: a 10-year experience at a regional tertiary centre. Published 2020-11. Accessed 2026-10-08.Used for: choy-2020-rhabdo-prolonged-immobility-71-5pct-aki-50-7pct
- [61]JACEP Open (Journal of the American College of Emergency Physicians Open). Patients in Rhabdomyolysis Presenting to the Emergency Department. Published 2025. Accessed 2026-10-08.Used for: alter-2025-ed-rhabdo-pressure-immobility-53-6pct
- [62]British Geriatrics Society (conference abstract, 3rd World Falls Congress). Older patients presenting with a fall and long lie; is there an opportunity to reduce unnecessary hospital admissions?. Published 2026. Accessed 2026-10-08.Used for: walters-2026-long-lie-ck-elevated-39pct, walters-2026-long-lie-aki-4pct
- [63]Public Health (Elsevier / Royal Society for Public Health). Hypothermia in the elderly: sociomedical characteristics and outcome of 86 patients. Published 1989-01. Accessed 2026-10-08. (abstract only)Used for: gautam-1989-elderly-hypothermia-mortality-36pct-48h
- [64]Acute Medicine & Surgery (Wiley / Japanese Association for Acute Medicine). Accidental hypothermia: characteristics, outcomes, and prognostic factors - A nationwide observational study in Japan (Hypothermia study 2018 and 2019). Published 2021-09. Accessed 2026-10-08.Used for: takauji-2021-japan-hypothermia-indoor-73pct-mortality-24-5pct
- [65]Gerontology (Karger). The post-fall syndrome. A study of 36 elderly patients. Published 1982. Accessed 2026-10-08. (abstract only)Used for: murphy-isaacs-1982-post-fall-syndrome
- [66]BMC Geriatrics. The global prevalence of and risk factors for fear of falling among older adults: a systematic review and meta-analysis. Published 2024-04-05. Accessed 2026-10-08.Used for: xiong-2024-global-fear-of-falling-49-6pct
- [67]Age and Ageing (Oxford University Press / British Geriatrics Society). Fear of falling and restriction of mobility in elderly fallers. Published 1997-05. Accessed 2026-10-08. (abstract only)Used for: vellas-1997-fear-of-falling-32pct-after-fall
- [68]BMJ. Inability to get up after falling, subsequent time on floor, and summoning help: prospective cohort study in people over 90. Published 2008-11-17. Accessed 2026-10-08.Used for: fleming-2008-long-lie-move-to-long-term-care, fleming-2008-long-lie-hospital-admission-60pct, fleming-2008-long-lie-serious-injury-or-4-2
- [69]JAMA. Predictors and prognosis of inability to get up after falls among elderly persons. Published 1993-01-06. Accessed 2026-10-08. (abstract only)Used for: tinetti-1993-adl-decline-35-vs-26
- [70]New England Journal of Medicine. Falls, injuries due to falls, and the risk of admission to a nursing home. Published 1997-10-30. Accessed 2026-10-08. (abstract only)Used for: tinetti-1997-nursing-home-admission-or-10-2, tinetti-1997-12-1pct-long-term-nh-admission
- [71]BMC Musculoskeletal Disorders. Delayed hospitalization for patients with hip fragility fracture increases mortality risk one year after surgery: a multicentre cohort study. Published 2026. Accessed 2026-10-08.Used for: fu-2026-hip-fracture-admission-delay-6pct-per-day
- [72]Cureus. Pre-Hospital Delays Represent Unnoticed Intervals That Affect Mortality Rates in Geriatric Hip Fractures: A Prospective Cohort Study. Published 2023-09. Accessed 2026-10-08.Used for: ghosh-2023-hip-fracture-injury-to-admission-or-1-22
- [73]Archives of Osteoporosis (Springer). Pressure ulcers are associated with 6-month mortality in elderly patients with hip fracture managed in orthogeriatric care pathway. Published 2017-08-29. Accessed 2026-10-08. (abstract only)Used for: magny-2017-hip-fracture-pressure-ulcer-6-month-mortality-rr-2-38
- [74]JAAOS Global Research & Reviews (American Academy of Orthopaedic Surgeons). Preoperative Pressure Ulcers, Mortality, and Complications in Older Hip Fracture Surgery Patients. Published 2022-11. Accessed 2026-10-08.Used for: porter-2022-hip-fracture-preop-pressure-ulcer-30-day-mortality-or-1-21
- [75]U.S. Census Bureau. America's Families and Living Arrangements: 2022 (P20-587), Table 2. Living Arrangements of Younger and Older Adults by Age: 2022. Published 2024. Accessed 2026-10-08.Used for: us-living-alone-65plus-total-2022-derived, us-living-alone-65plus-women-2022, us-living-alone-65plus-men-2022, us-living-alone-men-75plus-2022
- [76]OECD (Affordable Housing Database). HM1.4 Living arrangements by age groups (last updated 02/10/2025) - PDF and workbook HM1-4-Living-arrangements-age-groups.xlsx. Published 2025-10-02. Accessed 2026-10-08.Used for: oecd-lithuania-65plus-living-alone, uk-oecd-65plus-living-alone-2022, oecd-65plus-living-alone-average-2024, us-oecd-65plus-living-alone-2023, ca-oecd-65plus-living-alone-2022, au-oecd-65plus-living-alone-2021
- [77]Eurostat (Statistics Explained). Household composition statistics (data extracted May 2026; EU-LFS, lfst_hhnhtych). Published 2026-05. Accessed 2026-10-08.Used for: eu-living-alone-65plus-2025
- [78]Cabinet Office, Government of Japan. Annual Report on the Ageing Society [Summary] FY2025 (June 2025). Published 2025-06. Accessed 2026-10-08.Used for: jp-living-alone-65plus-2020-by-sex, jp-living-alone-65plus-2050-projection-by-sex, jp-living-alone-65plus-1980-by-sex, jp-pop-65plus-2024
- [79]Office for National Statistics. Families and households in the UK: 2024. Published 2025-07-23. Accessed 2026-10-08.Used for: uk-living-alone-share-65plus-2024, uk-living-alone-65plus-2024, uk-living-alone-65plus-2014, uk-living-alone-women-65plus-2024
- [80]U.S. Census Bureau. Living Arrangements Varied Across Age Groups (America Counts story). Published 2024-05-30. Accessed 2026-10-08.Used for: us-living-alone-women-75plus-2022, us-living-alone-women-65-74-2022
- [81]Eurostat. News: 4 in 10 women aged 65 or over live alone (DDN-20200623-1; EU-LFS lfst_hhindws, 2019). Published 2020-06-23. Accessed 2026-10-08.Used for: eu-living-alone-women-65plus-2019, eu-living-alone-women-65plus-latvia-2019
- [82]Pew Research Center. Older people are more likely to live alone in the U.S. than elsewhere in the world. Published 2020-03-10. Accessed 2026-10-08.Used for: us-living-alone-60plus-pew-2020
- [83]Eurostat. Ageing Europe - looking at the lives of older people in the EU - 2020 edition (KS-02-20-655), Chapter 2 Housing and living conditions. Published 2020-10. Accessed 2026-10-08.Used for: eu-living-alone-65plus-by-sex-2018-silc
- [84]National Institute of Population and Social Security Research (IPSS), Japan. 日本の世帯数の将来推計(全国推計)(令和6(2024)年推計). Published 2024-04-12. Accessed 2026-10-08.Used for: jp-ipss-2050-elderly-single-person-households
- [85]Australian Bureau of Statistics. Household and Family Projections, Australia, 2021-2046. Published 2024-06-28. Accessed 2026-10-08.Used for: au-living-alone-total-2021, au-living-alone-85plus-2046-projection
- [86]Ministry of Health, Singapore. Data on seniors aged 65 and above living alone and plans for new initiatives to prevent unattended deaths (Parliamentary QA, 15 Oct 2025). Published 2025-10-15. Accessed 2026-10-08.Used for: sg-moh-2024-seniors-living-alone
- [87]Statistics Canada. The Daily, 13 July 2022: Home alone: More persons living solo than ever before, but roomies the fastest growing household type (2021 Census). Published 2022-07-13. Accessed 2026-10-08.Used for: ca-living-alone-women-85plus-2021, ca-living-alone-total-2021
- [88]Statistics Canada. The Daily, 13 July 2022 (PDF), Table 1: Proportion of persons aged 15 years and older in private households that are living alone ... by age group, Canada, 1981, 2016 and 2021. Published 2022-07-13. Accessed 2026-10-08.Used for: ca-living-alone-85plus-2021, ca-living-alone-80-84-2021, ca-living-alone-75-79-2021, ca-living-alone-70-74-2021, ca-living-alone-65-69-2021
- [89]World Health Organization. Ageing and health - Fact sheet. Published 2025-10-01. Accessed 2026-10-08.Used for: who-60plus-2050-2-1bn, who-60plus-2030-1-in-6
- [90]United Nations (DESA). Global Issues: Ageing. Accessed 2026-10-08.Used for: un-65plus-2-2bn-late-2070s, un-1-in-6-over-65-by-2050
- [91]U.S. Census Bureau. Press release: Older Adults Outnumber Children in 11 States and Nearly Half of U.S. Counties (Vintage 2024 estimates). Published 2025-06-26. Accessed 2026-10-08.Used for: us-pop-65plus-2024
- [92]Eurostat. Demography of Europe - 2025 edition (interactive publication), Population structure. Published 2025. Accessed 2026-10-08.Used for: eu-65plus-share-2024
- [93]NEMSIS Technical Assistance Center (NHTSA Office of EMS). National EMS Data Report 2024. Published 2025-08-01. Accessed 2026-10-08.Used for: us-nemsis-falls-leading-cause-of-injury-2024
- [94]Spire Healthcare (compiling ambulance-service FOI responses). UK Fall Hotspots: Ambulance Call Data by Region. Published 2026-01-01. Accessed 2026-10-08.Used for: uk-spire-foi-800000-fall-calls-2024
- [95]American Journal of Preventive Medicine (Elsevier); authors at CDC. Older Adult Falls Seen by Emergency Medical Service Providers: A Prevention Opportunity (Faul M, Stevens JA, Sasser SM, et al.). Published 2016-05-01. Accessed 2026-10-08. (abstract only)Used for: us-nemsis-falls-17pct-ems-calls-65plus-2012
- [96]NEMSIS Technical Assistance Center (NHTSA Office of EMS). 2021 National EMS Data Report. Published 2022-01-01. Accessed 2026-10-08.Used for: us-nemsis-falls-leading-cause-of-injury-2021
- [97]Association of Ambulance Chief Executives (AACE). New framework strengthens falls response across ambulance services. Published 2025-10-22. Accessed 2026-10-08.Used for: uk-aace-falls-up-to-10pct-999-2025
- [98]Age and Ageing (Oxford University Press / British Geriatrics Society). Ambulance responses to older adults who have fallen: a systematic review (Gunson et al., Age Ageing 2025;54(8):afaf228). Published 2025-08-01. Accessed 2026-10-08.Used for: gunson-2025-share-of-emergency-ambulance-calls-older-fallers
- [99]Welsh Government (Minister for Health and Social Services, Vaughan Gething). Written Statement: Update on Welsh Ambulance Services NHS Trust (WAST) Falls Assistants response pilot. Published 2019-04-18. Accessed 2026-10-08.Used for: uk-wales-falls-calls-2017-18, uk-wales-falls-assistant-pilot-65pct-no-hospital
- [100]Scottish Ambulance Service. FOI 25-168 Fall related Incidents (data spreadsheet). Published 2025-05-02. Accessed 2026-10-08.Used for: uk-scotland-falls-65plus-attended-2024, uk-scotland-falls-share-65plus-2024-derived, uk-scotland-falls-65plus-attended-2022, uk-scotland-falls-65plus-attended-2023
- [101]Injury (Elsevier). The epidemiology of elderly falls attended by emergency medical services in Victoria, Australia (Cox S, Roggenkamp R, Bernard S, Smith K). Published 2018-08-01. Accessed 2026-10-08. (abstract only)Used for: au-victoria-elderly-falls-9-7pct-workload-2010-2017, au-victoria-repeat-falls-13-2pct-12-months
- [102]Public Health Research & Practice (Sax Institute). Trends in fall-related ambulance use and hospitalisation among older adults in NSW, 2006-2013: a retrospective, population-based study (Paul SS, Harvey L, Carroll T, et al.). Published 2017-10-01. Accessed 2026-10-08.Used for: au-nsw-fall-ambulance-use-314041-2006-2013
- [103]Australasian Journal on Ageing (Wiley). Epidemiology of ambulance responses to older people who have fallen in New South Wales, Australia (Simpson PM, Bendall JC, Patterson J, Tiedemann A, Middleton PM, Close JC). Published 2013-09-01. Accessed 2026-10-08. (abstract only)Used for: au-nsw-older-falls-5-1pct-emergency-workload-2008-09
- [104]Australasian Journal on Ageing (Wiley). Ambulance Responses to Falls Incidents in Queensland Residential Aged Care Facilities: Implications for Policy and Practice (Hughes et al.). Published 2026-07-01. Accessed 2026-10-08.Used for: au-qas-racf-falls-attendances-2021-2023
- [105]Hato Hone St John (via Scoop press-release wire). Hato Hone St John Launches Falls Prevention Drive. Published 2026-04-01. Accessed 2026-10-08.Used for: nz-stjohn-falls-53700-callouts-12pct
- [106]New Zealand Medical Journal. Towards an integrated falls response service for Aotearoa New Zealand: occupational therapy and paramedicine in community care. Published 2026-01-01. Accessed 2026-10-08.Used for: nz-nzmj-stjohn-34000-fall-incidents
- [107]International Journal of Emergency Medicine (Springer). Prediction of the future number of fall-related emergency medical services calls in older individuals (Uemura S, Nakayama R, Koyama M, et al.). Published 2024-06-11. Accessed 2026-10-08.Used for: jp-sapporo-fall-calls-70262-projection
- [108]Annals of Emergency Dispatch & Response (derived by CareTrigger research). Falls Protocol Lift Assist Calls: Predictors of Repeat 911 Calls. Published 2020-01-01. Accessed 2026-10-08.Used for: us-aedr-2020-lift-assists-42-8pct-derived, us-aedr-2020-lift-assists-share-of-fall-calls
- [109]Geriatric Orthopaedic Surgery & Rehabilitation (SAGE). Ten years of EMS Fall Calls in a Community: An Opportunity for Injury Prevention Strategies (Quatman CE, Mondor M, Halweg J, Switzer JA). Published 2018-06-25. Accessed 2026-10-08.Used for: us-quatman-2018-fall-calls-up-268pct, us-quatman-2018-cost-per-untreated-run-825
- [110]KOAA News5 (reporting Colorado Springs Fire Department data). CSFD sees increase in 911 lift assist calls, what options are there for seniors?. Published 2026-01-01. Accessed 2026-10-08.Used for: us-csfd-lift-assists-doubled-2020-2025
- [111]EMS1 (Lexipol), reporting Decatur Fire Department data. How a fire department's lift assist fee dropped call volume by 60%. Published 2025-04-18. Accessed 2026-10-08.Used for: us-decatur-lift-assists-430-to-1000
- [112]FireRescue1 (syndicating Chattanooga Times Free Press). Increase in non-emergency calls push Tenn. fire departments to seek solutions. Published 2019-05-27. Accessed 2026-10-08.Used for: us-chattanooga-citizen-assists-300pct
- [113]Senior Housing News (reporting The Washington Post analysis of 911 data). Washington Post Analysis Shows 30% Spike in Lift-Assist Calls from Senior Living. Published 2024-05-03. Accessed 2026-10-08.Used for: us-wapo-2024-senior-living-lift-assists-up-30pct
- [114]Prehospital Emergency Care (Taylor & Francis / NAEMSP). A descriptive study of the 'lift-assist' call (Cone DC, Ahern J, Lee CH, Baker D, Murphy T, Bogucki S). Published 2013-01-01. Accessed 2026-10-08. (abstract only)Used for: us-cone-2013-lift-assists-4-8pct, us-cone-2013-return-visits-30-days
- [115]Prehospital Emergency Care. Morbidity and Mortality Associated with Prehospital 'Lift-assist' Calls (Leggatt L, Van Aarsen K, Columbus M, Dukelow A, Lewell M, Davis M, McLeod S). Published 2017-09-01. Accessed 2026-10-08. (abstract only)Used for: ca-leggatt-2017-lift-assists-1-9pct-14-day-outcomes
- [116]Prehospital Emergency Care. Impact of Lift Assist Calls on Paramedic Services: A Descriptive Study (Schierholtz T, Carter D, Kane A, Kemp O, Gallant C, Sheikh B, Johnston W, Zecevic A). Published 2019-03-01. Accessed 2026-10-08. (abstract only)Used for: ca-schierholtz-2019-lift-assists-65plus-2015, ca-schierholtz-2019-repeat-callers-32pct
- [117]Archives of Gerontology and Geriatrics Plus (Elsevier). Timing of emergency medical services activations for falls. Published 2024-03-29. Accessed 2026-10-08.Used for: us-ems-timing-falls-5-4pct-lift-assist-transport-7pct
- [118]Emergency Medicine Journal (BMJ). The costs of falls in the community to the North East Ambulance Service. Published 2006-06-01. Accessed 2026-10-08. (abstract only)Used for: uk-neas-assistance-only-11pct-2006, uk-neas-cost-per-fall-2006
- [119]Australasian Journal on Ageing (Wiley). Systematic review of non-transportation rates and outcomes for older people who have fallen after ambulance service call-out (Mikolaizak AS, Simpson PM, Tiedemann A, Lord SR, Close JC). Published 2013-09-01. Accessed 2026-10-08. (abstract only)Used for: au-mikolaizak-2013-non-transport-11-56pct
- [120]European Review of Aging and Physical Activity (Springer Nature). Concept of the term long lie: a scoping review. Published 2023-08-29. Accessed 2026-10-08.Used for: kubitza-2023-ambulance-recontact-78-8-vs-60-6
- [121]Western Journal of Emergency Medicine. Refusal of Emergency Medical Transport After a Fall: Patient Characteristics and Outcomes of Repeat Callers (Barr J, Selman K, Hunter K, Kuc A). Published 2025-11-01. Accessed 2026-10-08.Used for: us-barr-2025-fall-refusal-repeat-callers
- [122]The American Journal of Emergency Medicine (Elsevier). Geriatric 'lift-assist' EMS calls with transport refusal: Characteristics of short-term repeat calls and hospitalizations (Moore EA, Schoenfeld DW, Fritz CL, Bivens MJ, Liu SW, Thomas SH). Published 2025-05-01. Accessed 2026-10-08. (abstract only)Used for: us-moore-2025-fall-refusals-repeat-same-month
- [123]Journal of the American Geriatrics Society (Wiley). Frequent 911 Fall Calls in Older Adults: Opportunity for Injury Prevention Strategies (Quatman CE, Anderson JP, Mondor M, Halweg J, Quatman-Yates C, Switzer JA). Published 2018-10-01. Accessed 2026-10-08. (abstract only)Used for: us-quatman-2018-jags-repeat-fall-callers
- [124]Prehospital Emergency Care. Timeline for Repeat EMS Encounters Resulting in Transport Following 'Lift Assist' in a Suburban EMS System (Dorsett M, Allen H, Garbacz H, et al.). Published 2025-05-08. Accessed 2026-10-08. (abstract only)Used for: us-dorsett-2026-repeat-after-lift-assist-72h
- [125]British Paramedic Journal (College of Paramedics). Re-contact rates with a UK ambulance service following paramedic referral to a falls prevention service for those aged ≥ 65 years: a retrospective cohort study (Scott J). Published 2020-12-01. Accessed 2026-10-08.Used for: uk-nias-falls-recontact-2020
- [126]NHS England (case study of Aneurin Bevan UHB / Welsh Ambulance Service project). Going further for winter: Community-based falls response (BW2063). Published 2022-10-19. Accessed 2026-10-08.Used for: uk-wales-care-home-lifting-80pct-reduction, uk-nhse-cfr-236000-incidents-2021-22, uk-nhse-ambulance-callout-cost-252
- [127]East of England Ambulance Service NHS Trust. Community response helps those who fall at home. Published 2024-09-23. Accessed 2026-10-08.Used for: uk-eeast-community-wellbeing-officers-40pct
- [128]Injury Prevention (BMJ). Economic modelling of fall prevention interventions delivered by community emergency medical services: a decision-tree analysis (Ordoobadi AJ, Friend TH, Berry SD, Welch HG, Cooper Z, Jarman MP). Published 2025-05-11. Accessed 2026-10-08.Used for: us-ordoobadi-2025-community-ems-fall-prevention-savings
- [129]Zeitschrift für Gerontologie und Geriatrie (Springer). Satisfaction and use of personal emergency response systems. Published 2010. Accessed 2026-10-08. (abstract only)Used for: heinbuchner-2010-pers-not-activated-after-fall-83pct, heinbuchner-2010-pers-never-worn-24pct, heinbuchner-2010-pers-worn-24h-14pct
- [130]TheSeniorList.com. 2026 Medical Alert Device Usage Report. Published 2026-06-22. Accessed 2026-10-08.Used for: seniorlist-2026-pers-users-wear-at-all-times-18pct, seniorlist-2026-pers-users-not-worn-in-shower-64pct, seniorlist-2026-pers-ownership-65plus-9pct
- [131]Journal of Medical Internet Research (JMIR Publications). The Personal Emergency Response System as a Technology Innovation in Primary Health Care Services: An Integrative Review. Published 2016-07. Accessed 2026-10-08.Used for: stokke-2016-review-quarter-never-wore-pendant, stokke-2016-review-33-studies, stokke-2016-mcwhirter-false-alarms-40pct
- [132]Innovation in Aging (Oxford University Press / GSA abstract supplement). Self-Reported Health, PERS, and Social Care Use in Older Adults at Risk of Falls: Pilot Results (Zahradka N, Chung J, Momin A, Williams A, Torres Ruiz I, Najafi B). Published 2025. Accessed 2026-10-08.Used for: zahradka-2025-pendant-worn-68pct-of-days
- [133]International Journal of General Medicine (Dove Medical Press). Perspectives on use of personal alarms by older fallers (Johnston K, Grimmer-Somers K, Sutherland M). Published 2010-08-11. Accessed 2026-10-08.Used for: johnston-2010-ambulance-fallers-owning-alarm-20-of-31
- [134]Home Health Care Services Quarterly (Taylor & Francis). Personal emergency alarms: do health outcomes differ for purchasers and nonpurchasers? (De San Miguel K, Lewin G, Burton EL, Howat P, Boldy D, Toye C). Published 2017. Accessed 2026-10-08. (abstract only)Used for: desanmiguel-2017-no-difference-time-on-floor-purchasers-vs-nonpurchasers
- [135]Journal of the American Geriatrics Society (Wiley). Evaluation of an Automated Falls Detection Device in Nursing Home Residents (Lipsitz LA, Tchalla AE, Iloputaife I, Gagnon M, Dole K, Su ZZ, Klickstein L). Published 2016. Accessed 2026-10-08. (abstract only)Used for: lipsitz-2016-pendant-afd-sensitivity-19pct-nursing-home, lipsitz-2016-pendant-afd-false-positives-87pct
- [136]Journal of the American Geriatrics Society (Wiley). Real-World Accuracy and Use of a Wearable Fall Detection Device by Older Adults (Chaudhuri S, Oudejans D, Thompson HJ, Demiris G). Published 2015-11. Accessed 2026-10-08.Used for: chaudhuri-2015-false-alarms-83-of-84, chaudhuri-2015-real-falls-detected-1-of-4-while-worn
- [137]Assistive Technology (Taylor & Francis / RESNA). Sensitivity of Apple Watch fall detection feature among wheelchair users (Abou L, Fliflet A, Hawari L, Presti P, Sosnoff JJ, Mahajan HP, Frechette ML, Rice LA). Published 2022. Accessed 2026-10-08. (abstract only)Used for: abou-2022-apple-watch-wheelchair-falls-sensitivity-4-7pct
- [138]PLOS ONE. Evaluation of Accelerometer-Based Fall Detection Algorithms on Real-World Falls (Bagalà F, Becker C, Cappello A, Chiari L, Aminian K, Hausdorff JM, et al.). Published 2012-05-16. Accessed 2026-10-08.Used for: bagala-2012-real-world-fall-algorithms-sensitivity-57pct, bagala-2012-false-alarms-per-day-3-to-85
- [139]Journal of Geriatric Physical Therapy (Wolters Kluwer). Fall Detection Devices and their Use with Older Adults: A Systematic Review (Chaudhuri S, Thompson H, Demiris G). Published 2014. Accessed 2026-10-08.Used for: chaudhuri-2014-review-wearable-projects-tested-real-world-older-adults-7pct
- [140]JMIR Formative Research (JMIR Publications). Effectiveness of a Smartwatch App in Detecting Induced Falls: Observational Study (Brew B, Faux SG, Blanchard E). Published 2022-03. Accessed 2026-10-08.Used for: brew-2022-smartwatch-app-induced-falls-sensitivity-77pct
- [141]Apple Inc.. Use Fall Detection with Apple Watch (Apple Support). Published 2026-05-06. Accessed 2026-10-08.Used for: apple-fall-detection-cannot-detect-all-falls, apple-fall-detection-default-on-age-55
- [142]Lifeline Systems. Automatic Fall Detection Systems for Seniors | Lifeline (and blog 'How Fall Detection Works: Sensors, Accuracy, and What Happens Next'). Published 2025-07-10. Accessed 2026-10-08.Used for: lifeline-autoalert-does-not-detect-100pct
- [143]Apple Inc. (Newsroom). Redesigned Apple Watch Series 4 revolutionizes communication, fitness and health. Published 2018-09-12. Accessed 2026-10-08.Used for: apple-watch-auto-call-after-60s-immobility
- [144]Pew Research Center. Mobile Fact Sheet. Published 2025-11-20. Accessed 2026-10-08.Used for: pew-2025-cellphone-any-kind-65plus-95pct, pew-2025-smartphone-ownership-65plus-78pct
- [145]AARP Research. 2026 Tech Trends and Adults 50-Plus. Published 2025-12. Accessed 2026-10-08.Used for: aarp-2026-caregivers-using-emergency-response-systems-12pct, aarp-2026-wearable-ownership-50plus-35pct
- [146]Medicare Payment Advisory Commission (MedPAC). Report to the Congress: Medicare and the Health Care Delivery System, June 2025, Chapter 2: Supplemental benefits in Medicare Advantage. Published 2025-06. Accessed 2026-10-08.Used for: medpac-2025-ma-enrollees-in-plans-offering-pers-12pct
- [147]Rock Health. Screenagers to Silver Surfers: How each generation clicks with care (Knowles M, Krasniansky A, Kaganoff S). Published 2025-03-17. Accessed 2026-10-08.Used for: rockhealth-2024-boomers-65-74-smartwatch-or-connected-device-36pct
- [148]AARP Research. 2026 Tech Trends and Adults 50-Plus (DOI 10.26419/res.01020.001). Published 2025-12. Accessed 2026-10-08.Used for: aarp-2026-smartphone-ownership-50plus-90pct
- [149]National Police Agency of Japan. 令和7年中における死体取扱状況(警察取扱死体のうち、自宅において死亡した一人暮らしの者)について (NPA). Published 2026-04. Accessed 2026-10-08.Used for: jp-npa-2025-found-after-1-month, jp-npa-2025-died-alone-at-home-65plus
- [150]National Police Agency of Japan (reported by Nikkei). 高齢者「孤独死」昨年5.8万人 警察庁初集計、発見に1カ月以上7.8% (Nikkei, 2025-04-11) + NPA PDF table. Published 2025-04-11. Accessed 2026-10-08. (paywalled)Used for: jp-npa-2024-65plus-found-after-1-month
- [151]National Police Agency of Japan. 令和6年中における警察取扱死体のうち、自宅において死亡した一人暮らしの者について (NPA, Criminal Affairs Bureau, 1st Investigation Division). Published 2025-04-11. Accessed 2026-10-08.Used for: jp-npa-2024-65plus-found-8plus-days, jp-npa-2024-died-alone-at-home-65plus, jp-npa-2024-time-to-discovery-distribution, npa-japan-2024-65plus-found-within-1-day-39-2pct, jp-npa-2024-largest-age-band-85plus
- [152]Cabinet Office, Japan (孤独・孤立対策推進室). 令和7年孤立死者数の推計について (報道資料, 2026-04-14). Published 2026-04-14. Accessed 2026-10-08.Used for: jp-cao-2025-isolated-deaths-8plus-days
- [153]Cabinet Office, Japan (内閣府 孤独・孤立対策推進室; 「孤独死・孤立死」WG). 孤立死者数の推計方法等について ~「警察取扱死体のうち、自宅において死亡した一人暮らしの者」をもとに~ 「孤独死・孤立死」WG取りまとめ (2025-04-11). Published 2025-04-11. Accessed 2026-10-08.Used for: jp-cao-2024-isolated-deaths-8plus-days, jp-cao-koritsushi-definition, jp-cao-2024-isolated-deaths-4plus-days-reference
- [154]National Police Agency of Japan (警察庁刑事局捜査第一課). 令和6年中における警察取扱死体のうち、自宅において死亡した一人暮らしの者について (NPA, Criminal Affairs Bureau, 1st Investigation Division). Published 2025-04-11. Accessed 2026-10-08.Used for: jp-npa-2024-died-alone-at-home-total
- [155]Tokyo Metropolitan Medical Examiner's Office (東京都監察医務院). 死後経過時間(9区分),性・世帯分類別異状死数・構成比,東京都特別区,令和3年 (表4-00-121). Accessed 2026-10-08.Used for: jp-tokyo23-me-2021-single-households-found-8plus-days
- [156]Cabinet Office, Japan (令和7年版高齢社会白書), from Tokyo Metropolitan Medical Examiner's Office statistics. 令和7年版高齢社会白書 第1章第2節4 生活環境 — 図1-2-4-18 東京23区内における一人暮らしで65歳以上の人の自宅での死亡者数. Published 2025-06. Accessed 2026-10-08.Used for: jp-tokyo23-me-2023-65plus-living-alone-home-deaths
- [157]National Police Agency of Japan. 令和6年上半期(1~6月分)(暫定値)における死体取扱状況(警察取扱死体のうち、自宅において死亡した一人暮らしの者)について. Published 2024-08. Accessed 2026-10-08.Used for: jp-npa-2024h1-died-alone-at-home
- [158]National Police Agency of Japan. 令和7年上半期(1~6月分)(暫定値)における死体取扱状況(警察取扱死体のうち、自宅において死亡した一人暮らしの者)について. Published 2025-08-08. Accessed 2026-10-08.Used for: jp-npa-2025h1-died-alone-at-home
- [159]Ministry of Health and Welfare, Republic of Korea. 2024년 고독사 전년 대비 증가, “생애주기별 사회적 고립 위험군 발굴하여 맞춤형 지원 예정” (press release, 2025-11-27). Published 2025-11-27. Accessed 2026-10-08.Used for: kr-mohw-godoksa-2024-count, kr-mohw-godoksa-2024-who-found-the-body, kr-godoksa-statutory-definition
- [160]Ministry of Health and Welfare, Republic of Korea. 2024년 고독사 사망자 실태조사 결과 발표. Published 2024-10-17. Accessed 2026-10-08.Used for: kr-mohw-godoksa-2023-male-share, kr-mohw-godoksa-2023-count
- [161]Journal of Clinical Pathology (BMJ; peer-reviewed). Estrin-Serlui T, Osborn M. Putrefaction in the pandemic: a comparative study of the frequency of advanced decomposition change in coronial autopsies since the start of the COVID-19 pandemic. J Clin Pathol 2023;76(2):121-125 (PMID 34535567). Published 2021-09-17. Accessed 2026-10-08. (abstract only)Used for: uk-london-2023-lockdown-decomposition-increase
- [162]Journal of Forensic and Legal Medicine (peer-reviewed; Public Health Service of Amsterdam). Runtuwene NF, Buster MCA. Domestic-setting corpses, an urban problem? J Forensic Leg Med 2019;61:22-26 (PMID 30412866). Published 2018-10-25. Accessed 2026-10-08. (abstract only)Used for: nl-amsterdam-2019-domestic-setting-corpses-14plus-days
- [163]Legal Medicine (Tokyo) (Elsevier; peer-reviewed). Yamasaki Y et al. Factors that delay discovery in cases of death at home in Japan. Leg Med (Tokyo) 2026;84:102895 (PMID 42364373). Published 2026-06-18. Accessed 2026-10-08. (abstract only)Used for: jp-okayama-2026-delayed-discovery-3plus-days
- [164]BMC Geriatrics (peer-reviewed, open access). Vural T, Kalkan SA. Decomposition and medicolegal autopsy in geriatric in-home non-traumatic deaths: histopathological findings and a public health perspective. BMC Geriatr 2026;26:313 (PMID 41639798). Published 2026-02-05. Accessed 2026-10-08.Used for: tr-2026-decomposed-geriatric-home-deaths-living-alone
- [165]Journal of the Royal Society of Medicine (peer-reviewed; Oxford / Imperial / LSHTM / Public Health Scotland authors) using ONS data. Hiam L, Estrin-Serlui T, Dorling D, McKee M, Minton J. A deathly silence: why has the number of people found decomposed in England and Wales been rising? J R Soc Med 2024;117(5):172-181. Published 2023-11-21. Accessed 2026-10-08.Used for: uk-jrsm-2024-undefined-deaths-rising-1979-2020
- [166]Journal of Forensic and Legal Medicine (peer-reviewed; Dutch public health services). van den Hondel K et al. Undiscovered solitary deaths in the four largest cities in the Netherlands. J Forensic Leg Med 2020;74:102008 (PMID 33012310). Published 2020-07-05. Accessed 2026-10-08. (abstract only)Used for: nl-four-cities-2020-dsc14-incidence
- [167]Forensic Science International (Elsevier; peer-reviewed; University of Athens). Karydi C et al. Late discovery of bodies in indoor settings: A forensic practitioner's view on recognizing cases of social isolation in eastern Attica, Greece. Forensic Sci Int 2025;368:112395 (PMID 39929032). Published 2025-02-06. Accessed 2026-10-08. (abstract only)Used for: gr-attica-2025-late-discovery-indoor-profile
- [168]Journal of Forensic Sciences (peer-reviewed; Institute of Forensic Medicine, University of Vienna). Hönigschnabl S et al. Discovery of decomposed and mummified corpses in the domestic setting--a marker of social isolation? J Forensic Sci 2002;47(4):837-42 (PMID 12136994). Published 2002-07. Accessed 2026-10-08. (abstract only)Used for: at-vienna-2002-decomposed-at-home-1990s-vs-1960s
- [169]Science & Justice (Elsevier; peer-reviewed; Cranfield University). Giles SB, Errickson D, Márquez-Grant N. A retrospective comparative study to evaluate the reliability of post-mortem interval sources in UK and US medico-legal death investigations. Sci Justice 2022;62(2):246-261 (PMID 35277239). Published 2022-02-09. Accessed 2026-10-08. (abstract only)Used for: us-allegheny-2022-decomposition-cases-pmi-sources
- [170]Florence CS et al., Journal of the American Geriatrics Society (CDC authors). Medical Costs of Fatal and Nonfatal Falls in Older Adults (J Am Geriatr Soc 2018;66(4):693-698). Published 2018-03-07. Accessed 2026-10-08.Used for: us-fall-medical-costs-2015, us-fatal-fall-medical-costs-2015
- [171]University of Sheffield, Centre for Urgent and Emergency Care Research (CURE). The Long Lies Study. Published 2024-06-24. Accessed 2026-10-08.Used for: uk-one-in-five-falls-long-lie
- [172]BMC Geriatrics (BioMed Central). Falls in advanced old age: recalled falls and prospective follow-up of over-90-year-olds in the Cambridge City over-75s Cohort study (Fleming, Matthews, Brayne et al., BMC Geriatr 2008;8:6). Published 2008-03-17. Accessed 2026-10-08.Used for: fleming-bmc-2008-over-90-fall-rate-per-person-year