Key statistics
Key statistics on life expectancy after a fall
- More than one in five people who break a hip die within a year: across studies, the median is 22% (2026).
- Half of US veteran men aged 65 to 89 operated for a hip fracture in 2000-2010 were alive 2.2 years later (2023).
- Danish men who broke a hip at 71 to 80 (1977-2001) lived 4.2 more years on average, against 9.5 without one (2009).
- Of older adults taken to hospital by ambulance after a fall, 21.1% died within a year (2022).
- In England, Wales and Northern Ireland, 6.1% of hip-fracture patients died within 30 days in 2025, down from 10.9% in 2007.
- In England and Wales, 12.6% of hip-fracture patients from nursing homes died within 30 days in 2025, against 4.71% from their own home.
- Of people 60 and older with a fragility fracture of the pelvis, 17% died within a year and 46% within five years (2025).
- Only 40% to 60% of people who survive a hip fracture regain their previous mobility within a year (2016).
Sources: JAMA; Frontiers in Surgery; Acta Orthopaedica; Western Journal of Emergency Medicine; National Hip Fracture Database (2026, 2025); Injury; BMC Geriatrics
A fall in later life is often the start of something longer than the fall itself. It can bring a broken hip, pelvis or thigh bone, a bleed on the brain, weeks in hospital, a move into care, or a slow loss of confidence and strength. This page collects every published figure we could verify on what happens after a fall: how many older adults die within a month, a year and five years, how long people live after a broken hip and other fractures, what they die of, how hip-fracture outcomes differ between countries and over time, and how many walk again and go home. Every figure describes a group of patients, never one person.
01 / Hip fracture deaths
What percentage of hip fractures are fatal?
More than one in five people who break a hip die within a year: across studies, the median is 22% (JAMA, 2026).

- In the US, 26.9% of men and 18.5% of women died within a year of a hip fracture (2008-2017).
- In the three months after a hip fracture, men had 7.95 times the risk of death of men the same age; women 5.75 times (2010).
- In Ontario, 21.5% of women and 32.3% of men aged 66 and older died within a year of a hip fracture (2011-2015).
- In the US, 28.6% of Medicare patients died within a year of a hip fracture, against 12.6% of closely matched people without one (2005-2010).
| Age and gender | Died within a year |
|---|---|
| Women aged 75 | 13.67% (all women that age: 1.96%) |
| Men aged 75 | 25.99% (all men that age: 3.46%) |
| Women aged 80 | 17.23% (all women that age: 3.93%) |
| Men aged 80 | 30.07% (all men that age: 6.08%) |
| Women aged 85 | 24.62% (all women that age: 7.91%) |
| Men aged 85 | 43.2% (all men that age: 10.9%) |
How long people live after a hip fracture, in years, is in the section on life expectancy; how the figures compare between countries is in the section on countries.
Sources: JAMA; National Hip Fracture Database; Annals of Internal Medicine; BMC Musculoskeletal Disorders; The Journals of Gerontology, Series A; Wissenschaftliches Institut der AOK
More statistics (148)
The median one-year mortality rate after a hip fracture is 22%, according to a 2026 review of the evidence in JAMA (Johannesdottir et al., JAMA, 2026).
A hip fracture is the injury that most often follows a fall in later life, and the one with the most complete data. Most deaths come in the first months. Men die more often than women at every age, and the risk climbs steeply with age; compared with people of the same age who did not break a hip, the excess is largest in the first weeks and never quite disappears.
- In the US, 26.9% of men died within a year of a hip fracture in 2008-2017, according to a JAMA review (Johannesdottir et al., JAMA, 2026).
- 21.5% of women aged 66+ died within a year of a hip fracture in Ontario (fractures in 2011-2015), about four times the 5.1% of matched women without a fracture (Brown et al., BMC Musculoskeletal Disorders, 2021).
- 28.6% of US Medicare patients died within a year of a hip fracture, against 12.6% of closely matched older people without one (2005-2010) (Tajeu et al., Journals of Gerontology A, 2014).
- 35.4% of US veterans aged 65-89 died within a year of hip-fracture surgery, compared with an expected 6.3% among men of the same ages in the general population (Bernstein et al., Frontiers in Surgery, 2024).
- Mean one-year mortality after a hip fracture was 22.0% across recent studies from 36 countries (229,851 patients, published 2013-2017; range 2.4% to 34.8%) (Downey et al., World Journal of Orthopedics, 2019).
- 9.6% of older patients died within 30 days of hip-fracture surgery and 33% within one year (2,448 consecutive patients aged 60+, Nottingham) (Roche et al., BMJ, 2005).
- 10.5% of Finnish hip-fracture patients aged 65+ had died 30 days after surgery (428 patients, 1999-2000) (Panula et al., BMC Musculoskeletal Disorders, 2011).
- 21.5% of Finnish hip-fracture patients aged 65+ had died six months after surgery (428 patients, 1999-2000) (Panula et al., BMC Musculoskeletal Disorders, 2011).
- 27.3% of Finnish hip-fracture patients aged 65+ had died one year after surgery (428 patients, 1999-2000) (Panula et al., BMC Musculoskeletal Disorders, 2011).
- 48.8% of Finnish hip-fracture patients aged 65+ had died three years after surgery (428 patients, 1999-2000) (Panula et al., BMC Musculoskeletal Disorders, 2011).
- 73.6% of Finnish hip-fracture patients aged 65+ had died seven years after surgery (428 patients, 1999-2000) (Panula et al., BMC Musculoskeletal Disorders, 2011).
- 7.0% of 42,230 adults who had hip-fracture surgery in Ontario died within 30 days (2009-2014) (Pincus et al., JAMA, 2017).
- 26% of 74,396 Dutch hip-fracture patients aged 70+ died within a year, 9.1% within 30 days and 15% within 90 days (2018-2023) (Dijkstra et al., Acta Orthopaedica, 2025).
- 19.0% of Indian hip-fracture patients aged 50+ died within a year, 5.5 times the expected mortality of people of the same age and gender (3.7%) (George et al., Chinese Journal of Traumatology, 2023).
- Romanian hip-fracture patients had about 9.3 times the age-specific death rate of the general population over up to 7 years of follow-up, and 1,460 of 1,977 (73.9%) died (Bucharest region, 2018-2024) (Dobre et al., Archives of Osteoporosis, 2026).
- Hip (proximal femur) fractures had the highest mortality of 27 fracture locations in the Swedish Fracture Register: 25% at one year, 2.7 times the expected rate (2012-2018) (Bergh et al., Acta Orthopaedica, 2021).
- One-year mortality after a hip fracture in Sweden (25%) approaches that after a heart attack (about 33% in 2019) (Bergh et al., Acta Orthopaedica, 2021).
- 23.9% of patients operated on for a hip fracture at a French university hospital died within a year (309 patients, 2016-2017); 58.6% waited more than 48 hours for surgery (Huette et al., Scientific Reports, 2020).
- 9% of Japanese hip-fracture patients aged 50+ (68 of 759) died within 120 days, 25 of them within 30 days (2000) (Hasegawa et al., Journal of Orthopaedic Science, 2007).
- 32.7% of patients admitted with a hip fracture to a Barcelona hospital died within two years (911 deaths) (Barceló et al., Archives of Osteoporosis, 2021).
- 20.5% of older US adults without coronary heart disease died within six months of a hip fracture, and 30.2% of those with coronary heart disease (Cardiovascular Health Study) (Robbins et al., American Journal of Medicine, 2023).
- Among 6,896 hip-fracture patients aged 65+ in Lazio, Italy, the probability of dying was 7% by 30 days, 18% by 180 days and 30% by two years after admission (2006) (Castronuovo et al., BMC Geriatrics, 2011).
- In the US, 18.5% of women died within a year of a hip fracture in 2008-2017, according to a JAMA review (Johannesdottir et al., JAMA, 2026).
- 32.3% of men aged 66+ died within a year of a hip fracture in Ontario (fractures in 2011-2015), about five times the 6.0% of matched men without a fracture (Brown et al., BMC Musculoskeletal Disorders, 2021).
- 30.1% of women aged 66+ died within two years of a hip fracture in Ontario (fractures in 2011-2015), against 9.9% of matched women without any fracture (Brown et al., BMC Musculoskeletal Disorders, 2021).
- 43.0% of men aged 66+ died within two years of a hip fracture in Ontario (fractures in 2011-2015), against 12.1% of matched men without any fracture (Brown et al., BMC Musculoskeletal Disorders, 2021).
- 39.0% of women aged 66+ died within three years of a hip fracture in Ontario (fractures in 2011-2015), against 14.8% of matched women without any fracture (Brown et al., BMC Musculoskeletal Disorders, 2021).
- 52.9% of men aged 66+ died within three years of a hip fracture in Ontario (fractures in 2011-2015), against 17.8% of matched men without any fracture (Brown et al., BMC Musculoskeletal Disorders, 2021).
- Hip fractures accounted for 45.3% of the deaths within a year (6,625 deaths) among Ontario adults aged 66+ with a fragility fracture, though they made up only 26.5% of fragility fractures (2011-2015) (Brown et al., BMC Musculoskeletal Disorders, 2021).
- 24.6% of adults aged 66+ (6,625 of 26,963) died within a year of a fragility hip fracture in Ontario (2011-2015), against 5.3% in the whole matched group without a fracture (Brown et al., BMC Musculoskeletal Disorders, 2021).
- 27.9% of US patients aged 65+ died within a year of a first hip fracture, 4.86 times the rate in matched people without a fracture (2.77%) (TriNetX, 2004-2024) (Ghafarian et al., Injury, 2026).
- 23.9% of US patients aged 65+ died within a year of a first pertrochanteric hip fracture, 4.14 times the rate in matched people without a fracture (TriNetX, 2004-2024) (Ghafarian et al., Injury, 2026).
- 15.2% of US patients aged 65+ died within a year of a first subtrochanteric fracture (just below the hip), 2.98 times the rate in matched people without a fracture (TriNetX, 2004-2024) (Ghafarian et al., Injury, 2026).
- 41.6% of 404 hip-fracture patients aged 70+ died within three years in Umeå, Sweden (2000-2002 and 2008-2011) (Olofsson et al., BMC Geriatrics, 2023).
- 11.6% of US patients aged 65 to 90 died within a year of a first hip fracture, in a database study of 197,222 patients that left out those who died on the same day (Sun et al., Orthopedics, 2026).
By age and gender
- One year after a hip fracture, 74% of Danish women and 60% of Danish men were still alive (all hip fractures in Denmark, 1977-2001) (Vestergaard et al., Acta Orthopaedica, 2009).
- Men had 1.74 times the mortality of age-matched women after a hip fracture (95% CI 1.34-2.24), in a Geneva cohort followed for an average of 3.6 years (Trombetti et al., Osteoporosis International, 2002).
- One year after a fall-related hip fracture, men aged 65-74 in New South Wales had 82% of the survival expected for people of their age and gender (Hindmarsh et al., Osteoporosis International, 2009).
- One year after a fall-related hip fracture, women aged 65-74 in New South Wales had 90% of the survival expected for people of their age and gender (Hindmarsh et al., Osteoporosis International, 2009).
- One year after a fall-related hip fracture, men aged 85 and over in New South Wales had 65% of the survival expected for people of their age and gender (Hindmarsh et al., Osteoporosis International, 2009).
- One year after a fall-related hip fracture, women aged 85 and over in New South Wales had 80% of the survival expected for people of their age and gender (Hindmarsh et al., Osteoporosis International, 2009).
- Derived from Lee et al. (Frontiers in Surgery, 2023): 24.8% of US veterans (men aged 65-69) died within one year of hip-fracture surgery (75.2% were alive at one year).
- Derived from Lee et al. (Frontiers in Surgery, 2023): 29.6% of US veterans (men aged 70-74) died within one year of hip-fracture surgery (70.4% were alive at one year).
- Derived from Lee et al. (Frontiers in Surgery, 2023): 34.1% of US veterans (men aged 75-79) died within one year of hip-fracture surgery (65.9% were alive at one year).
- Derived from Lee et al. (Frontiers in Surgery, 2023): 38.8% of US veterans (men aged 80-84) died within one year of hip-fracture surgery (61.2% were alive at one year).
- Derived from Lee et al. (Frontiers in Surgery, 2023): 44.6% of US veterans (men aged 85-89) died within one year of hip-fracture surgery (55.4% were alive at one year).
- Derived from Bernstein et al. (Cureus, 2022): 14.5% of US women veterans (women aged 65-69) died within one year of hip-fracture surgery (85.51% were alive at one year).
- Derived from Bernstein et al. (Cureus, 2022): 16.5% of US women veterans (women aged 70-74) died within one year of hip-fracture surgery (83.53% were alive at one year).
- Derived from Bernstein et al. (Cureus, 2022): 23.3% of US women veterans (women aged 75-79) died within one year of hip-fracture surgery (76.67% were alive at one year).
- Derived from Bernstein et al. (Cureus, 2022): 28.9% of US women veterans (women aged 80-84) died within one year of hip-fracture surgery (71.08% were alive at one year).
- Derived from Bernstein et al. (Cureus, 2022): 27.9% of US women veterans (women aged 85-89) died within one year of hip-fracture surgery (72.12% were alive at one year).
- 37.1% of Danish men died within 12 months of a hip fracture, compared with 9.9% of men in the general population of the same age (all hip fractures in Denmark, 1999-2002) (Kannegaard et al., Age and Ageing, 2010).
- 26.4% of Danish women died within 12 months of a hip fracture, compared with 9.3% of women in the general population of the same age (all hip fractures in Denmark, 1999-2002) (Kannegaard et al., Age and Ageing, 2010).
- Men had 1.70 times the long-term mortality of women after a hip fracture, even after accounting for age, fracture site, medications and chronic illnesses, despite being 4 years younger at fracture (Denmark) (Kannegaard et al., Age and Ageing, 2010).
- 15% of men died within 30 days of hip-fracture surgery, almost twice the 8.2% of women (Nottingham, 2,448 patients aged 60+) (Roche et al., BMJ, 2005).
- Men had 1.55 times the age-adjusted mortality of women after hip-fracture surgery (Finland, 1999-2007) (Panula et al., BMC Musculoskeletal Disorders, 2011).
- Swedish women had an almost 30% lower risk than men of dying within a year of a hip fracture (2001-2016) (Lundin et al., Acta Orthopaedica, 2021).
- In the first year after a hip fracture, 31% of men and 17% of women died, and men had higher mortality than women at every age (Norway, 1986-1995) (Forsén et al., Osteoporosis International, 1999).
- Men under 75 had 4.2 times and women under 75 had 3.3 times the risk of dying within a year of a hip fracture compared with controls, against 3.1 and 1.6 at age 85 and over (Norway) (Forsén et al., Osteoporosis International, 1999).
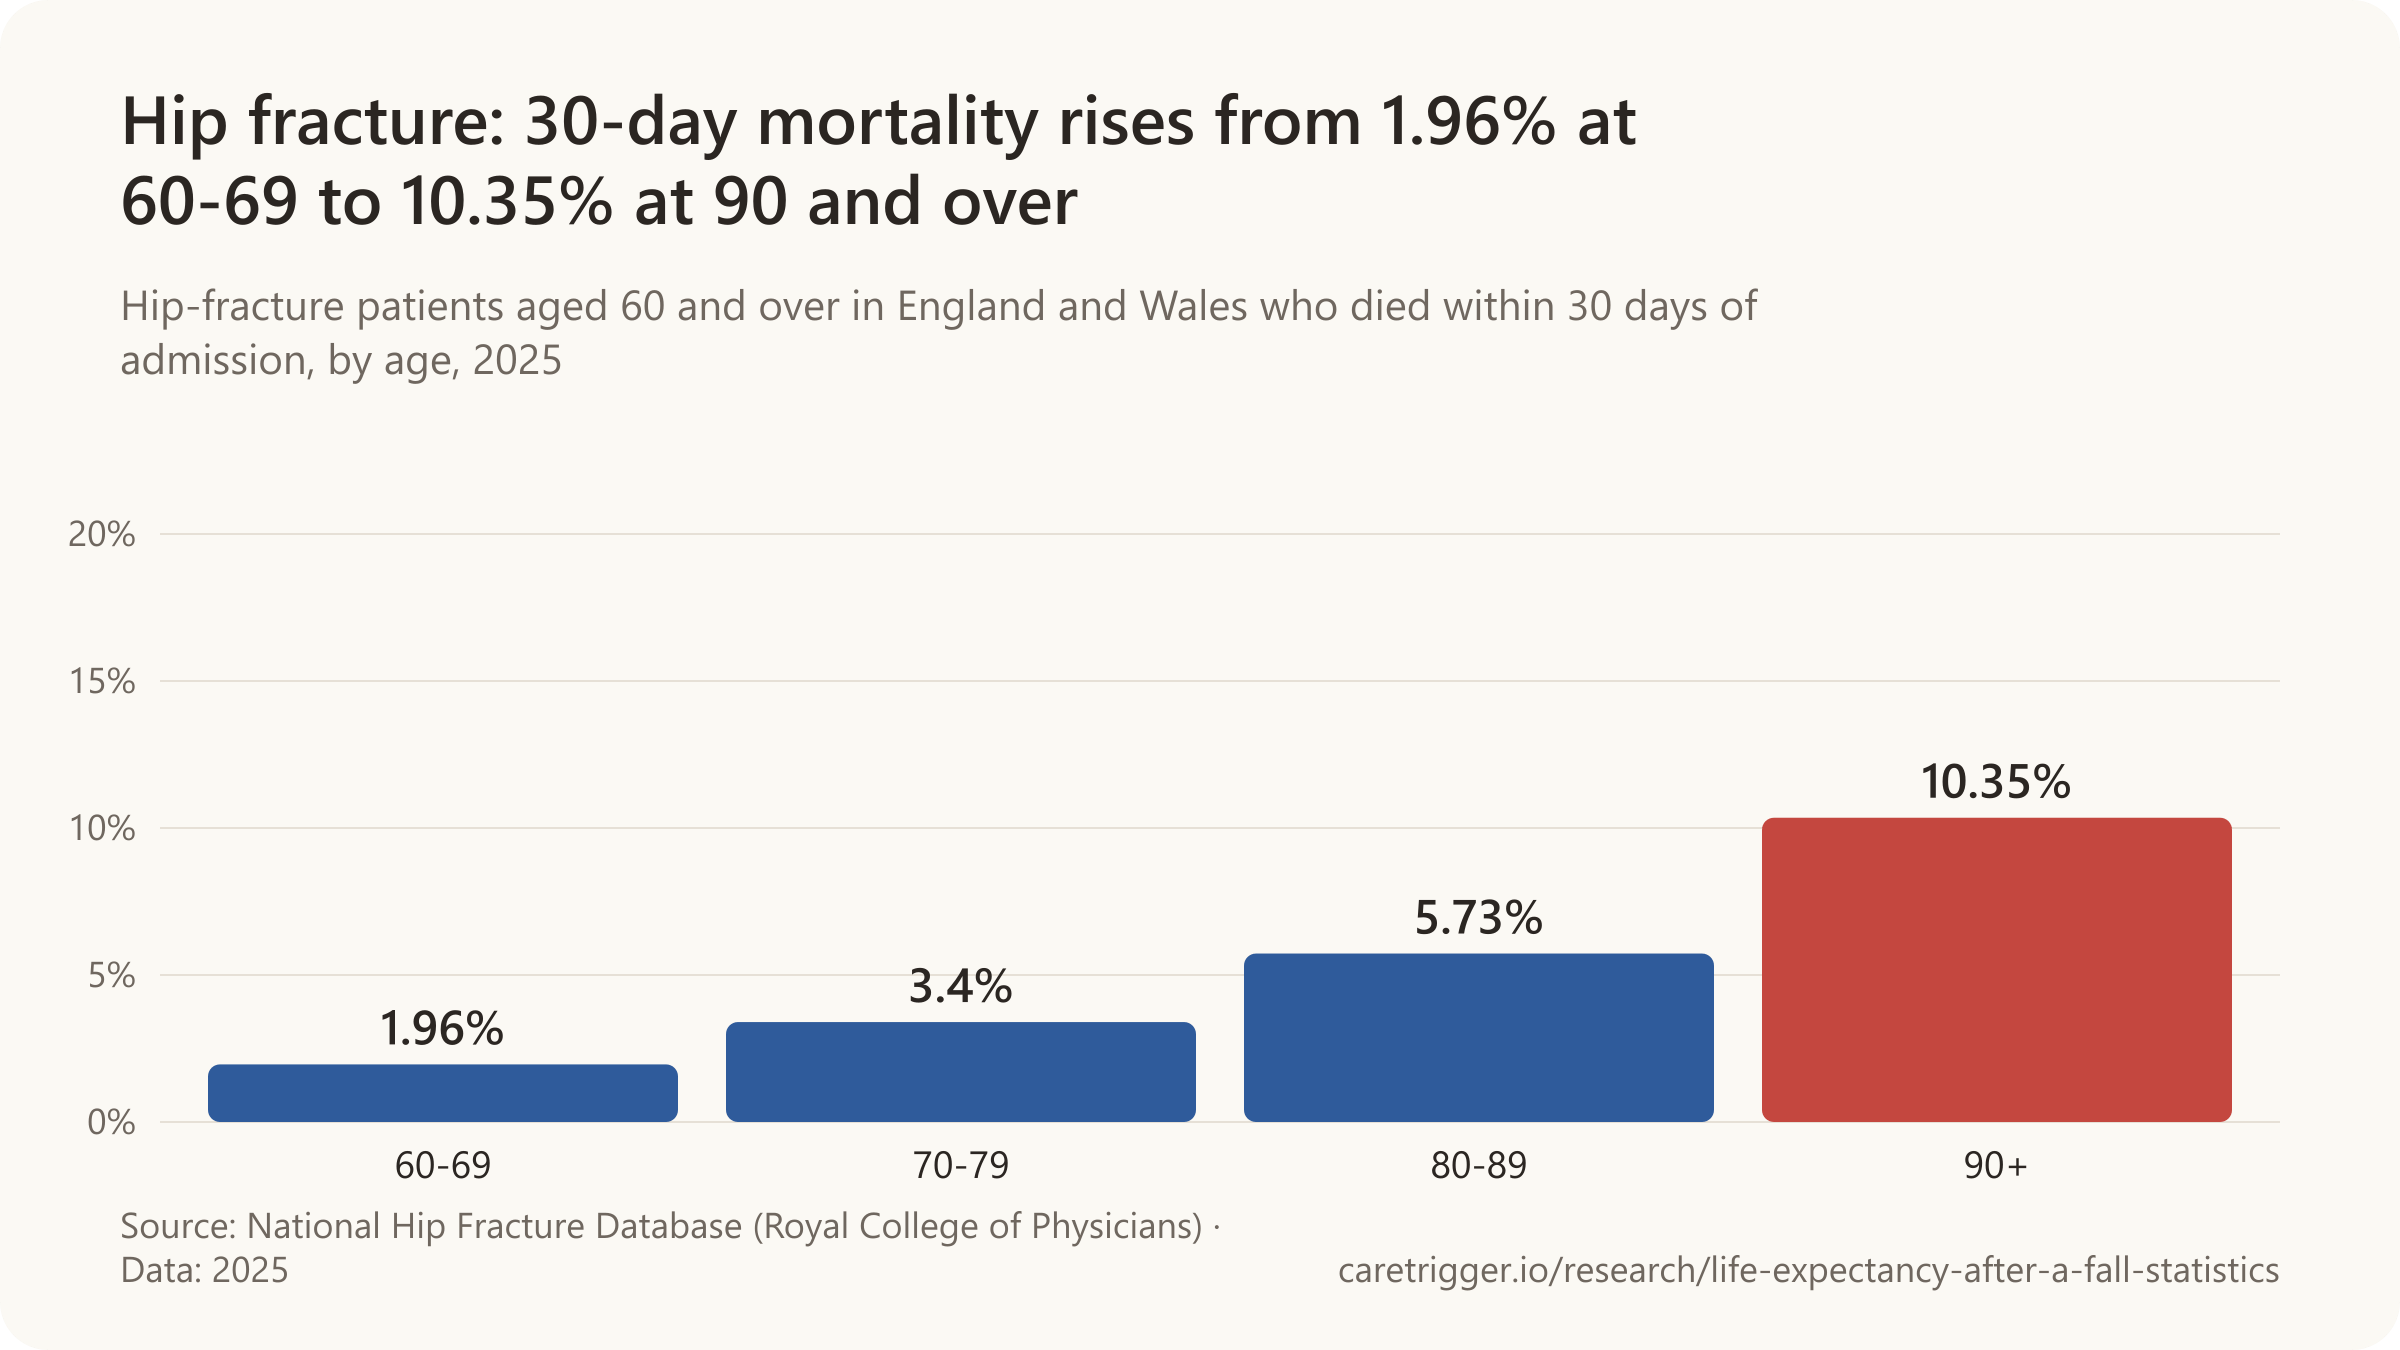
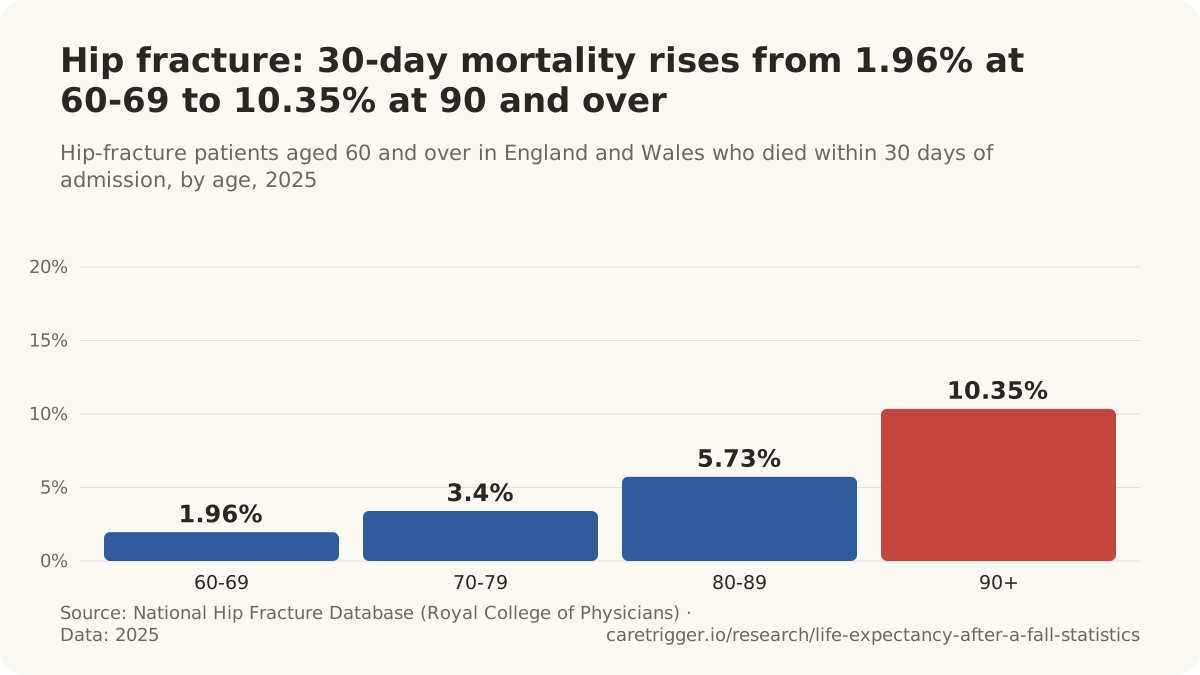
- 1.96% of hip-fracture patients aged 60 to 69 in England and Wales died within 30 days of admission in 2025 (National Hip Fracture Database, 2026).
- 3.4% of hip-fracture patients aged 70 to 79 in England and Wales died within 30 days of admission in 2025 (National Hip Fracture Database, 2026).
- 5.73% of hip-fracture patients aged 80 to 89 in England and Wales died within 30 days of admission in 2025 (National Hip Fracture Database, 2026).
- 10.35% of hip-fracture patients aged 90 and over in England and Wales died within 30 days of admission in 2025 (National Hip Fracture Database, 2026).
- 8.13% of men aged 60 and over admitted with a hip fracture in England and Wales died within 30 days in 2025 (National Hip Fracture Database, 2026).
- 4.68% of women aged 60 and over admitted with a hip fracture in England and Wales died within 30 days in 2025 (National Hip Fracture Database, 2026).
- In Sweden, 18% of women aged 80+ with a hip fracture had died four months later, and 36% of those who had lived in a care home before the fracture (RIKSHÖFT, 2025).
- In Sweden, 23% of men aged 80+ with a hip fracture had died four months later, compared with 18% of women the same age (RIKSHÖFT, 2025).
- In Sweden, 10.6% of men and 6.2% of women with a hip fracture died within 30 days in 2022-2023 (Swedish Fracture Register, 2024).
- In Germany, 13.67% of women aged 75 died within a year of hip-fracture surgery, compared with 1.96% of all women the same age (WIdO, 2018).
- In Germany, 25.99% of men aged 75 died within a year of hip-fracture surgery, compared with 3.46% of all men the same age (WIdO, 2018).
- In Germany, 17.23% of women aged 80 died within a year of hip-fracture surgery, compared with 3.93% of all women the same age (WIdO, 2018).
- In Germany, 30.07% of men aged 80 died within a year of hip-fracture surgery, compared with 6.08% of all men the same age (WIdO, 2018).
- In Germany, 24.62% of women aged 85 died within a year of hip-fracture surgery, compared with 7.91% of all women the same age (WIdO, 2018).
- In Germany, 43.2% of men aged 85 died within a year of hip-fracture surgery, compared with 10.9% of all men the same age (WIdO, 2018).
- In Germany, 35.27% of women aged 90 died within a year of hip-fracture surgery, compared with 15.18% of all women the same age (WIdO, 2018).
- In Poland, between 30.5% and 32.8% of men and between 26.2% and 28.0% of women aged 50+ died within a year of a femoral neck fracture each year from 2008 to 2015 (Glinkowski et al., Journal of Clinical Medicine, 2019).
- In Poland, between 30.4% and 33.9% of men and between 29.8% and 32.1% of women aged 50+ died within a year of a pertrochanteric hip fracture each year from 2008 to 2015 (Glinkowski et al., Journal of Clinical Medicine, 2019).
- In Canada, men were 1.3 times as likely as women to die of any cause within 12 months of a hip fracture (Public Health Agency of Canada, 2024).
- In US NSQIP hospitals, 9.6% of men and 5.6% of women died within 30 days of hip-fracture surgery, 2011-2017 (Rhayem et al., Journal of Clinical Endocrinology and Metabolism, 2025).
- In US hospitals, 16.35 per 1,000 hip-fracture admissions of women aged 65+ ended in death in hospital (about 1.6%), pooled 2020-2022 data (Agency for Healthcare Research and Quality, 2025).
- In US hospitals, 28.38 per 1,000 hip-fracture admissions of men aged 65+ ended in death in hospital (about 2.8%), pooled 2020-2022 data (Agency for Healthcare Research and Quality, 2025).
- In US hospitals, 11.06 per 1,000 hip-fracture admissions of patients aged 65-74 ended in death in hospital (about 1.1%), pooled 2020-2022 data (Agency for Healthcare Research and Quality, 2025).
- In US hospitals, 22.55 per 1,000 hip-fracture admissions of patients aged 75+ ended in death in hospital (about 2.3%), pooled 2020-2022 data (Agency for Healthcare Research and Quality, 2025).
Compared with people of the same age
- In the first three months after a hip fracture, men had 7.95 times the risk of dying from any cause of men of the same age without a fracture (meta-analysis of 17 cohorts) (Haentjens et al., Annals of Internal Medicine, 2010).
- For every six women and every three men with a hip fracture, one death occurred above the number expected in the general population (Dubbo, Australia, 1989-2010) (Frost et al., Bone, 2013).
- Five-year relative survival after osteoporotic hip-fracture surgery was 93.9%, comparable to breast cancer (91.0%), with 5-year absolute survival of 63.0%, in 727 Korean patients (Lee et al., JCEM, 2014).
- In the first three months after a hip fracture, women had 5.75 times the risk of dying from any cause of women of the same age without a fracture (meta-analysis of 22 cohorts) (Haentjens et al., Annals of Internal Medicine, 2010).
- 1 year after a hip fracture at age 80, white women in the US had an estimated excess mortality of 8% over women of the same age without a fracture (life-table estimate from a meta-analysis) (Haentjens et al., Annals of Internal Medicine, 2010).
- 2 years after a hip fracture at age 80, white women in the US had an estimated excess mortality of 11% over women of the same age without a fracture (life-table estimate from a meta-analysis) (Haentjens et al., Annals of Internal Medicine, 2010).
- 5 years after a hip fracture at age 80, white women in the US had an estimated excess mortality of 18% over women of the same age without a fracture (life-table estimate from a meta-analysis) (Haentjens et al., Annals of Internal Medicine, 2010).
- 10 years after a hip fracture at age 80, white women in the US had an estimated excess mortality of 22% over women of the same age without a fracture (life-table estimate from a meta-analysis) (Haentjens et al., Annals of Internal Medicine, 2010).
- 1 year after a hip fracture at age 80, white men in the US had an estimated excess mortality of 18% over men of the same age without a fracture (life-table estimate from a meta-analysis) (Haentjens et al., Annals of Internal Medicine, 2010).
- 2 years after a hip fracture at age 80, white men in the US had an estimated excess mortality of 22% over men of the same age without a fracture (life-table estimate from a meta-analysis) (Haentjens et al., Annals of Internal Medicine, 2010).
- 5 years after a hip fracture at age 80, white men in the US had an estimated excess mortality of 26% over men of the same age without a fracture (life-table estimate from a meta-analysis) (Haentjens et al., Annals of Internal Medicine, 2010).
- 10 years after a hip fracture at age 80, white men in the US had an estimated excess mortality of 20% over men of the same age without a fracture (life-table estimate from a meta-analysis) (Haentjens et al., Annals of Internal Medicine, 2010).
- Of 100 white US women who break a hip at 80, an estimated 13 would die within 1 year, against 5 of 100 women of the same age without a fracture (life-table model) (Haentjens et al., Annals of Internal Medicine, 2010).
- Of 100 white US women who break a hip at 80, an estimated 45 would die within 5 years, against 26 of 100 women of the same age without a fracture (life-table model) (Haentjens et al., Annals of Internal Medicine, 2010).
- Of 100 white US women who break a hip at 80, an estimated 78 would die within 10 years, against 55 of 100 women of the same age without a fracture (life-table model) (Haentjens et al., Annals of Internal Medicine, 2010).
- Of 100 white US men who break a hip at 80, an estimated 25 would die within 1 year, against 7 of 100 men of the same age without a fracture (life-table model) (Haentjens et al., Annals of Internal Medicine, 2010).
- Of 100 white US men who break a hip at 80, an estimated 60 would die within 5 years, against 34 of 100 men of the same age without a fracture (life-table model) (Haentjens et al., Annals of Internal Medicine, 2010).
- Of 100 white US men who break a hip at 80, an estimated 87 would die within 10 years, against 66 of 100 men of the same age without a fracture (life-table model) (Haentjens et al., Annals of Internal Medicine, 2010).
- A hip fracture was associated with twice the risk of death from any cause (HR 2.12), 2.39 in men and 1.92 in women, in eight cohorts of older people in Europe and the USA followed for 12.6 years (Katsoulis et al., Journal of Internal Medicine, 2017).
- Excess mortality in the first year after a hip fracture, over and above that of people without one, ranged from 8.4% to 36% across studies (systematic review) (Abrahamsen et al., Osteoporosis International, 2009).
- Danish hip-fracture patients had twice the death rate of age- and gender-matched people without a fracture (HR 2.26), and the excess persisted for as long as 20 years (169,145 patients, 1977-2001) (Vestergaard et al., Osteoporosis International, 2007).
- UK men had 3.5 times and women 2.4 times the one-year mortality of matched people without a hip fracture, a gap that did not narrow between 2000 and 2010 (Klop et al., Bone, 2014).
- Age- and gender-standardised mortality of Finnish hip-fracture patients was 3.26 times that of the general population aged 65+ over nine years (173 vs 53 deaths per 1,000 person-years) (Panula et al., BMC Musculoskeletal Disorders, 2011).
- 16.9% of US women died in the year after a hip fracture, twice the 8.4% of age-matched women without one (Study of Osteoporotic Fractures) (LeBlanc et al., Archives of Internal Medicine, 2011).
- Women aged 65 to 70 who broke a hip had a one-year mortality of 16.3%, against 3.7% of women the same age without a fracture (OR 5.0) (LeBlanc et al., Archives of Internal Medicine, 2011).
- Women aged 70 to 79 who broke a hip had a one-year mortality of 16.5%, against 8.9% of women the same age without a fracture (OR 2.4) (LeBlanc et al., Archives of Internal Medicine, 2011).
- Even women aged 80+ in good or excellent health had higher one-year mortality after a hip fracture: 15.1% against 7.2% of comparable women without one (OR 2.8) (LeBlanc et al., Archives of Internal Medicine, 2011).
- After accounting for pre-fracture health, function and illnesses, US older adults had 6.28 times the risk of death in the six months after a hip fracture, but no increased risk afterwards (HR 1.04) (Tosteson et al., Osteoporosis International, 2007).
- Korean patients operated on for a hip fracture had about twice the death rate of matched people from the general population (adjusted HR 2.07) for up to 11 years, with higher death rates from almost every major cause (Choi et al., Bone & Joint Journal, 2018).
- In the year after a first hip fracture, Norwegian men died at 4.6 times and women at 2.8 times the rate of the general population, and the excess lasted for twelve years (81,867 patients, 1999-2008) (Omsland et al., Bone, 2014).
- After adjusting for age, education, illness and disability, women aged 70+ who broke a hip had 9 more deaths per 100 within five years than women without a fracture, and 14 more per 100 among the healthiest women (Magaziner et al., American Journal of Public Health, 1997).
- After a hip fracture, women in the Dubbo study died at 2.43 times and men at 3.51 times the age-adjusted rate of the general population, and the excess lasted up to 10 years (Bliuc et al., JAMA, 2009).
Types of hip fracture
- Intertrochanteric (extracapsular) fractures make up 48% of hip fractures (Johannesdottir et al., JAMA, 2026).
- Femoral neck (intracapsular) fractures make up 34% of hip fractures (Johannesdottir et al., JAMA, 2026).
- Subtrochanteric (extracapsular) fractures make up 5.8% of hip fractures (Johannesdottir et al., JAMA, 2026).
Other studies
- After a hip fracture, women in the Dubbo study died on average 4 years earlier than expected (median 4.1 years) and men 5 years earlier (median 4.8 years) (Frost et al., Bone, 2013).
- Men had 2.2 times the relative excess risk of death of women after a fall-related hip fracture (95% CI 2.03-2.38), among 16,836 patients aged 65+ in New South Wales (Hindmarsh et al., Osteoporosis International, 2009).
- Danish hip-fracture patients had an excess mortality of 19% in the first year after the fracture (relative survival 0.81 against matched controls), then 1.8% more for every additional year (Vestergaard et al., Osteoporosis International, 2007).
- Mean one-year mortality after a hip fracture in recent studies from Europe (22 studies) was 23.3% (studies published 2013-2017) (Downey et al., World Journal of Orthopedics, 2019).
- Mean one-year mortality after a hip fracture in recent studies from Asia (10 studies) was 17.9% (studies published 2013-2017) (Downey et al., World Journal of Orthopedics, 2019).
- Mean one-year mortality after a hip fracture in recent studies from the United States (one Kaiser Permanente study) was 21% (studies published 2013-2017) (Downey et al., World Journal of Orthopedics, 2019).
- Mean one-year mortality after a hip fracture in recent studies from Australia (one New South Wales study) was 24.9% (studies published 2013-2017) (Downey et al., World Journal of Orthopedics, 2019).
- Mean one-year mortality after a hip fracture in recent studies from South America (two small studies) was 26.8% (studies published 2013-2017) (Downey et al., World Journal of Orthopedics, 2019).
- A 2019 review concluded that the traditionally quoted figures of 10% mortality at one month and 30% at one year after a hip fracture may be outdated, with about 22% at one year a more accurate current estimate (Downey et al., World Journal of Orthopedics, 2019).
- Hip-fracture patients whose fracture came from a fall indoors had 1.46 times the long-term mortality of those who fell outdoors, and each extra fall in the previous year was associated with a slightly higher risk (HR 1.035) (Barcelona) (Barceló et al., Aging Clinical and Experimental Research, 2023).
- Thirty-day mortality after a hip fracture in Wales was 7.9% at the start of 2012 and 7.8% at the end of 2017, showing no improvement over the period (National Hip Fracture Database, 2018).
- Before the COVID-19 pandemic, 30-day mortality after a hip fracture in England was 6.6%, below the 7.1% average across the countries of the ICCONIC comparison study (National Hip Fracture Database, 2022).
- In Sweden, 23% of adults with a hip fracture diagnosed in 2023 (3,400 of 14,734) died within one year: 27% of men and 21% of women (Swedish Fracture Register, 2025).
- In Sweden, about 8% of people over 60 operated on for an unstable hip fracture died within 30 days in 2023-2025 (Swedish Fracture Register, 2026).
- On average, 7.1% of people aged 65+ admitted with a hip fracture died within 30 days across nine high-income countries in the ICCONIC comparison (Papanicolas et al., Health Services Research, 2021).
- Fewer than a third of men aged 66+ were still alive five years after a hip fracture in Ontario (fractures in 2011-2015) (Vincent et al., JBMR Plus, 2024).
- Fewer than half of women aged 66+ were still alive five years after a hip fracture in Ontario (fractures in 2011-2015) (Vincent et al., JBMR Plus, 2024).
- 17.9% of men aged 86 and over were still alive five years after a hip fracture in Ontario (fractures in 2011-2015) (Vincent et al., JBMR Plus, 2024).
- 56.5% of men aged 86 and over were still alive one year after a hip fracture in Ontario (fractures in 2011-2015) (Vincent et al., JBMR Plus, 2024).
- 30.0% of women aged 86 and over were still alive five years after a hip fracture in Ontario (fractures in 2011-2015) (Vincent et al., JBMR Plus, 2024).
- 70.8% of women aged 86 and over were still alive one year after a hip fracture in Ontario (fractures in 2011-2015) (Vincent et al., JBMR Plus, 2024).
- Among matched people aged 66+ of the same age group, gender and health but without a fracture, 64.8% to 83.4% were alive after five years, lowest in the oldest people matched to hip-fracture patients (Ontario) (Vincent et al., JBMR Plus, 2024).
- The steepest drop in survival came within the first month after a hip, spine or other major (proximal) fragility fracture, in both men and women aged 66+ (Ontario, 2011-2015) (Vincent et al., JBMR Plus, 2024).
- Men aged 86 and over had a five-year survival after a hip fracture of 34.5% of that of matched men without a fracture (relative survival ratio) (Ontario, 2011-2015) (Vincent et al., JBMR Plus, 2024).
- Men aged 66 to 85 had a five-year survival after a hip fracture of 51.9% to 63.9% of that of matched men without a fracture, depending on age (relative survival ratio) (Ontario, 2011-2015) (Vincent et al., JBMR Plus, 2024).
- Women aged 86 and over had a five-year survival after a hip fracture of 52.8% of that of matched women without a fracture (relative survival ratio) (Ontario, 2011-2015) (Vincent et al., JBMR Plus, 2024).
- Women aged 66 to 85 had a five-year survival after a hip fracture of 69.8% to 79.0% of that of matched women without a fracture, depending on age (relative survival ratio) (Ontario, 2011-2015) (Vincent et al., JBMR Plus, 2024).
- To compare with five-year relative survival of 52% to 69% for men aged 66-85 after a hip or spine fracture, the authors cite Ontario five-year relative survival of 94% for prostate cancer, 89% for breast cancer and 43% for any cancer at age 80+ (Vincent et al., JBMR Plus, 2024).
- An editorial on the Ontario study summed it up as fewer than a third of men and half of women surviving five years after a hip fracture, far below survival after prostate or breast cancer (Cawthon & Drake, JBMR Plus, 2024).
Why the numbers disagree. Published one-year death rates after a hip fracture run from about one in nine to one in three, and most of the gap is about who is counted. JAMA's 22% is a median across many studies. A 2026 US database study found 11.6%, but it left out people over 90, anyone with an earlier hip fracture and those who died on the same day. Registries count deaths from admission (England, Wales and Northern Ireland; Australia and New Zealand) or from surgery (Denmark), include everyone or only those operated on, and start at age 50, 60 or 65. Deaths after discharge are easy to miss: in the Dutch audit, 90-day mortality was 4.2% from hospital records alone and 12.5% once national death records were linked. And the patients differ: men die more often than women at every age, and people from care homes far more often than people from their own home.
Numbers we will not publish. "Half of older people who break a hip die within a year" has no source we could find: national registries put one-year mortality at 18.2% to 27.6%, and half or more die only among centenarians, people who lived in a Danish care home and men of 90 in Germany. "One in three adults over 50 die within a year" is attributed to a European study that reports hazard ratios, not a share. "Up to 50% die within six months" is contradicted by the six-month figures on this page (21.5% in Finland, 18% in Lazio). The "traditional" 10% at a month and 30% at a year are called outdated by the 2019 review that reports a 22% global mean. "Seventy percent die without surgery" traces to no study we could find; non-operative cohorts vary widely with the setting. "Thirty-day mortality is 20% to 25% at 90" is contradicted by a study of people in their 90s, where it was 8.6% and 10.3%. "Each hour of delay raises the risk of death by 6.6%" confuses hours with days: the study we cite finds about 6% for each extra day before admission. And "a hip fracture is deadlier than breast cancer" turns a Korean study's finding of comparable five-year relative survival into a ranking. If you have a source for any of these, tell us through the support page.
Sources: JAMA (2009, 2017, 2026); BMC Musculoskeletal Disorders (2011, 2021); The Journals of Gerontology, Series A; Frontiers in Surgery (2023, 2024); World Journal of Orthopedics; BMJ; Acta Orthopaedica (2009, 2021, 2025); Chinese Journal of Traumatology; Archives of Osteoporosis (2021, 2026); Scientific Reports; Journal of Orthopaedic Science; The American Journal of Medicine; BMC Geriatrics (2011, 2023); Injury; Orthopedics; Osteoporosis International (1999-2009); Cureus; Age and Ageing; National Hip Fracture Database (2018, 2022, 2026); RIKSHÖFT; Swedish Fracture Register (2024, 2025, 2026); Wissenschaftliches Institut der AOK; Journal of Clinical Medicine; Public Health Agency of Canada; Journal of Clinical Endocrinology and Metabolism; Agency for Healthcare Research and Quality; Annals of Internal Medicine (2010); Bone (2013, 2014); The Journal of Clinical Endocrinology & Metabolism; Journal of Internal Medicine; Archives of Internal Medicine; The Bone & Joint Journal; American Journal of Public Health; Aging Clinical and Experimental Research; Health Services Research; JBMR Plus (2024)
02 / After any fall
What is the life expectancy of elderly people after a fall?
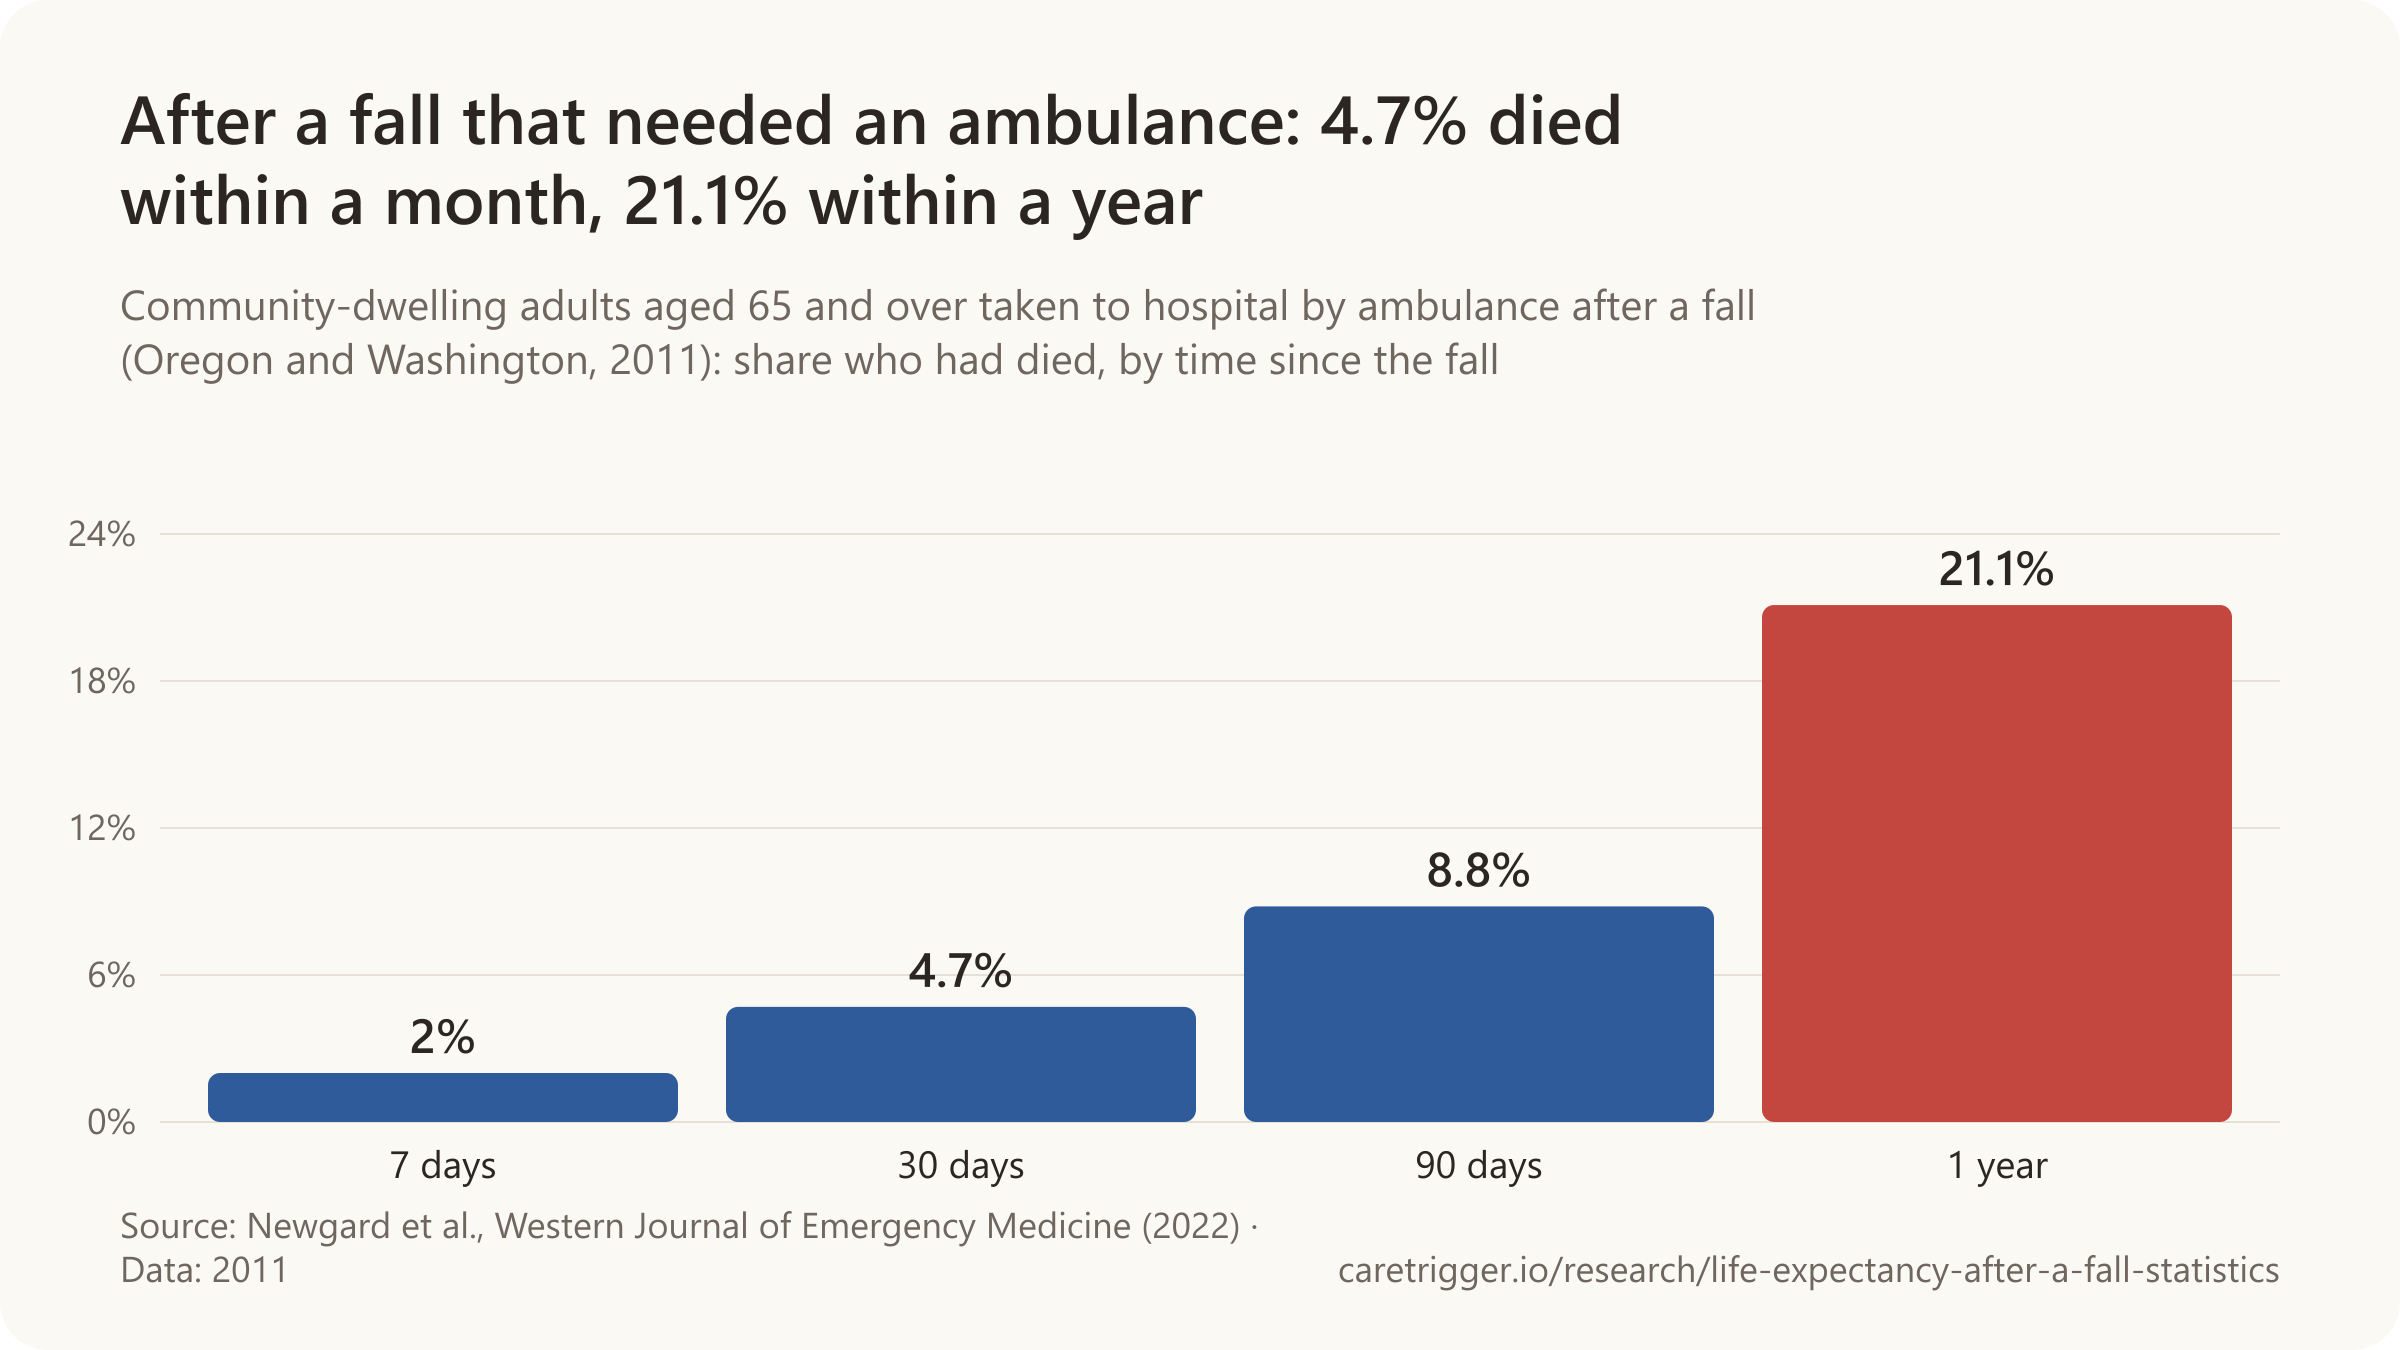
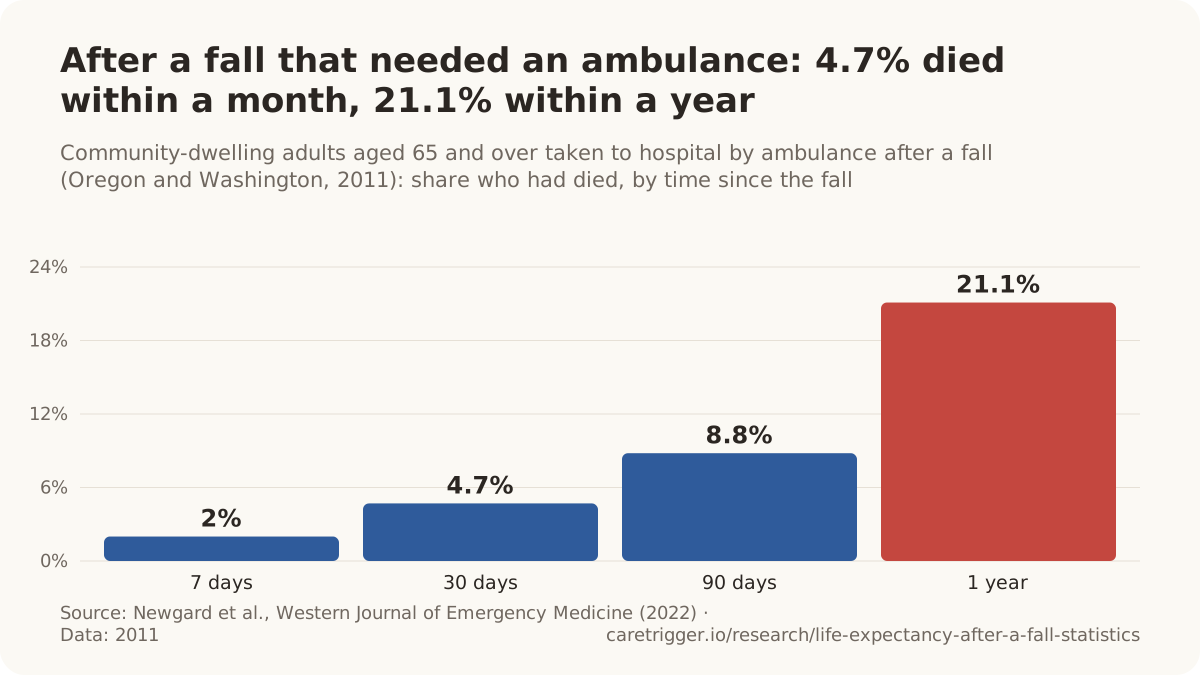
Of older adults taken to hospital by ambulance after a fall, 21.1% died within a year (Western Journal of Emergency Medicine, 2022).

- In Denmark, 16% of people 67 and older who came to an emergency department with a fall died within a year (2013).
- Of patients 65 and older seen in a Boston emergency department after a fall, 15% died within a year (2005-2011).
- One in three (33%) patients over 65 admitted to a trauma centre after a fall from standing height died within a year (2014).
- A quarter of older people who fell at home (32 of 125) died within a year, against 8 in a matched group (1981).
- Six months after an emergency visit for a fall, 12.4% of men 65 and older had died, against 5.2% of women (2023).
| Setting, place and age | Died within 30 days |
|---|---|
| Admitted with a fall injury, New South Wales (50 and older, non-Indigenous) | 4.2% |
| Seen in an emergency department after a fall, Boston (65 and older) | 4.4% |
| Taken to hospital by ambulance after a fall, Oregon and Washington (65 and older) | 4.7% |
| Admitted with a fall injury, New South Wales (65 and older, urban) | 4.9% |
| Care-home residents sent to an emergency department after a fall, Ontario (65 and older) | 10.3% |
| Trauma patients after a fall from under one metre, Stavanger, Norway (over 60) | 13% |
No study gives a life expectancy after a fall in years: falls range from a stumble with no injury to a broken hip or a bleed on the brain. The figures here are deaths within a set time after a fall that needed care; the injury sections below go further, and the long-lie page covers the hours spent on the floor.
Sources: Western Journal of Emergency Medicine; Age and Ageing; American Journal of Emergency Medicine; Journal of Trauma and Acute Care Surgery; British Medical Journal; Journal of the American Geriatrics Society; Medical Journal of Australia; Australian and New Zealand Journal of Public Health; Journal of the American Medical Directors Association; European Journal of Trauma and Emergency Surgery
More statistics (37)
21.1% of community-dwelling adults aged 65+ taken to hospital by ambulance after a fall died within one year (665 of 3,159), and 4.7% within 30 days (Newgard et al., Western Journal of Emergency Medicine, 2022; Oregon and Washington, 2011).
A fall that brings an older person to an emergency department is often a sign of frailty as much as a cause of death, so these figures mix the injury with the health that came before it. They differ with the setting: people seen and sent home from an emergency department die less often than people taken by ambulance, and those admitted to a trauma centre more often still.
- 16% of people aged 67+ who came to an emergency department in Denmark with a fall in 2013 died within a year (5,760 of 35,997), in a nationwide registry study (Katsiferis et al., Age and Ageing, 2023).
- 15% of 21,340 patients aged 65+ seen in an emergency department after a fall died within one year (3,235 deaths), rising from 1.2% at 3 days and 4.4% at 30 days (Liu et al., American Journal of Emergency Medicine, 2015; Boston, 2005-2011).
- One third (33%) of patients over 65 admitted to a trauma centre after a fall from standing height died within a year, and 24% of those discharged alive (Ayoung-Chee et al., Journal of Trauma and Acute Care Surgery, 2014; Seattle, 1,352 admissions).
- Six months after an emergency department visit for a fall, 12.4% of men aged 65+ had died versus 5.2% of women (HR 2.48), in 1,315 patients (median age 81) at five Spanish hospitals (Miro et al., Journal of the American Geriatrics Society, 2023).
- In the first month after an emergency visit for a fall, older men had 4.18 times the risk of death of older women after adjustment for age and other differences (Miro et al., Journal of the American Geriatrics Society, 2023; Spain).
- Over a median follow-up of 6.2 years after an emergency department visit for a fall, 51% of 1,464 patients aged 65+ died, at a median of 3.2 years after the visit (Garcia-Martinez et al., European Geriatric Medicine, 2024; Spain).
- 4.4% of patients aged 65+ seen in an emergency department after a fall (935 of 21,340) died within 30 days (Liu et al., American Journal of Emergency Medicine, 2015; Boston, 2005-2011).
- 12% of patients over 65 admitted to a level I trauma centre after a ground-level fall died during the admission; 48% had severe injuries (ISS above 15) (Ayoung-Chee et al., Journal of Trauma and Acute Care Surgery, 2014).
- 20.3% of 15,649 injured adults aged 65+ taken to hospital by ambulance (84.5% after a fall) died within a year; mortality was 1.6% in hospital, 5.1% at 30 days and 9.4% at 90 days (Newgard et al., Injury, 2019).
- 10.3% of long-term care residents aged 65+ in Ontario who were sent to an emergency department after a fall died within 30 days (5,794 of 56,419, 2010-2019) (Yin et al., Journal of the American Medical Directors Association, 2024).
- Among 80 community deaths attributed to a fall in a Chinese city (2020-2024), the median time from the fall to death was 5 months (interquartile range 1 to 22.5 months) (Zhuang et al., SAGE Open Medicine, 2026).
- 45.3% of US adults aged 65+ who reported a fall injury in the National Health Interview Survey (2006-2017) died during up to 12 years of follow-up (Adeyemi et al., Healthcare, 2025).
- 15.5% of patients aged 70+ seen in two Dutch emergency departments after a fall had died within 12 months (61 of 393), and 6.6% within 3 months (Blomaard et al., Scandinavian Journal of Trauma, Resuscitation and Emergency Medicine, 2021).
- 2.0% of community-dwelling adults aged 65+ taken to hospital by ambulance after a fall died within 7 days (63 of 3,159) (Newgard et al., Western Journal of Emergency Medicine, 2022).
- 4.7% of community-dwelling adults aged 65+ taken to hospital by ambulance after a fall died within 30 days (147 of 3,159) (Newgard et al., Western Journal of Emergency Medicine, 2022).
- 8.8% of community-dwelling adults aged 65+ taken to hospital by ambulance after a fall died within 90 days (277 of 3,159) (Newgard et al., Western Journal of Emergency Medicine, 2022).
- After an ambulance-attended fall, older women had about half the odds of dying within a year that older men had (OR 0.49) (Newgard et al., Western Journal of Emergency Medicine, 2022).
- 2.6% of 350 patients aged 65+ seen in a Boston emergency department after a fall died within six months (Sri-On et al., Annals of Emergency Medicine, 2017).
Admitted to hospital or a trauma centre
- Trauma patients had 1.75 times the odds of dying within 12 months after a fall from under half a metre (including falls from standing) than after other blunt trauma of similar severity (95% CI 1.18-2.58), in the Singapore National Trauma Registry (Wong et al., PLoS One, 2015).
- 2.4% of men and 1.3% of women aged 60+ admitted to hospital in Victoria, Australia with a fall-related injury died in hospital (2018/19-2022/23, 187,878 admissions) (Berecki-Gisolf et al., Frontiers in Public Health, 2024).
- Women admitted with a fall injury had 41% lower odds of dying in hospital than men after adjusting for age, fall details, injury type and complexity (OR 0.59) (Berecki-Gisolf et al., Frontiers in Public Health, 2024; Victoria, Australia).
- 4.9% of urban and 5.0% of rural New South Wales residents aged 65+ hospitalised for a fall-related injury died within 30 days (Sukumar et al., Australian and New Zealand Journal of Public Health, 2016; linked data 2003-2012).
- 4.2% of non-Indigenous and 2.9% of Aboriginal people aged 50+ hospitalised in New South Wales for a fall-related injury died within 30 days (Lukaszyk et al., Medical Journal of Australia, 2017; 312,758 admissions, 2003-2012).
- In-hospital mortality after a fall from standing height was 5.5% for trauma patients over 90, against 0.9% for those under 60, although injuries were of similar severity (Bhattacharya et al., Injury, 2016; Yale level I trauma centre, 2003-2013).
- 13% of trauma patients over 60 injured in a fall from less than one metre died within 30 days (Aarsland et al., European Journal of Trauma and Emergency Surgery, 2024; Stavanger, Norway, 2011-2020).
- In-hospital mortality after a fall from standing height was 4.4% for US trauma patients over 70, versus 1.6% for younger patients (Spaniolas et al., Journal of Trauma, 2010; National Trauma Data Bank, 57,302 patients).
Fallers compared with people who did not fall
- One quarter of 125 home fallers aged 65+ (32) died within one year, compared with 8 people in an age- and gender-matched control group (Wild, Nayak & Isaacs, BMJ, 1981).
- In Table IV of Wild, Nayak & Isaacs (BMJ, 1981), 11 of 20 fallers with a 'long lie' after the fall (55%) had died within one year, versus 21 of 105 without (20%).
- Half of the home fallers who lay on the floor for more than one hour died within six months of the fall (Wild, Nayak & Isaacs, BMJ, 1981).
- One-year mortality was 11% (17) among fallers unable to get up vs 5% (9) among fallers able to get up and 6% (47) among non-fallers; the trend was not statistically significant (Tinetti, Liu & Claus, JAMA, 1993, Table 5).
- Women aged 75+ who fell at least twice during one year had 1.6 times the risk of dying over the next nine years (95% CI 1.1-2.4) compared with women who did not fall, in a Norwegian community cohort of 300 women (Sylliaas et al., European Journal of Epidemiology, 2009).
- Older Japanese adults who reported several falls had 1.34 times the risk of dying over nine years, and those with one fall 1.09 times, compared with people who had not fallen (Zhong et al., European Geriatric Medicine, 2025; 52,076 people).
When the ambulance leaves the person at home
- 13.3% of community-dwelling adults aged 65+ taken by ambulance to hospital after a fall had a hospice claim within the following year (Newgard et al., Western Journal of Emergency Medicine, 2022).
- Older people left at home by a London ambulance crew after a fall had 5.4 times the death rate of people the same age in London over the following two weeks (standardised mortality ratio) (Snooks et al., Quality and Safety in Health Care, 2006).
- One third of people aged 65+ attended by paramedics after a 999 call for a fall made further emergency contacts or died within one month, and two thirds within six months, in a UK trial of 4,655 patients (Snooks et al., Annals of Emergency Medicine, 2017; SAFER 2).
- Over 40% of 221 older fallers who had been attended by paramedics and not taken to hospital died within three years, and 91% were admitted to hospital at least once in that time (Mikolaizak et al., Age and Ageing, 2022; New South Wales linked data).
Numbers we will not publish. "Life expectancy after a fall is six months" traces to a 1981 British study in which half of the people who lay on the floor for more than an hour after a fall died within six months; it describes that group, not people who fall. "9.6% die within 30 days and 33% within a year after a fall" are Nottingham hip-fracture figures (Roche and colleagues, 2005), not figures for falls in general.
Sources: Western Journal of Emergency Medicine; Age and Ageing (2022, 2023); American Journal of Emergency Medicine; Journal of Trauma and Acute Care Surgery; Journal of the American Geriatrics Society; European Geriatric Medicine (2024, 2025); Injury (2016, 2019); Journal of the American Medical Directors Association; SAGE Open Medicine; Healthcare; Scandinavian Journal of Trauma, Resuscitation and Emergency Medicine; Annals of Emergency Medicine (2017); PLoS One; Frontiers in Public Health; Australian and New Zealand Journal of Public Health; Medical Journal of Australia; European Journal of Trauma and Emergency Surgery; Journal of Trauma; British Medical Journal; JAMA; European Journal of Epidemiology; Quality and Safety in Health Care
03 / Life expectancy
What is the life expectancy after a hip fracture?
Half of US veteran men aged 65 to 89 operated for a hip fracture in 2000-2010 were alive 2.2 years later (Frontiers in Surgery, 2023).

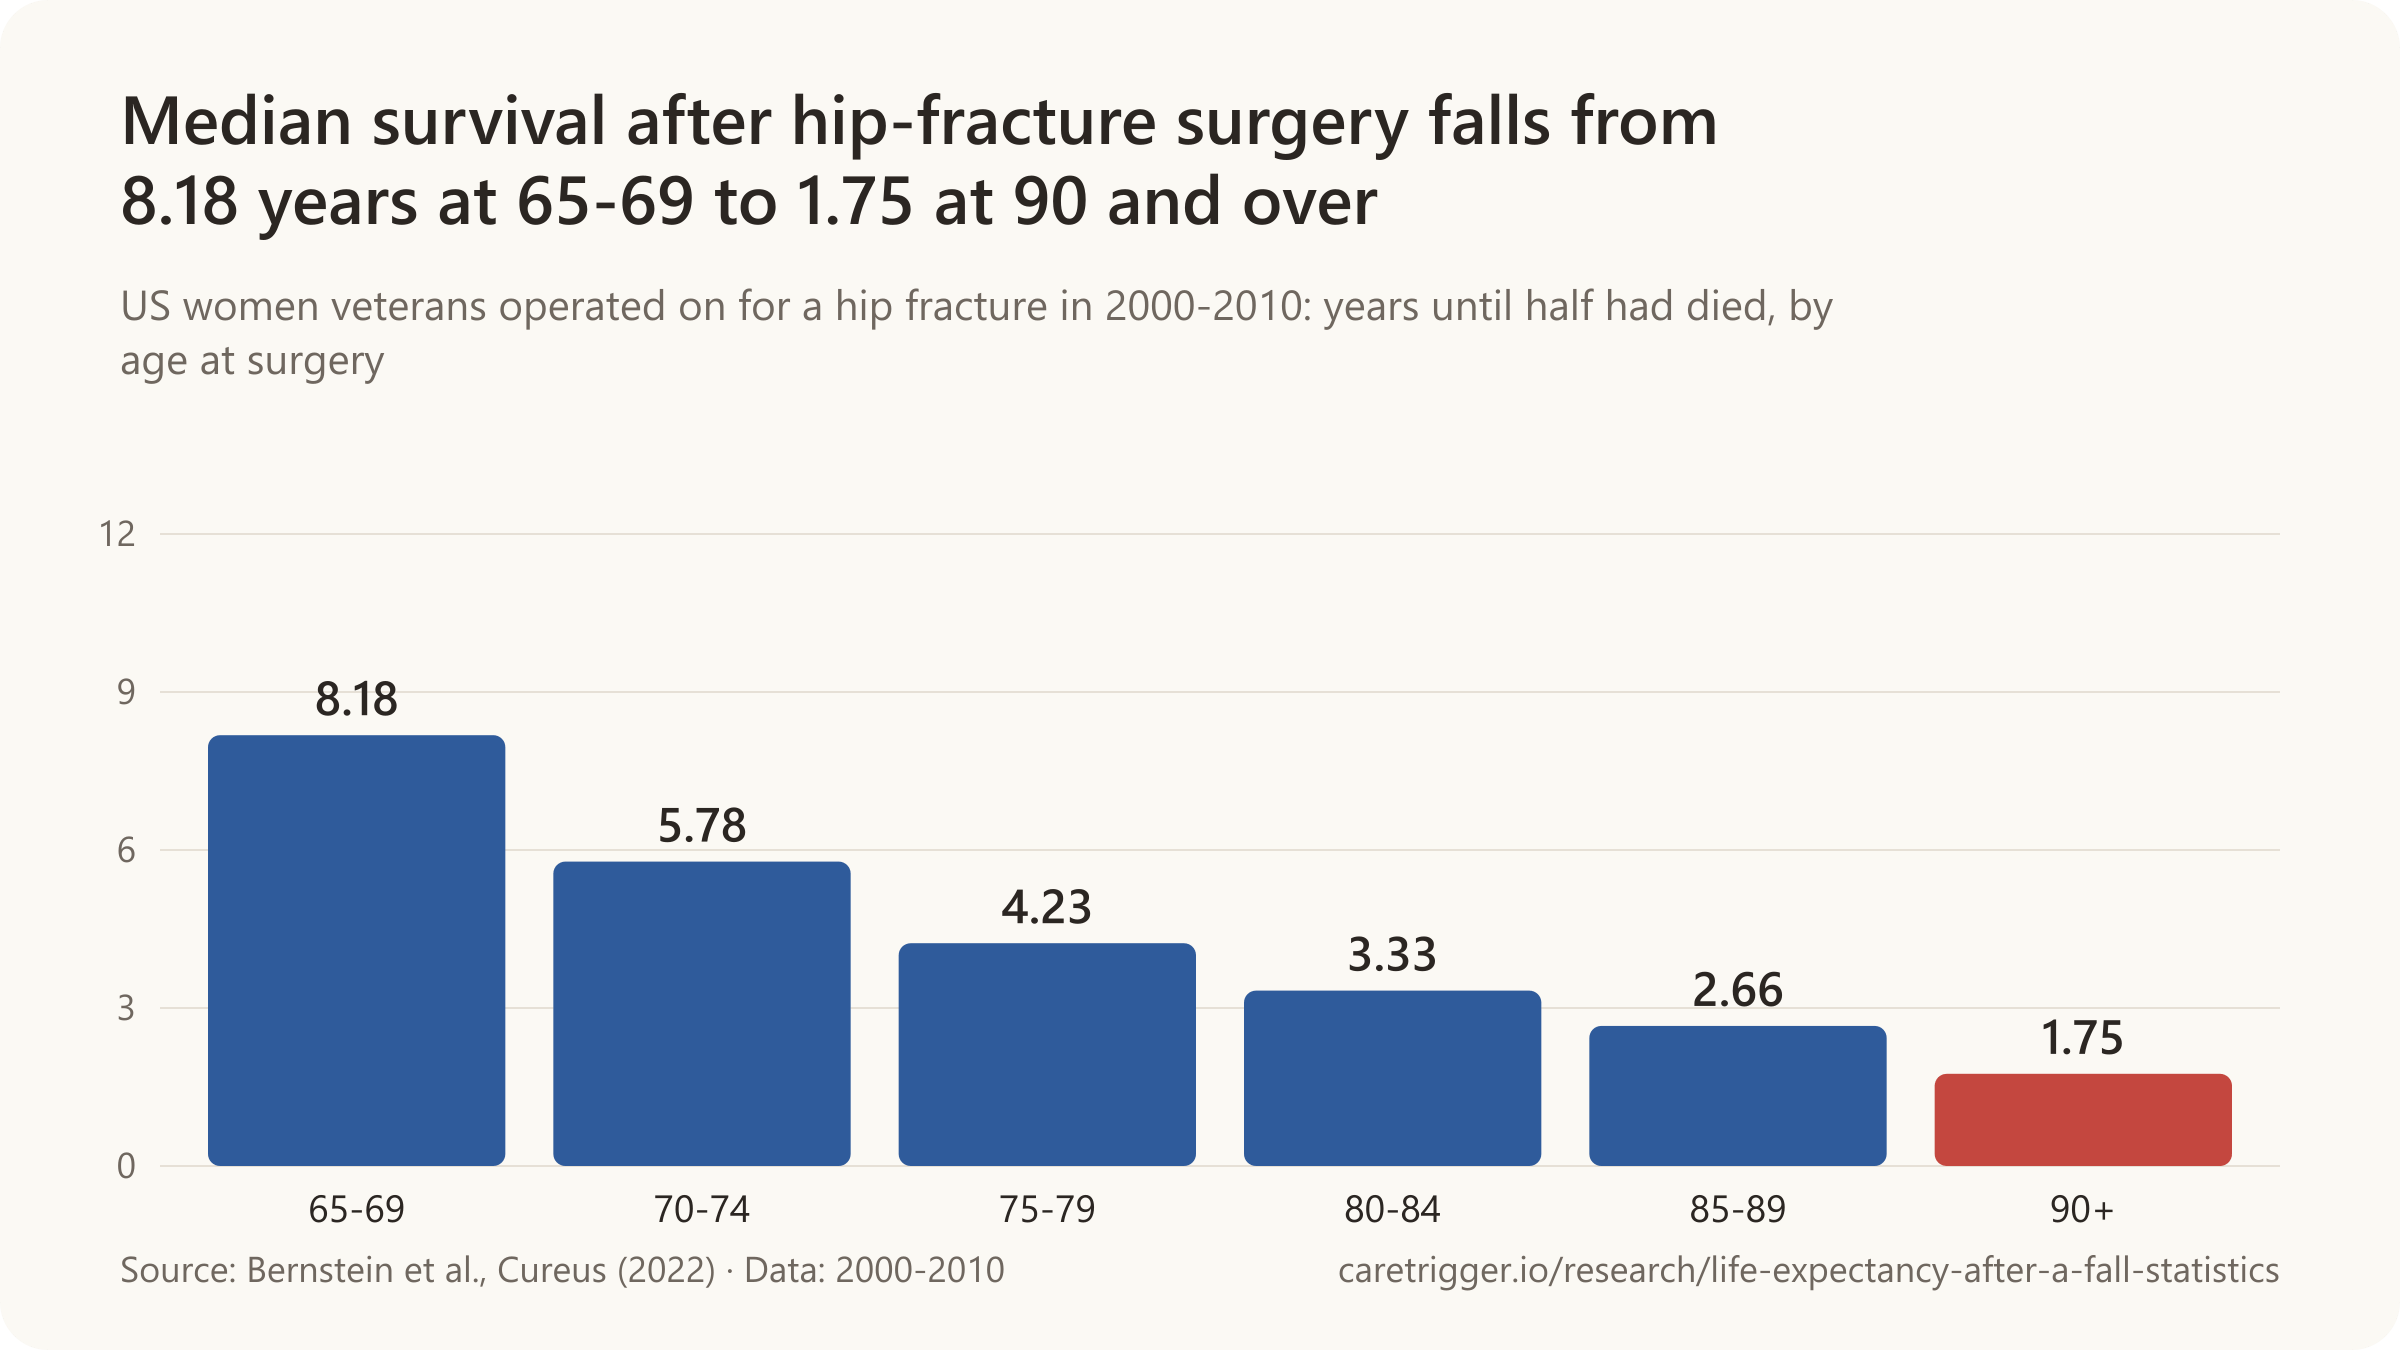
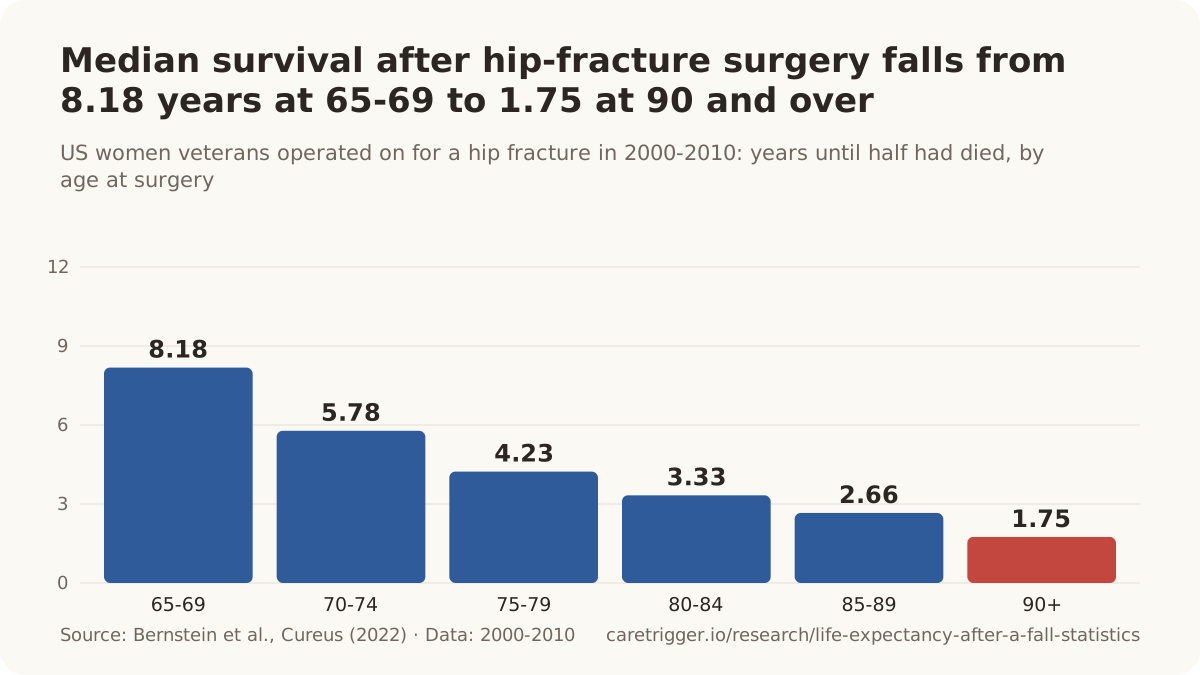
- For US women veterans, median survival after hip-fracture surgery was 3.42 years, from 8.18 years at 65-69 to 1.75 at 90 and older (2022).
- Danish men who broke a hip at 71 to 80 (1977-2001) lived 4.2 more years on average, against 9.5 without one (2009).
- In Australian aged care homes, a woman of 80 could expect to live 4.8 years after hip-fracture surgery (2021).
- At age 65, Swedish women with a past hip fracture had a remaining life expectancy 9.07 years shorter than other women (2017).
- In Taiwan, life expectancy after a hip fracture was 7.9 years, at an average age of 77.1 (2026).
| Age at surgery | Half still alive after |
|---|---|
| 65 to 69 | 3.9 years |
| 70 to 74 | 3.0 years |
| 75 to 79 | 2.3 years |
| 80 to 84 | 1.8 years |
| 85 to 89 | 1.3 years |
These are figures for groups of patients, not a forecast for any one person. A median is the point by which half had died and half were still alive.
Sources: Frontiers in Surgery; Cureus; Acta Orthopaedica; Scientific Reports; BMC Medicine; Injury
More statistics (86)
Half of US veterans (all men aged 65-89) operated on for a hip fracture were still alive 2.2 years after surgery (median survival), 2000-2010 (Lee et al., Frontiers in Surgery, 2023).
Life expectancy after a hip fracture is published in three ways: the median survival of a group of patients (half died sooner, half later), the years they lived compared with people of the same age, and the years of life a fracture is estimated to cost. Each answers a slightly different question, and each comes from a particular group of patients, named in every statement.
Median survival by age and gender
- Half of US women veterans (all women aged 65-99) operated on for a hip fracture were still alive 3.42 years after surgery (median survival), 2000-2010 (Bernstein et al., Cureus, 2022).
- Half of US veterans (men aged 65-69) operated on for a hip fracture were still alive 3.9 years after surgery (median survival), 2000-2010 (Lee et al., Frontiers in Surgery, 2023).
- Half of US veterans (men aged 70-74) operated on for a hip fracture were still alive 3.0 years after surgery (median survival), 2000-2010 (Lee et al., Frontiers in Surgery, 2023).
- Half of US veterans (men aged 75-79) operated on for a hip fracture were still alive 2.3 years after surgery (median survival), 2000-2010 (Lee et al., Frontiers in Surgery, 2023).
- Half of US veterans (men aged 80-84) operated on for a hip fracture were still alive 1.8 years after surgery (median survival), 2000-2010 (Lee et al., Frontiers in Surgery, 2023).
- Half of US veterans (men aged 85-89) operated on for a hip fracture were still alive 1.3 years after surgery (median survival), 2000-2010 (Lee et al., Frontiers in Surgery, 2023).
- Among US veterans operated on for a hip fracture, median survival in years was approximately 13 minus 0.13 times the age at surgery (about 2.6 years at age 80) (Lee et al., Frontiers in Surgery, 2023).
- Half of US women veterans (women aged 65-69) operated on for a hip fracture were still alive 8.18 years after surgery (median survival), 2000-2010 (Bernstein et al., Cureus, 2022).
- Half of US women veterans (women aged 70-74) operated on for a hip fracture were still alive 5.78 years after surgery (median survival), 2000-2010 (Bernstein et al., Cureus, 2022).
- Half of US women veterans (women aged 75-79) operated on for a hip fracture were still alive 4.23 years after surgery (median survival), 2000-2010 (Bernstein et al., Cureus, 2022).
- Half of US women veterans (women aged 80-84) operated on for a hip fracture were still alive 3.33 years after surgery (median survival), 2000-2010 (Bernstein et al., Cureus, 2022).
- Half of US women veterans (women aged 85-89) operated on for a hip fracture were still alive 2.66 years after surgery (median survival), 2000-2010 (Bernstein et al., Cureus, 2022).
- Half of US women veterans (women aged 90 and over) operated on for a hip fracture were still alive 1.75 years after surgery (median survival), 2000-2010 (Bernstein et al., Cureus, 2022).
- Among US women veterans operated on for a hip fracture, median survival was about 5 years at age 80, and in years could be approximated as 100 minus age, divided by 4 (Bernstein et al., Cureus, 2022).
- Median survival after an osteoporotic hip fracture was 886 days (about 2.4 years) in a Madrid hospital cohort of 3,992 patients (1999-2015), and 33% died within 12 months (Guzon-Illescas et al., Journal of Orthopaedic Surgery and Research, 2019).
Years lived and years lost
- Men in Denmark who broke a hip aged 71 to 80 lived on average 4.2 more years (within 25 years of follow-up), 5.3 years fewer than men of the same age without a hip fracture (9.5 years), a loss of 56% of their expected remaining life (Vestergaard et al., Acta Orthopaedica, 2009).
- Estimated life expectancy after surgery for a hip fracture was 4.8 years for women aged 80 living in Australian aged care homes (model estimate from 240 residents) (Liu et al., Scientific Reports, 2021).
- In 2017, Swedish women with a history of hip fracture had a remaining life expectancy at age 65 that was 9.07 years shorter than that of the general population (Meyer et al., BMC Medicine, 2020).
- Estimated life expectancy after a hip fracture was 7.9 years among 214,077 Taiwanese patients with an average age of 77.1, against 11.9 years after a vertebral fracture (Chang et al., Injury, 2026).
- Men in Denmark who broke a hip aged 50 or younger lived on average 19 more years (within 25 years of follow-up), 4.2 years fewer than men of the same age without a hip fracture (23 years), a loss of 18% of their expected remaining life (Vestergaard et al., Acta Orthopaedica, 2009).
- Women in Denmark who broke a hip aged 50 or younger lived on average 17 more years (within 25 years of follow-up), 6.3 years fewer than women of the same age without a hip fracture (24 years), a loss of 27% of their expected remaining life (Vestergaard et al., Acta Orthopaedica, 2009).
- Men in Denmark who broke a hip aged 51 to 60 lived on average 12 more years (within 25 years of follow-up), 7.5 years fewer than men of the same age without a hip fracture (19 years), a loss of 39% of their expected remaining life (Vestergaard et al., Acta Orthopaedica, 2009).
- Women in Denmark who broke a hip aged 51 to 60 lived on average 14 more years (within 25 years of follow-up), 6.5 years fewer than women of the same age without a hip fracture (21 years), a loss of 31% of their expected remaining life (Vestergaard et al., Acta Orthopaedica, 2009).
- Men in Denmark who broke a hip aged 61 to 70 lived on average 7.5 more years (within 25 years of follow-up), 7.5 years fewer than men of the same age without a hip fracture (15 years), a loss of 50% of their expected remaining life (Vestergaard et al., Acta Orthopaedica, 2009).
- Women in Denmark who broke a hip aged 61 to 70 lived on average 11 more years (within 25 years of follow-up), 5.6 years fewer than women of the same age without a hip fracture (17 years), a loss of 34% of their expected remaining life (Vestergaard et al., Acta Orthopaedica, 2009).
- Women in Denmark who broke a hip aged 71 to 80 lived on average 6.7 more years (within 25 years of follow-up), 3.8 years fewer than women of the same age without a hip fracture (11 years), a loss of 36% of their expected remaining life (Vestergaard et al., Acta Orthopaedica, 2009).
- Men in Denmark who broke a hip aged over 80 lived on average 2.1 more years (within 25 years of follow-up), 3.0 years fewer than men of the same age without a hip fracture (5.1 years), a loss of 58% of their expected remaining life (Vestergaard et al., Acta Orthopaedica, 2009).
- Women in Denmark who broke a hip aged over 80 lived on average 3.5 more years (within 25 years of follow-up), 2.1 years fewer than women of the same age without a hip fracture (5.6 years), a loss of 38% of their expected remaining life (Vestergaard et al., Acta Orthopaedica, 2009).
- Men who broke a hip after age 80 lost 58% of their expected remaining years of life, against 38% for women of that age (Denmark, 1977-2001) (Vestergaard et al., Acta Orthopaedica, 2009).
- Estimated life expectancy after surgery for a hip fracture was 8.2 years for women aged 70 living in Australian aged care homes (model estimate from 240 residents) (Liu et al., Scientific Reports, 2021).
- Estimated life expectancy after surgery for a hip fracture was 2.8 years for women aged 90 living in Australian aged care homes (model estimate from 240 residents) (Liu et al., Scientific Reports, 2021).
- Estimated life expectancy after surgery for a hip fracture was 3.8 years for men aged 70 living in Australian aged care homes (model estimate from 240 residents) (Liu et al., Scientific Reports, 2021).
- Estimated life expectancy after surgery for a hip fracture was 2.2 years for men aged 80 living in Australian aged care homes (model estimate from 240 residents) (Liu et al., Scientific Reports, 2021).
- Estimated life expectancy after surgery for a hip fracture was 1.3 years for men aged 90 living in Australian aged care homes (model estimate from 240 residents) (Liu et al., Scientific Reports, 2021).
- A 70-year-old woman living in an Australian aged care home could expect about 11 fewer years of life after a hip fracture than a 70-year-old woman in the general population (8.2 vs 19.3 years); for men the gap was about 13 years (Liu et al., Scientific Reports, 2021).
- In 1998, Swedish women with a history of hip fracture had a remaining life expectancy at age 65 that was 7.08 years shorter than that of the general population (Meyer et al., BMC Medicine, 2020).
- In 1998, Swedish men with a history of hip fracture had a remaining life expectancy at age 65 that was 8.17 years shorter than that of the general population (Meyer et al., BMC Medicine, 2020).
- In 2017, Swedish men with a history of hip fracture had a remaining life expectancy at age 65 that was 9.7 years shorter than that of the general population (Meyer et al., BMC Medicine, 2020).
- From 1998 to 2017, remaining life expectancy at age 65 fell by 0.29 years per decade for Swedish women with a history of hip fracture, while it rose by 0.76 years per decade for all women and by 2.48 years per decade for women who had had a heart attack (Meyer et al., BMC Medicine, 2020).
- In 2017, remaining life expectancy at age 65 in the general Swedish population was 21.5 years for women and 19.2 years for men, the reference for the hip-fracture gap (Meyer et al., BMC Medicine, 2020).
- Derived from Meyer et al. (BMC Medicine, 2020): Swedish women aged 65 with a history of hip fracture had a remaining life expectancy of about 12.4 years in 2017 (general-population 21.5 years minus the published 9.07-year gap).
- Derived from Meyer et al. (BMC Medicine, 2020): Swedish men aged 65 with a history of hip fracture had a remaining life expectancy of about 9.5 years in 2017 (general-population 19.2 years minus the published 9.7-year gap).
- A hip fracture at age 60 was associated with an estimated 6 years of life lost for men and 5 years for women (a "skeletal age" of 66 and 65), the largest loss of any fracture type (Denmark) (Tran et al., eLife, 2023).
- A man who breaks a hip at 50 is estimated to lose almost 7 years of life (skeletal age 56.8) (Denmark) (Tran et al., eLife, 2023).
- South Korean men aged 70-79 who survived the first year after a hip fracture still lost 2.94 years of life expectancy compared with matched men without a fracture, and women 2.03 years, the largest absolute loss of any age group (Kim et al., Bone, 2026).
- Men's life expectancy was 5.9 years shorter after a hip fracture than expected, on average, and age-matched women's 5.8 years shorter (mean age about 80, Geneva) (Trombetti et al., Osteoporosis International, 2002).
- Men lost 70% of their expected remaining years of life after a hip fracture, against 59% for age-matched women (Geneva) (Trombetti et al., Osteoporosis International, 2002).
- 69.6% of the healthy life-years lost to hip fracture (4,150 of 5,964 DALYs) were due to disability rather than early death, in six European and US cohorts (Papadimitriou et al., The Lancet Public Health, 2017).
| Age at the fracture and gender | Years lived (fewer) | Scope |
|---|---|---|
| Men, 50 or younger | 19 years (4.2 fewer) | men aged 50 or younger with a hip fracture vs age- and gender-matched men without one · Denmark (national registers) · hip fractures 1977-2001, followed up to 25 years |
| Women, 50 or younger | 17 years (6.3 fewer) | women aged 50 or younger with a hip fracture vs age- and gender-matched women without one · Denmark (national registers) · hip fractures 1977-2001, followed up to 25 years |
| Men, 51 to 60 | 12 years (7.5 fewer) | men aged 51 to 60 with a hip fracture vs age- and gender-matched men without one · Denmark (national registers) · hip fractures 1977-2001, followed up to 25 years |
| Women, 51 to 60 | 14 years (6.5 fewer) | women aged 51 to 60 with a hip fracture vs age- and gender-matched women without one · Denmark (national registers) · hip fractures 1977-2001, followed up to 25 years |
| Men, 61 to 70 | 7.5 years (7.5 fewer) | men aged 61 to 70 with a hip fracture vs age- and gender-matched men without one · Denmark (national registers) · hip fractures 1977-2001, followed up to 25 years |
| Women, 61 to 70 | 11 years (5.6 fewer) | women aged 61 to 70 with a hip fracture vs age- and gender-matched women without one · Denmark (national registers) · hip fractures 1977-2001, followed up to 25 years |
| Men, 71 to 80 | 4.2 years (5.3 fewer) | men aged 71 to 80 with a hip fracture vs age- and gender-matched men without one · Denmark (national registers) · hip fractures 1977-2001, followed up to 25 years |
| Women, 71 to 80 | 6.7 years (3.8 fewer) | women aged 71 to 80 with a hip fracture vs age- and gender-matched women without one · Denmark (national registers) · hip fractures 1977-2001, followed up to 25 years |
| Men, over 80 | 2.1 years (3.0 fewer) | men aged over 80 with a hip fracture vs age- and gender-matched men without one · Denmark (national registers) · hip fractures 1977-2001, followed up to 25 years |
| Women, over 80 | 3.5 years (2.1 fewer) | women aged over 80 with a hip fracture vs age- and gender-matched women without one · Denmark (national registers) · hip fractures 1977-2001, followed up to 25 years |
Survival over time

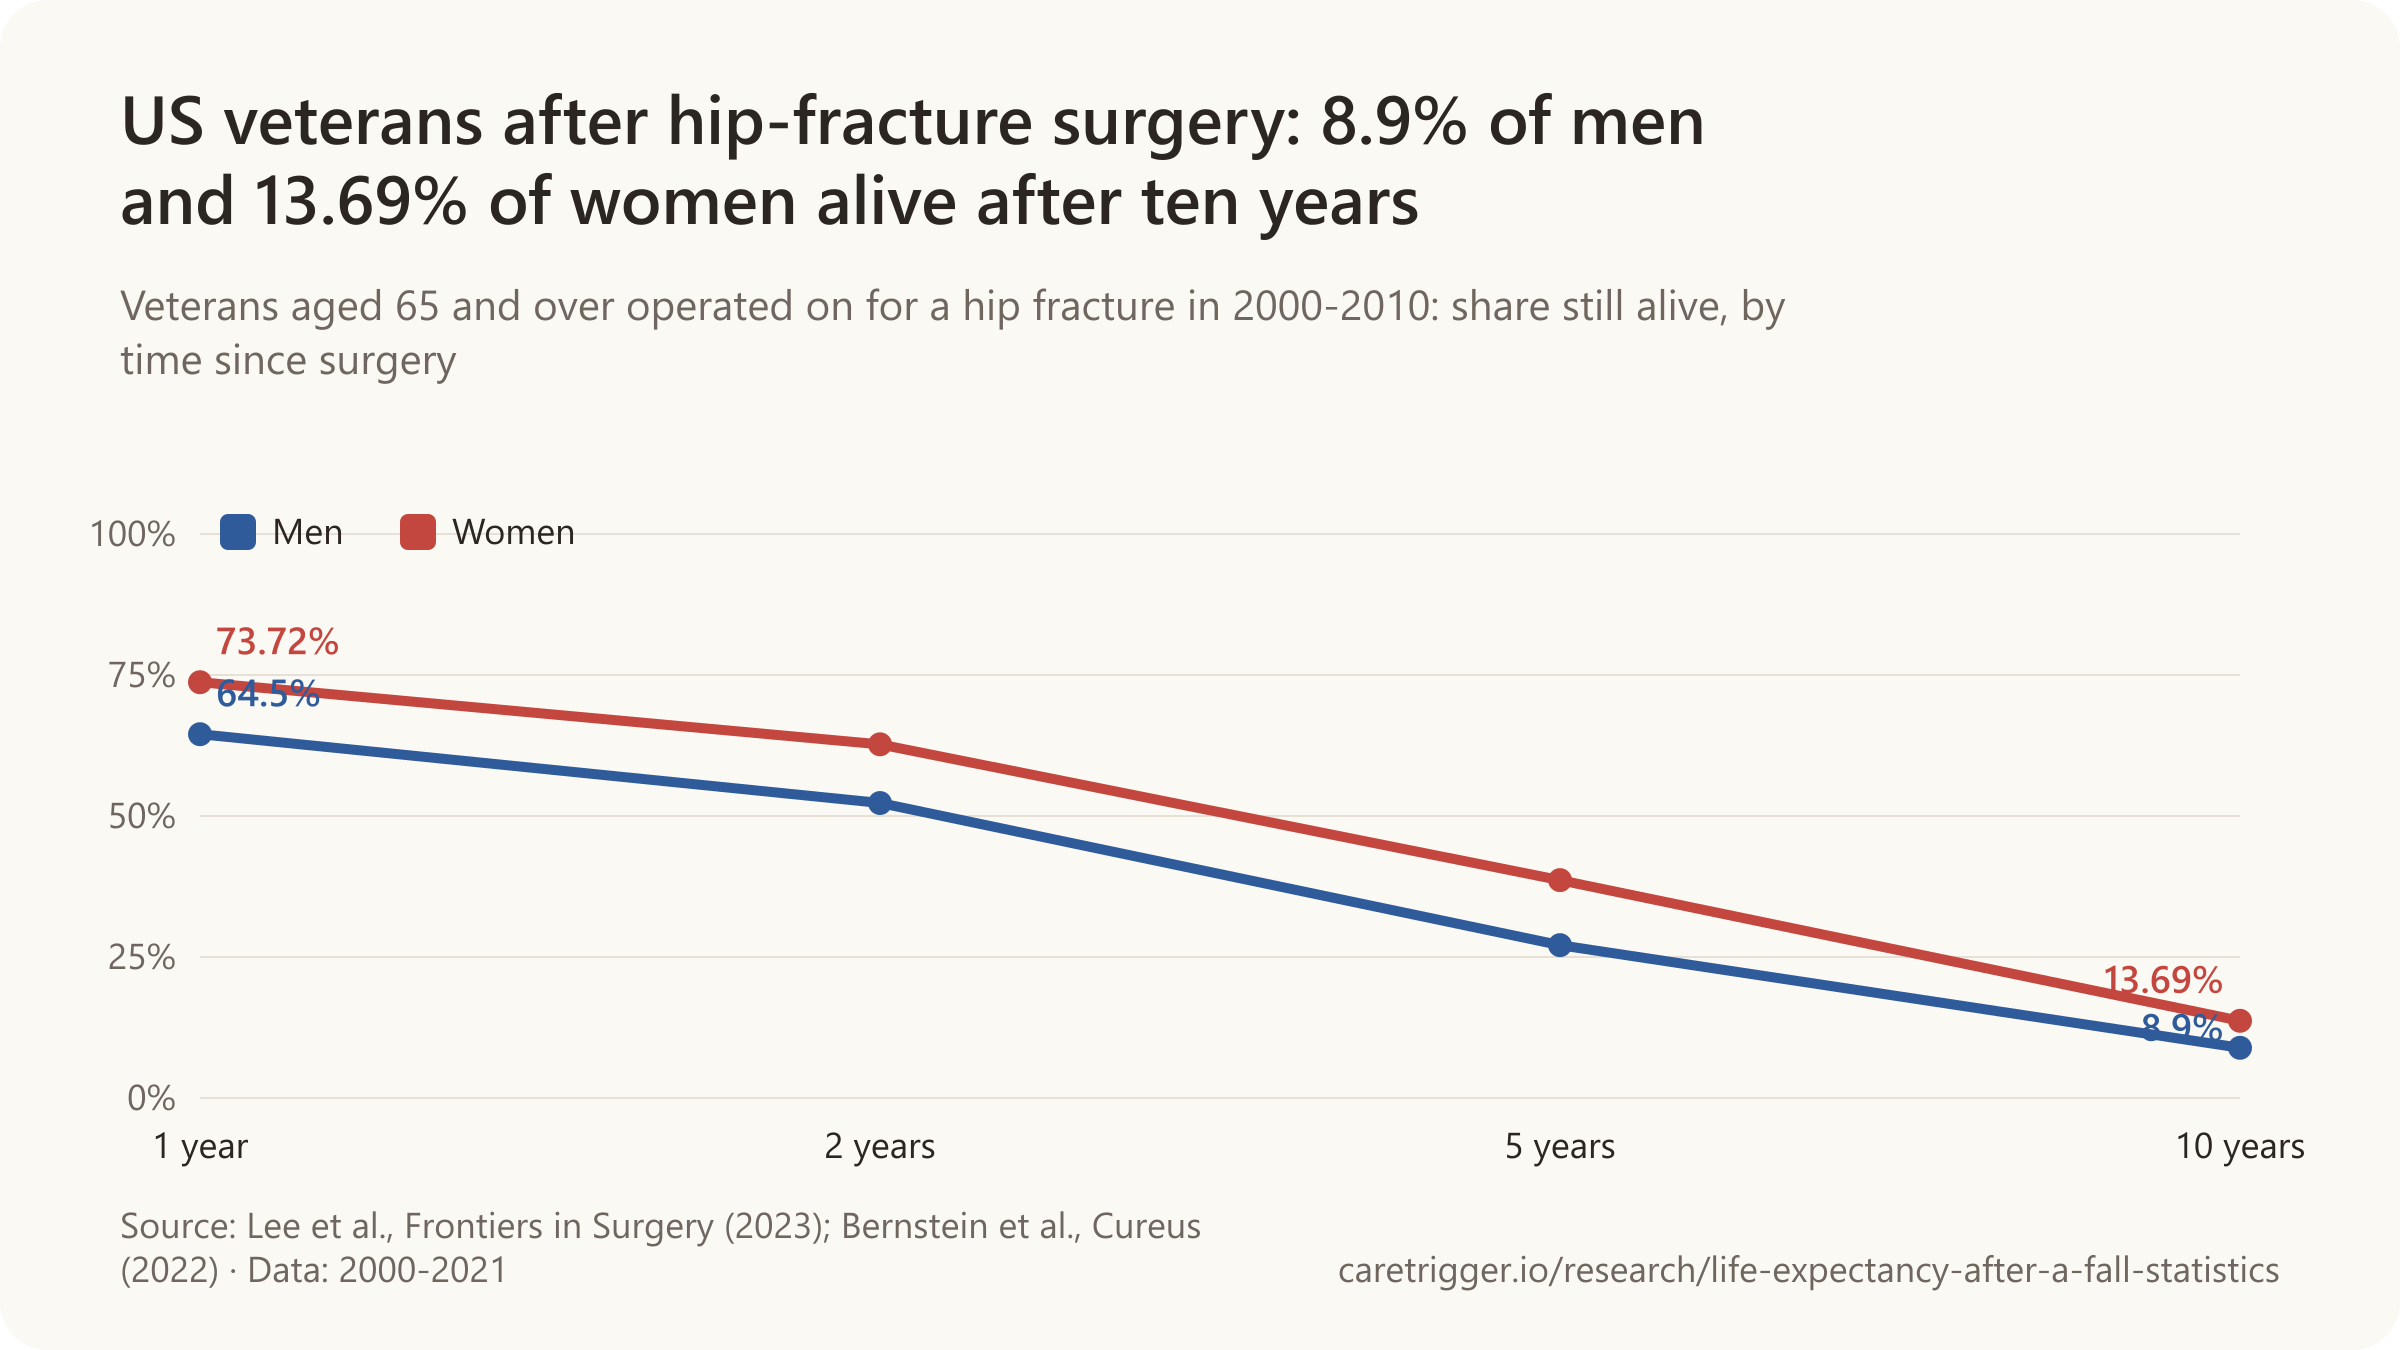
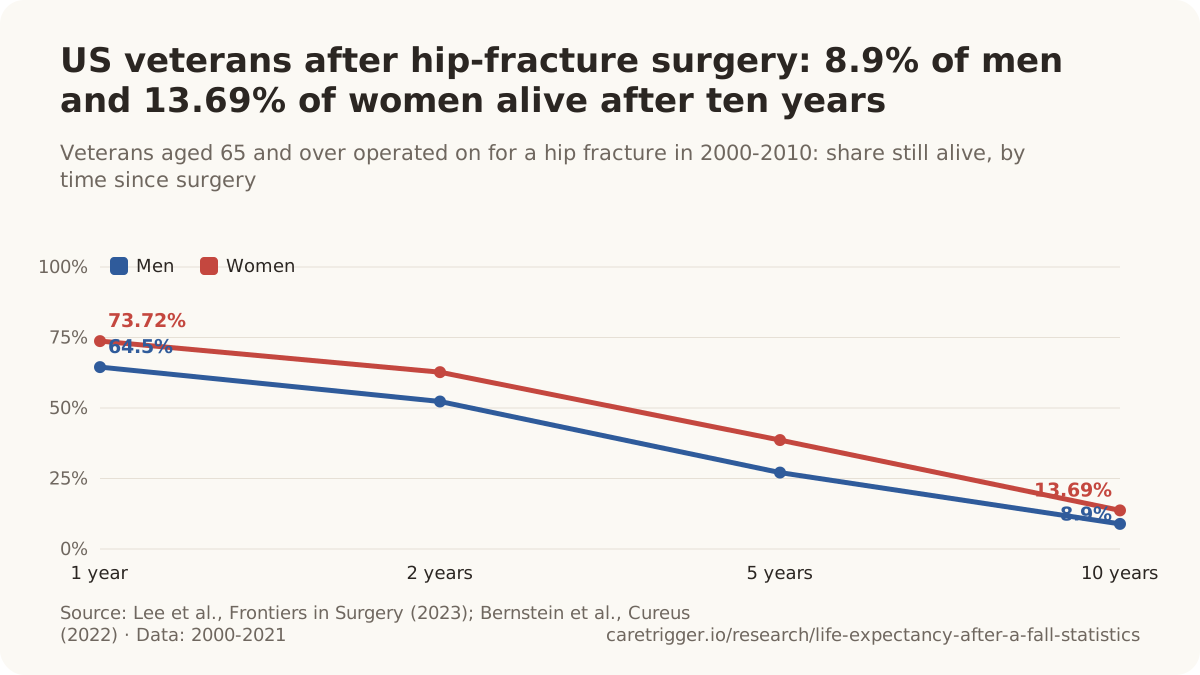
- 90.4% of US veterans aged 65-89 operated on for a hip fracture were alive 30 days after surgery (Lee et al., Frontiers in Surgery, 2023).
- Ten years after hip-fracture surgery, 8.5% of US veterans aged 65-89 were still alive, against an expected 39.8% of men of the same ages in the general population (Bernstein et al., Frontiers in Surgery, 2024).
- 48% of US veterans who had hip-fracture surgery at age 65 were alive five years later, against an expected 91% of men that age in the general population (Bernstein et al., Frontiers in Surgery, 2024).
- 42% of US veterans who had hip-fracture surgery at age 70 were alive five years later, against an expected 86% of men that age in the general population (Bernstein et al., Frontiers in Surgery, 2024).
- 29% of US veterans who had hip-fracture surgery at age 75 were alive five years later, against an expected 79% of men that age in the general population (Bernstein et al., Frontiers in Surgery, 2024).
- 25% of US veterans who had hip-fracture surgery at age 80 were alive five years later, against an expected 67% of men that age in the general population (Bernstein et al., Frontiers in Surgery, 2024).
- 18% of US veterans who had hip-fracture surgery at age 85 were alive five years later, against an expected 51% of men that age in the general population (Bernstein et al., Frontiers in Surgery, 2024).
- 14% of US veterans who had hip-fracture surgery at age 89 were alive five years later, against an expected 35% of men that age in the general population (Bernstein et al., Frontiers in Surgery, 2024).
- For US veterans younger than 84 at the time of a hip fracture, five-year survival was lower than that of men in the general population who were ten years older (Bernstein et al., Frontiers in Surgery, 2024).
- 1 year after a hip fracture, women in the Dubbo study had 83% of the survival expected for Australians of the same age and gender (relative survival 0.83) (Frost et al., Bone, 2013).
- 5 years after a hip fracture, women in the Dubbo study had 59% of the survival expected for Australians of the same age and gender (relative survival 0.59) (Frost et al., Bone, 2013).
- 10 years after a hip fracture, women in the Dubbo study had 31% of the survival expected for Australians of the same age and gender (relative survival 0.31) (Frost et al., Bone, 2013).
- 1 year after a hip fracture, men in the Dubbo study had 63% of the survival expected for Australians of the same age and gender (relative survival 0.63) (Frost et al., Bone, 2013).
- 5 years after a hip fracture, men in the Dubbo study had 48% of the survival expected for Australians of the same age and gender (relative survival 0.48) (Frost et al., Bone, 2013).
- 10 years after a hip fracture, men in the Dubbo study had 36% of the survival expected for Australians of the same age and gender (relative survival 0.36) (Frost et al., Bone, 2013).
- Five years after a hip fracture, Rochester (Minnesota) residents had 82% of the survival expected for people of their age (relative survival 0.82), with the excess deaths concentrated in the first six months (Cooper et al., American Journal of Epidemiology, 1993).
How long the extra risk lasts
- Men who survived the first year after a hip fracture still had about a 20% risk of dying in each of the next nine years (range 19% to 21%), well above population norms (US veterans) (Bernstein et al., Frontiers in Surgery, 2024).
- Ten years after a hip fracture, a US veteran's risk of dying that year was still nearly double that of men of the same age in the general population, and in year three it was triple (Bernstein et al., Frontiers in Surgery, 2024).
- People who had a hip fracture had 2.78 times the risk of death of comparable older people without one in the first year after the fracture (eight cohorts in Europe and the USA, adjusted) (Katsoulis et al., Journal of Internal Medicine, 2017).
- People who had a hip fracture had 1.89 times the risk of death of comparable older people without one 1 to 4 years after the fracture (eight cohorts in Europe and the USA, adjusted) (Katsoulis et al., Journal of Internal Medicine, 2017).
- People who had a hip fracture had 2.15 times the risk of death of comparable older people without one 4 to 8 years after the fracture (eight cohorts in Europe and the USA, adjusted) (Katsoulis et al., Journal of Internal Medicine, 2017).
- People who had a hip fracture had 1.79 times the risk of death of comparable older people without one 8 or more years after the fracture (eight cohorts in Europe and the USA, adjusted) (Katsoulis et al., Journal of Internal Medicine, 2017).
- Over 15 years after a hip fracture, women had 1.9 times and men 2.8 times the mortality of matched community controls, and the excess was still present after 22 years (Malmö, Sweden) (von Friesendorff et al., Osteoporosis International, 2016).
- After the first year, survival of women who had a hip fracture was similar to that of matched women without one, except for those aged 65-70, who kept a higher mortality (US Study of Osteoporotic Fractures) (LeBlanc et al., Archives of Internal Medicine, 2011).
- For women aged 85 and over, excess mortality after a hip fracture had disappeared after three months (RR 1.0), while women under 75 still had 3.2 times the mortality of controls 5 to 6 years later (Norway) (Forsén et al., Osteoporosis International, 1999).
- Ten years after a hip fracture, Japanese patients still died at about twice the rate of the general population of the same age and gender (753 patients) (Tsuboi et al., JBJS Br, 2007).
- In Oslo, excess mortality after a hip fracture lasted more than ten years for men and women aged 65-84, but only about two years for men aged 85+; one-year death rates were 2.8 to 4.5 times those of the population (Finnes et al., BMC Geriatrics, 2013).
Sources: Frontiers in Surgery (2023, 2024); Cureus; Journal of Orthopaedic Surgery and Research; Acta Orthopaedica; Scientific Reports; BMC Medicine; Injury; eLife; Bone (2013, 2026); Osteoporosis International (1999, 2002, 2016); The Lancet Public Health; American Journal of Epidemiology; Journal of Internal Medicine; Archives of Internal Medicine; The Journal of Bone and Joint Surgery; BMC Geriatrics
04 / Causes
Why do older adults die after a fall or a broken hip?
Almost half (48.7%) of US fall deaths among people 65 and older in 2010 involved a head injury (Journal of the American Geriatrics Society).

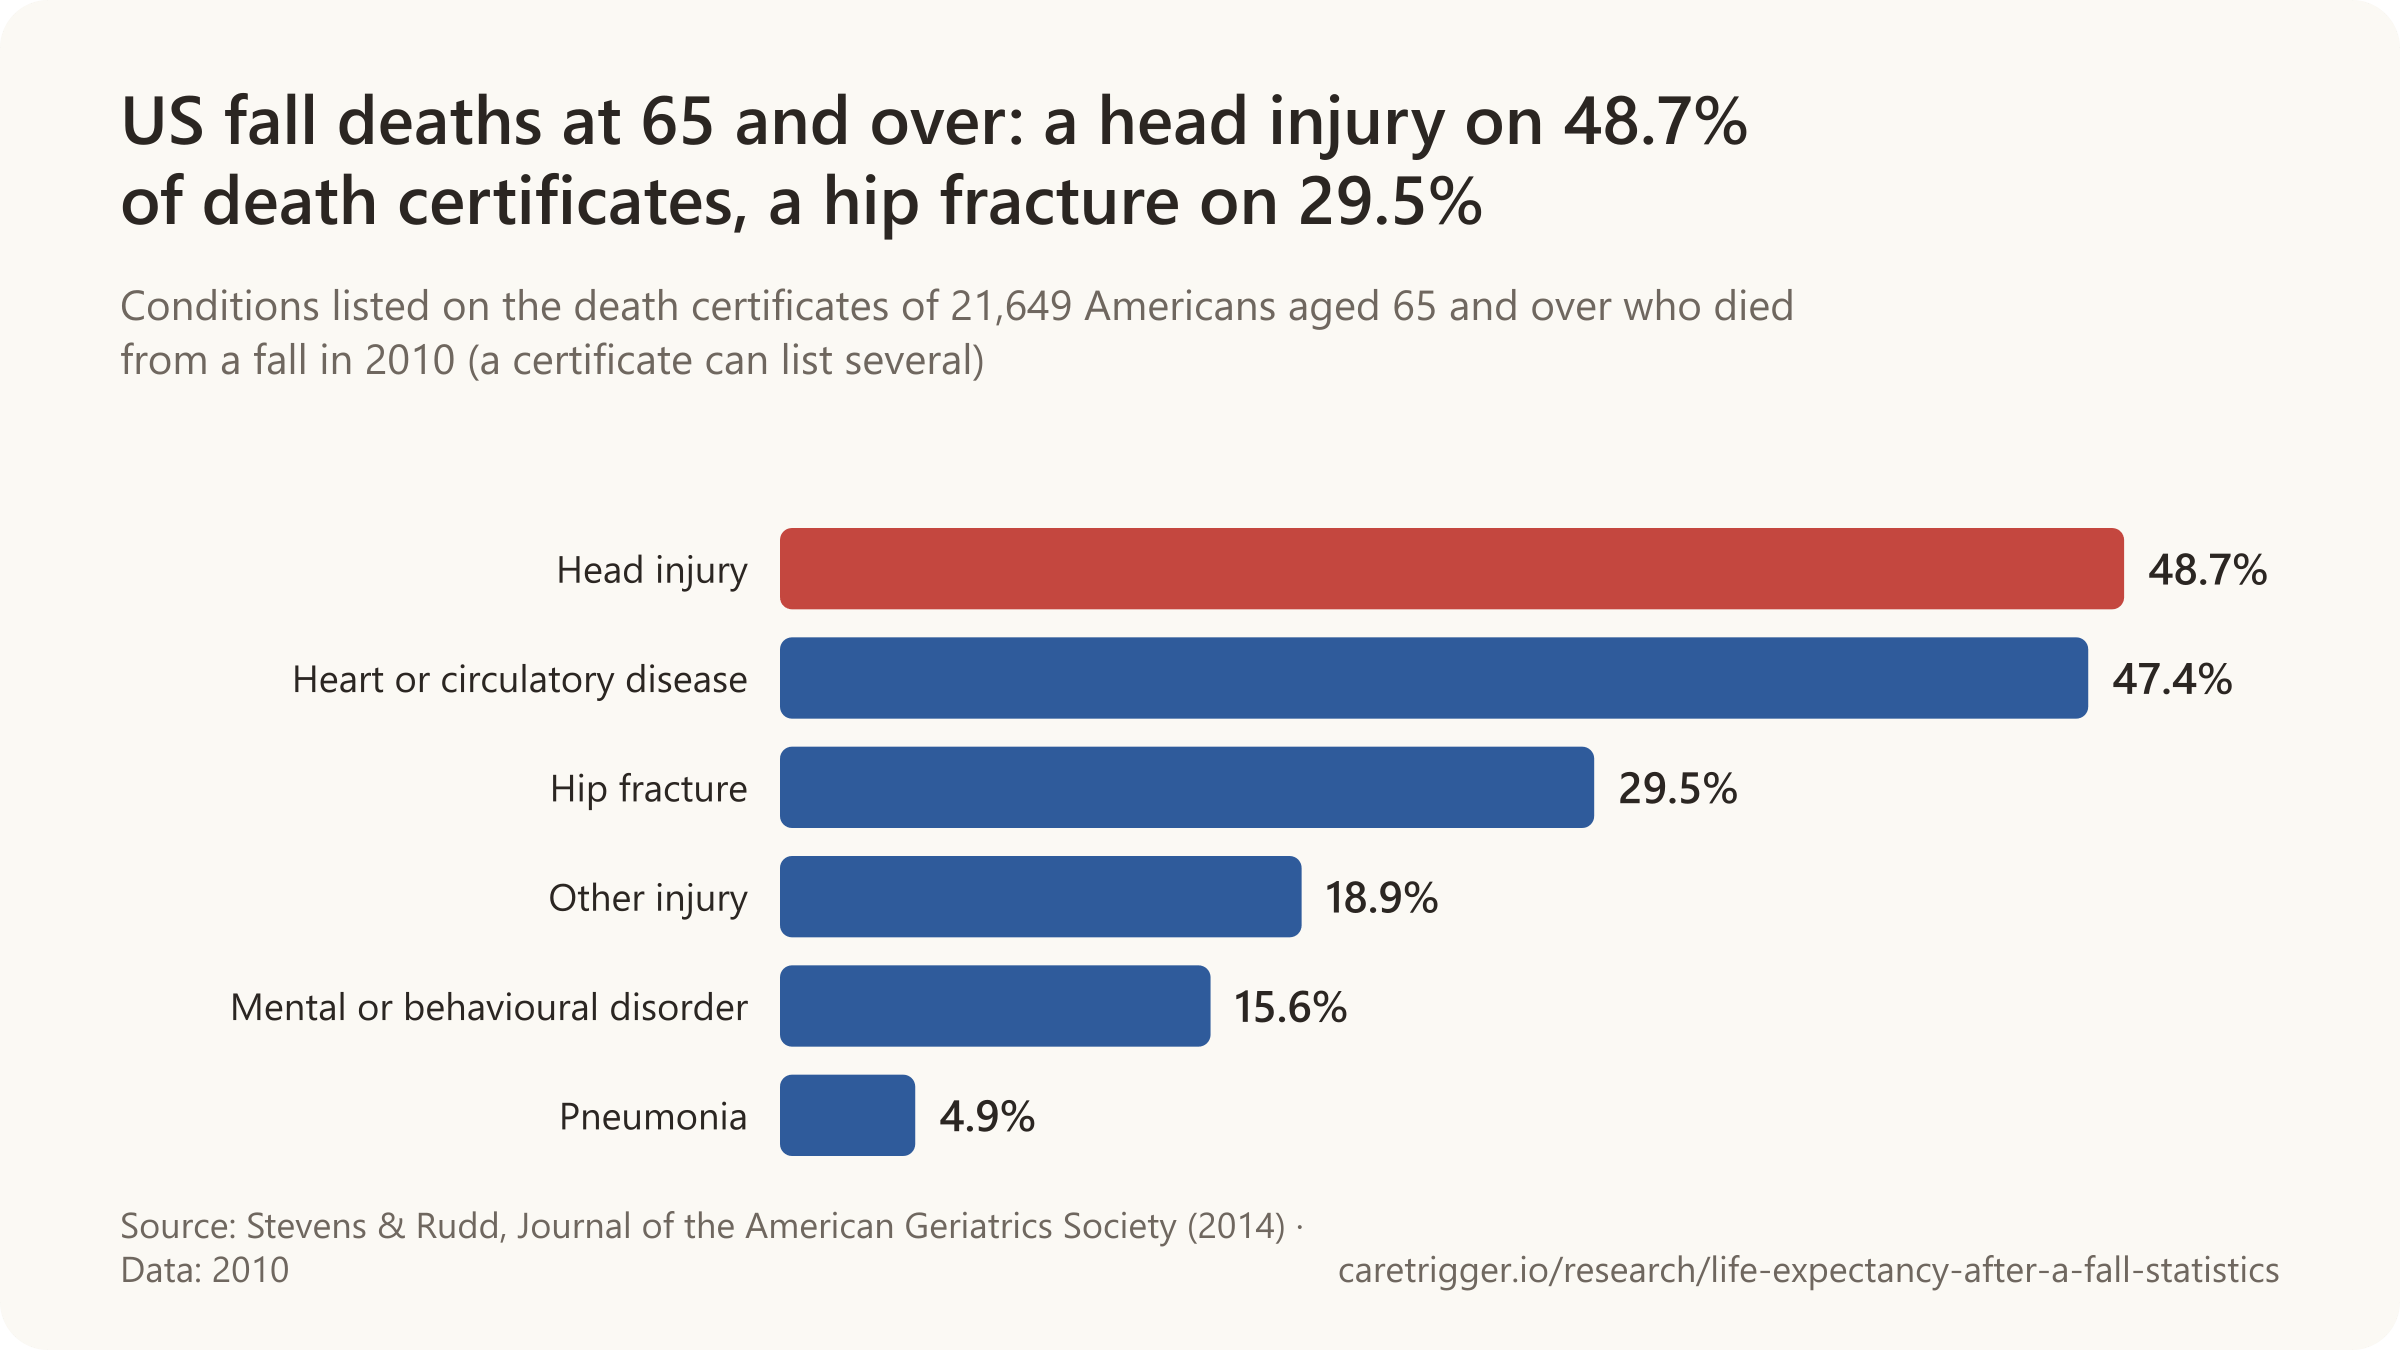
- A hip fracture appeared on 29.5% of the death certificates of Americans 65 and older who died from a fall in 2010.
- In Norway, the injury from the fall was the recorded cause of 53.8% of deaths within 30 days of a hip fracture (1999-2016).
- Of patients who developed heart failure after hip-fracture surgery, 65% died within 30 days (2005).
- Each extra day between a hip fracture and hospital admission raised the risk of dying within a year by about 6% (2026).
| Cause of death | Share of deaths |
|---|---|
| Heart and blood vessel disease | 44.1% |
| Dementia and Alzheimer's disease | 15.7% |
| Respiratory disease | 13.0% |
| Other causes | 13.3% |
| Cancer | 9.2% |
| Digestive disease | 4.7% |
Sources: Journal of the American Geriatrics Society; BMC Geriatrics; Bone; BMJ; BMC Musculoskeletal Disorders (2026, 2011)
More statistics (62)
48.7% of the 21,649 US fall deaths among people aged 65+ in 2010 involved a head injury on the death certificate (Stevens & Rudd, Journal of the American Geriatrics Society, 2014; CDC multiple-cause-of-death data).
In the first weeks after a fall, the injury itself and its complications (a bleed on the brain, a broken hip, pneumonia, heart failure after surgery) account for many deaths. Later, deaths follow the illnesses people already had: heart disease, dementia and lung disease. Death certificates undercount falls, because the fall is often recorded only as a contributing cause.
What death certificates say after a fall
- 29.5% of US fall deaths among people aged 65+ in 2010 listed a hip fracture on the death certificate, down from 32.0% in 1999 (Stevens & Rudd, Journal of the American Geriatrics Society, 2014).
- 18.9% of US fall deaths among people aged 65+ in 2010 listed an injury other than a head injury or hip fracture (Stevens & Rudd, Journal of the American Geriatrics Society, 2014).
- 47.4% of US fall deaths among people aged 65+ in 2010 also listed a disease of the circulatory system on the death certificate (Stevens & Rudd, Journal of the American Geriatrics Society, 2014).
- Pneumonia was listed on 4.9% of US fall death certificates for people aged 65+ in 2010, down from 7.0% in 1999 (Stevens & Rudd, Journal of the American Geriatrics Society, 2014).
- In 2010, 15.6% of US fall deaths among people aged 65+ also listed a mental or behavioural disorder (such as dementia), up from 5.9% in 1999 (Stevens & Rudd, Journal of the American Geriatrics Society, 2014).
- In 2010, a further 5,402 US deaths of people aged 65+ listed a fall only as a contributing cause (for example a heart attack followed by a fall), on top of 21,649 deaths with a fall as the underlying cause (Stevens & Rudd, Journal of the American Geriatrics Society, 2014).
- One study comparing hospital discharge records with death certificates found US fall deaths were undercounted by 22%, because clinicians did not always record the fall that started the chain of events (cited by Stevens & Rudd, Journal of the American Geriatrics Society, 2014).
- The recorded US fall death rate among people aged 65+ rose 55% between 1999 and 2007 (29.4 to 45.3 per 100,000), a rise the authors attribute largely to more specific reporting on death certificates (Hu & Baker, Public Health Reports, 2012).
- 35% of older adults who died within 30 days of an ambulance-attended fall had an injury listed as a cause of death, against 14% of all deaths within the year (Newgard et al., Western Journal of Emergency Medicine, 2022).
- Cardiovascular causes appeared on 55% of death certificates for older adults who died within 30 days of an ambulance-attended fall and 53% of those who died within a year (Newgard et al., Western Journal of Emergency Medicine, 2022).
- Injury was listed on only 12.8% of death certificates of injured older adults transported by ambulance (mostly after falls) who died within a year; cardiovascular causes (53.3%) and dementia (32.7%) were the most common causes of death (Newgard et al., Injury, 2019).
- Among older Latvians who died of a fall, the last hospital stay before death was most often for a hip or thigh injury (36.5%) or a head injury (34.1%) (Bukova-Zidelune et al., Scientific Reports, 2026; national data 2019-2023).
- 75.8% of older Latvians who died of a fall died in a hospital (Bukova-Zidelune et al., Scientific Reports, 2026; national data 2019-2023).
- In autopsies of people aged 65+ who died after a fall from standing height in Munich, the head was the most severely injured body region in 49% of cases (Schick et al., International Journal of Legal Medicine, 2018).
- Linking a national US cohort to the National Death Index gave a fall-related death rate of 51.6 per 100,000 older adults, versus 42.0 from CDC vital records, suggesting official counts underestimate fall deaths, especially for men and people 85+ (Lohman et al., Journals of Gerontology Series A, 2019).
- Of 527 fall-related deaths that coroners in England and Wales flagged as preventable (median age 82), 51.6% involved a fracture, 38.7% a head injury and 35.9% major bleeding (Song et al., Age and Ageing, 2023).
- 70.8% of fall-related deaths that coroners in England and Wales flagged as preventable occurred in hospital, after falls that mostly happened in the community (Song et al., Age and Ageing, 2023).
Causes of death after a hip fracture
- External causes, mainly the fall that caused the fracture, were the recorded underlying cause of 53.8% of deaths among Norwegians who died within 30 days of a hip fracture (1999-2016) (Holvik et al., BMC Geriatrics, 2023).
- 65% of hip-fracture patients who developed heart failure after surgery died within 30 days (77 of 119), and 92% within a year (Roche et al., BMJ, 2005).
- Cardiovascular disease and pneumonia were the leading causes of death in the two decades after a hip fracture, each with a long-term doubling of risk compared with matched controls (Malmö, Sweden) (von Friesendorff et al., Osteoporosis International, 2016).
- 43% of hip-fracture patients who developed a chest infection after surgery died within 30 days (92 of 215), and 71% within a year (Roche et al., BMJ, 2005).
- The most common complications after hip-fracture surgery were chest infection (9% of patients) and heart failure (5%); 20% of patients had at least one complication (Roche et al., BMJ, 2005).
- Patients with three or more other illnesses had 2.5 times the risk of dying within 30 days of hip-fracture surgery of those with none, after adjusting for age and gender (Roche et al., BMJ, 2005).
- Circulatory (heart and blood vessel) disease was the underlying cause of 44.1% of deaths among Finnish hip-fracture patients followed for up to nine years (Panula et al., BMC Musculoskeletal Disorders, 2011).
- Dementia and Alzheimer's disease were the underlying cause of 15.7% of deaths among Finnish hip-fracture patients followed for up to nine years (Panula et al., BMC Musculoskeletal Disorders, 2011).
- Respiratory disease was the underlying cause of 13.0% of deaths among Finnish hip-fracture patients followed for up to nine years (Panula et al., BMC Musculoskeletal Disorders, 2011).
- Cancer was the underlying cause of 9.2% of deaths among Finnish hip-fracture patients followed for up to nine years (Panula et al., BMC Musculoskeletal Disorders, 2011).
- Digestive disease was the underlying cause of 4.7% of deaths among Finnish hip-fracture patients followed for up to nine years (Panula et al., BMC Musculoskeletal Disorders, 2011).
- Other causes were the underlying cause of 13.3% of deaths among Finnish hip-fracture patients followed for up to nine years (Panula et al., BMC Musculoskeletal Disorders, 2011).
- Finnish hip-fracture patients died of respiratory disease at 5.44 times the rate of the general population aged 65+, and of digestive disease at 8.43 times (age- and gender-standardised) (Panula et al., BMC Musculoskeletal Disorders, 2011).
- Circulatory (heart and blood vessel) diseases were the recorded underlying cause of 19.8% of deaths among Norwegians who died within 30 days of a hip fracture (1999-2016) (Holvik et al., BMC Geriatrics, 2023).
- Cancer was the recorded underlying cause of 9.4% of deaths among Norwegians who died within 30 days of a hip fracture (1999-2016) (Holvik et al., BMC Geriatrics, 2023).
- Respiratory diseases were the recorded underlying cause of 5.7% of deaths among Norwegians who died within 30 days of a hip fracture (1999-2016) (Holvik et al., BMC Geriatrics, 2023).
- Among Norwegians who died within a year of a hip fracture, the injury itself (external causes) and circulatory diseases together accounted for about half of deaths (26.1% and 27.0%) (Holvik et al., BMC Geriatrics, 2023).
- In the year after a hip fracture, Norwegian men had 2.4 to 5.3 times and women 1.5 to 2.5 times the death rate of matched controls, depending on the cause of death (2002-2017) (Holvik et al., BMC Geriatrics, 2023).
- Post-mortem reports of patients who died in hospital after a hip fracture most often gave respiratory infection (35%), ischaemic heart disease (21%) and heart failure (13%) as the cause of death (220 reports, Stoke-on-Trent) (Chatterton et al., Bone & Joint Journal, 2015).
- 11.05% of Korean hip-fracture surgery patients aged 65+ developed pneumonia in hospital, 16.39% of men and 9.29% of women (Jang et al., Journal of Korean Medical Science, 2020).
- Hip-fracture patients who developed pneumonia in hospital had 3.40 times the risk of death within 90 days and 2.31 times within a year compared with those who did not (Korea) (Jang et al., Journal of Korean Medical Science, 2020).
- Pneumonia caused 19.4% of deaths in the two years after a hip fracture (911 deaths, Barcelona, 2009-2015) (Barceló et al., Archives of Osteoporosis, 2021).
- Diseases of the circulatory system caused 16% of deaths in the two years after a hip fracture (911 deaths, Barcelona, 2009-2015) (Barceló et al., Archives of Osteoporosis, 2021).
- Dementia caused 13.9% of deaths in the two years after a hip fracture (911 deaths, Barcelona, 2009-2015) (Barceló et al., Archives of Osteoporosis, 2021).
- Causes directly related to the hip fracture or its surgery caused 3.2% of deaths in the two years after a hip fracture (911 deaths, Barcelona, 2009-2015) (Barceló et al., Archives of Osteoporosis, 2021).
- Among older adults with coronary heart disease, the death rate after a hip fracture (32.52 per 100 person-years) was higher than after new heart failure (25.62), and the risk of death was 5 to 7 times normal in the first 6 months (Robbins et al., American Journal of Medicine, 2023).
- 60.0% of people aged 85+ with heart failure died within a year of a hip fracture (northern Sweden) (Olofsson et al., European Geriatric Medicine, 2025).
How many deaths the fracture itself causes
- An estimated 17% to 32% of all deaths after a hip fracture (depending on age) were caused by the fracture rather than by pre-existing illness, in 160,000 Swedish hip fractures (Kanis et al., Bone, 2003).
- 5.3% of people who had a hip fracture (413 of 7,724) died as a result of it, in six cohorts of adults aged 50+ in Europe and the USA followed for a mean of 13 years (Papadimitriou et al., The Lancet Public Health, 2017).
- Only 21% of deaths after a fall-related hip fracture mentioned the hip fracture as contributing to death (New South Wales, 2000-2003) (Hindmarsh et al., Osteoporosis International, 2009).
- Deaths caused by hip fracture accounted for more than 1.5% of all deaths among Swedes aged 50 and over, making hip fracture a more common cause of death than pancreatic or stomach cancer (Kanis et al., Bone, 2003).
- Most excess deaths after a hip fracture were linked to complications of the fracture event rather than pre-existing illness: 70.8% within the first 30 days (Denmark) (Vestergaard et al., Osteoporosis International, 2007).
- Hip fracture accounted for an estimated 0.5% of deaths among men at age 65 and up to 6% of deaths among women at age 85 in the US (Tosteson et al., Osteoporosis International, 2007).
Waiting for surgery
- In a multicentre cohort of 1,733 surgically treated osteoporotic hip-fracture patients aged 50+, each additional day between fracture and hospital admission raised one-year mortality risk by 6% (adjusted HR 1.06, 95% CI 1.04-1.08), and admission beyond 4 days doubled it (HR 2.01) (Fu et al., BMC Musculoskeletal Disorders, 2026).
- In 78 geriatric hip-fracture patients at a north Indian tertiary centre (2019-2020), 41% presented more than 48 hours after injury; injury-to-admission time was a risk factor for 30-day mortality (OR 1.22 per day, 95% CI 1.03-1.44), with 30-day mortality 19.2% (Ghosh et al., Cureus, 2023).
- Among 567 hip-fracture patients aged 70+ in a Paris orthogeriatric pathway (2009-2015), 12% developed pressure ulcers, and a pressure ulcer was associated with 2.38 times the risk of death at six months (95% CI 1.31-4.32) (Magny et al., Archives of Osteoporosis, 2017).
- In 19,520 US hip-fracture surgery patients (NSQIP, 2016-2019), 2.7% arrived with a pre-existing pressure ulcer; a preoperative pressure ulcer was independently associated with higher 30-day mortality (OR 1.21, 99% CI 1.02-1.43) and pneumonia (OR 1.39) (Porter et al., JAAOS Global Research & Reviews, 2022).
- In Japan, 60.5% of hip-fracture patients aged 65+ had surgery on day 3 of admission or later, and later surgery was associated with slightly higher one-year mortality (aHR 1.03) (Nishimura et al., Archives of Osteoporosis, 2023).
- Patients who waited more than 24 hours for hip-fracture surgery had a 30-day mortality of 6.5%, against 5.8% for matched patients operated on sooner (Ontario, 2009-2014) (Pincus et al., JAMA, 2017).
- Older hip-fracture patients had a 20% lower risk of dying within 12 months (RR 0.80) when operated on within 48 hours than when operated on later (meta-analysis of 28 studies, 31,242 patients) (Klestil et al., Scientific Reports, 2018).
- Early hip-fracture surgery was associated with 26% lower odds of death (OR 0.74) and half the odds of pressure sores, in 35 studies with 191,873 patients where early mostly meant within 24 to 48 hours (Moja et al., PLoS One, 2012).
- In the HIP ATTACK trial, 9% of patients given accelerated surgery (median 6 hours) and 10% given standard care (median 24 hours) died within 90 days, a difference that was not significant (HR 0.91) (HIP ATTACK Investigators, The Lancet, 2020).
- A delay of more than 48 hours from fracture to surgery was associated with 1.69 times the risk of death within three days and a 6% higher one-year mortality (RR 1.06), while delays under 48 hours made no difference (Norway, 2008-2017) (Leer-Salvesen et al., Bone & Joint Journal, 2019).
Sources: Journal of the American Geriatrics Society; Public Health Reports; Western Journal of Emergency Medicine; Injury; Scientific Reports (2018, 2026); International Journal of Legal Medicine; Journals of Gerontology Series A; Age and Ageing; BMC Geriatrics; BMJ; Osteoporosis International (2007, 2008, 2016); BMC Musculoskeletal Disorders (2011, 2026); The Bone & Joint Journal (2015, 2019); Journal of Korean Medical Science; Archives of Osteoporosis (2017, 2021, 2023); The American Journal of Medicine; European Geriatric Medicine; Bone (2003, 2014); The Lancet Public Health; Cureus; JAAOS Global Research & Reviews; JAMA; PLoS One; The Lancet
05 / Countries and trends
How does hip fracture mortality differ between countries, and is it falling?
In England, Wales and Northern Ireland, 6.1% of hip-fracture patients died within 30 days in 2025, down from 10.9% in 2007 (National Hip Fracture Database).

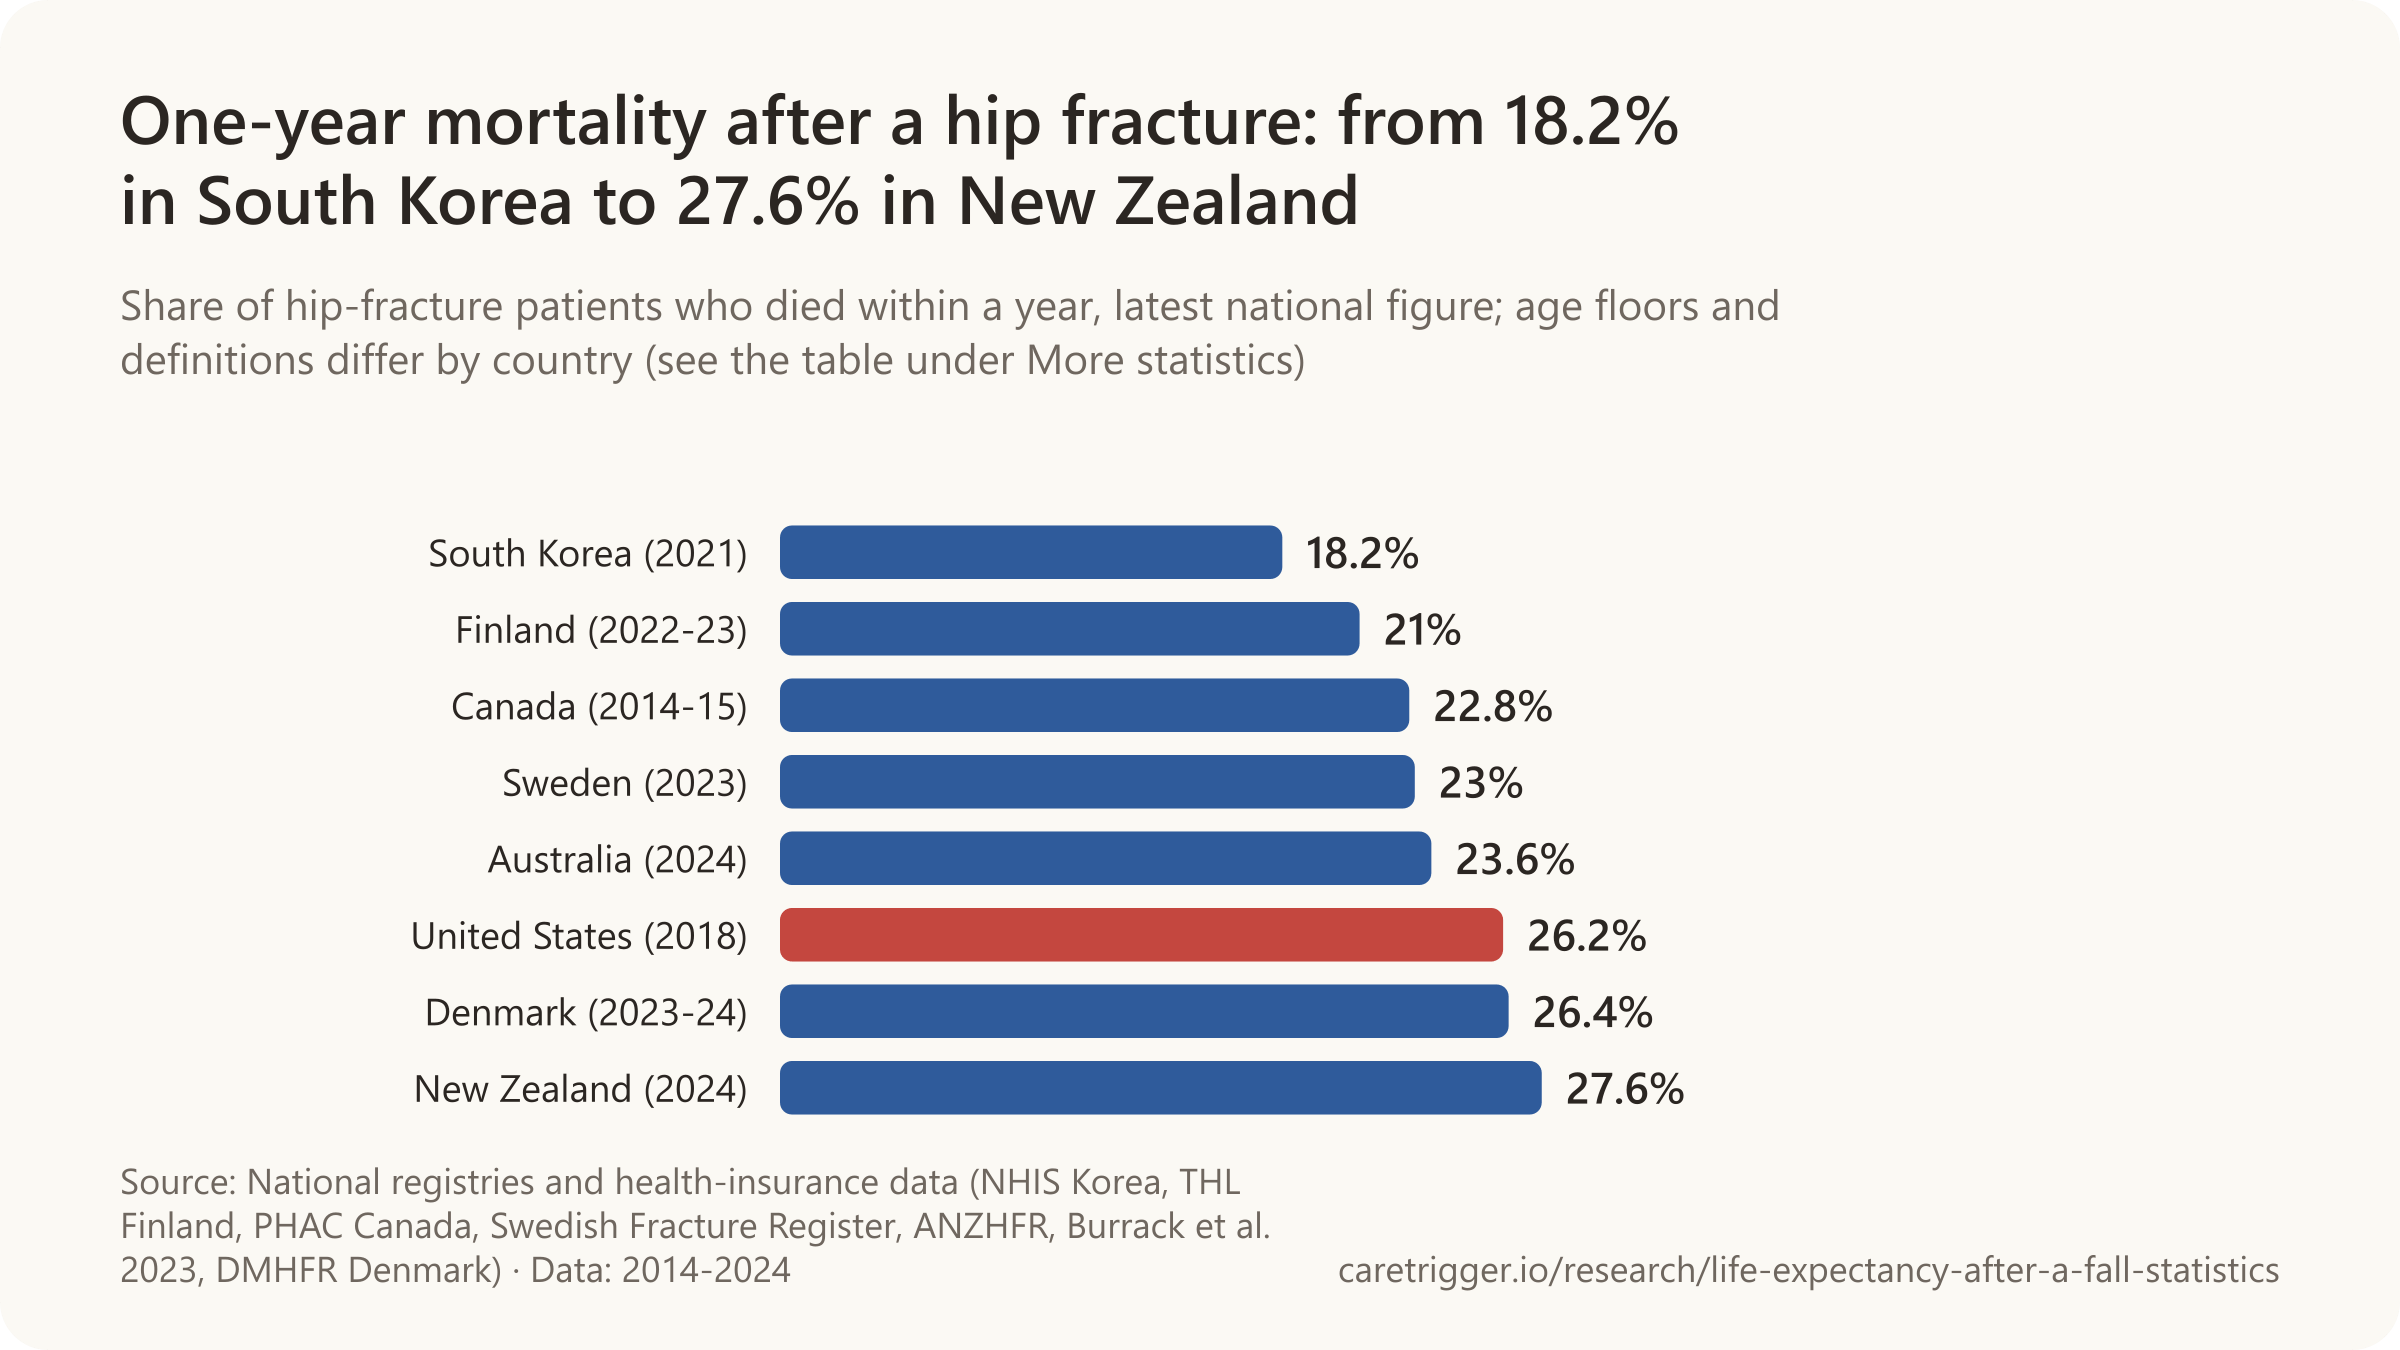
- In Finland, one-year mortality after hip-fracture surgery fell from 32.8% in 2000-2001 to 21.0% in 2022-2023.
- In England and Wales, 8.1% of hip-fracture patients at the worst-performing fifth of hospitals died within 30 days in 2025, against 3.0% at the best.
- Pooled studies put 30-day mortality after a hip fracture at 1.2% in Japan and 7.4% in Australia (2010-2021).
- Among US Medicare women, risk-adjusted 360-day mortality after a hip fracture eased from 24.0% in 1986 to 21.9% in 2004.
- Across ten high-income countries, 25.3% of people 65 and older admitted with a hip fracture died within a year (2021).
| Country, patients and year | Died within 30 days |
|---|---|
| Scotland (from admission, 2023) | 7.0% |
| Denmark (65 and older, from surgery, 2024-2025) | 10.5% |
| Sweden (50 and older, 2023) | 8% |
| Norway (65 and older, from admission, 2024) | 8.9% |
| Australia (50 and older, operated, risk-adjusted, 2025) | 7.5% |
| New Zealand (50 and older, operated, risk-adjusted, 2025) | 6.9% |
| Spain (75 and older, participating hospitals, 2023) | 8.8% |
| Germany (operated, AOK-insured, 2012-2014) | 7.5% |
| United States (NSQIP hospitals, from surgery, 2017) | 6.5% |
| Taiwan (50 and older, first fracture, 2015) | 2.92% |
Countries count differently: some from admission, some from surgery, some only operated patients, with age floors from 50 to 75. Rows are comparable only roughly; the definitions are in the full tables under More statistics.
Sources: National Hip Fracture Database (2026, 2025); Osteoporosis International; Finnish Institute for Health and Welfare, PERFECT; Public Health Agency of Canada; Swedish Fracture Register (2025, 2024); Australian and New Zealand Hip Fracture Registry; Journal of the American Geriatrics Society; Danish Multidisciplinary Hip Fracture Registry; Archives of Gerontology and Geriatrics; JAMA; Health Services Research; Public Health Scotland; Norwegian Directorate of Health; Registro Nacional de Fracturas de Cadera; Wissenschaftliches Institut der AOK; Journal of Clinical Endocrinology and Metabolism; Scientific Reports
More statistics (213)
In 2025, 6.1% of people aged 60 and over admitted to hospital with a hip fracture in England, Wales and Northern Ireland died within 30 days of admission (National Hip Fracture Database run chart, 2026).
National hip-fracture registries publish the same few measures every year: deaths within 30 days and within a year, the share operated on within a day or two, how long patients stay and where they go. They show slow improvement in most countries over the last two decades, wide gaps between hospitals, and a pause during the first year of COVID-19.
Cross-country comparisons
- In Japan, an estimated 1.2% of adults aged 50+ hospitalised with a hip fracture died within 30 days, pooling studies with data from 2010-2021 (Harvey et al., Archives of Gerontology and Geriatrics, 2024).
- On average, 25.3% of people aged 65+ admitted with a hip fracture died within a year across ten high-income countries in the ICCONIC comparison (Papanicolas et al., Health Services Research, 2021).
- One-year all-cause mortality after a hip fracture ranged from 14.4% in Singapore to 28.3% in the United Kingdom across 19 countries and regions (4.1 million hip fractures, 2005-2018) (Sing et al., JBMR, 2023).
- In Thailand, an estimated 1.2% of adults aged 50+ hospitalised with a hip fracture died within 30 days, pooling studies with data from 2010-2021 (Harvey et al., Archives of Gerontology and Geriatrics, 2024).
- In Singapore, an estimated 2.2% of adults aged 50+ hospitalised with a hip fracture died within 30 days, pooling studies with data from 2010-2021 (Harvey et al., Archives of Gerontology and Geriatrics, 2024).
- In New Zealand, an estimated 6.6% of adults aged 50+ hospitalised with a hip fracture died within 30 days, pooling studies with data from 2010-2021 (Harvey et al., Archives of Gerontology and Geriatrics, 2024).
- In Australia, an estimated 7.4% of adults aged 50+ hospitalised with a hip fracture died within 30 days, pooling studies with data from 2010-2021 (Harvey et al., Archives of Gerontology and Geriatrics, 2024).
- In Singapore, an estimated 10.8% of adults aged 50+ hospitalised with a hip fracture died within a year, pooling studies with data from 2010-2021 (Harvey et al., Archives of Gerontology and Geriatrics, 2024).
- In Japan, an estimated 12.6% of adults aged 50+ hospitalised with a hip fracture died within a year, pooling studies with data from 2010-2021 (Harvey et al., Archives of Gerontology and Geriatrics, 2024).
- In Australia, an estimated 23.3% of adults aged 50+ hospitalised with a hip fracture died within a year, pooling studies with data from 2010-2021 (Harvey et al., Archives of Gerontology and Geriatrics, 2024).
- In New Zealand, an estimated 23.8% of adults aged 50+ hospitalised with a hip fracture died within a year, pooling studies with data from 2010-2021 (Harvey et al., Archives of Gerontology and Geriatrics, 2024).
- In Japan, an estimated 1.4% of adults aged 50+ hospitalised with a hip fracture died in hospital, pooling studies with data from 2010-2021 (Harvey et al., Archives of Gerontology and Geriatrics, 2024).
- In New Zealand, an estimated 5.5% of adults aged 50+ hospitalised with a hip fracture died in hospital, pooling studies with data from 2010-2021 (Harvey et al., Archives of Gerontology and Geriatrics, 2024).
- In Australia, an estimated 4.5% of adults aged 50+ hospitalised with a hip fracture died in hospital, pooling studies with data from 2010-2021 (Harvey et al., Archives of Gerontology and Geriatrics, 2024).
- Australia (New South Wales) had the lowest 30-day mortality after a hip fracture, 5.5%, among nine high-income countries in the ICCONIC comparison (Papanicolas et al., Health Services Research, 2021).
- England had the highest 30-day mortality after a hip fracture, 9.8%, among nine high-income countries in the ICCONIC comparison (Papanicolas et al., Health Services Research, 2021).
- In England, 31.3% of people aged 65+ admitted with a hip fracture died within a year, the highest of the ICCONIC countries (Papanicolas et al., Health Services Research, 2021).
- In the United States, 26.7% of people aged 65+ admitted with a hip fracture died within a year, the second highest of the ICCONIC countries (Papanicolas et al., Health Services Research, 2021).
- In Canada (Ontario), 22.9% of people aged 65+ admitted with a hip fracture died within a year (ICCONIC; Papanicolas et al., Health Services Research, 2021).
- In Australia (New South Wales), 21.5% of people aged 65+ admitted with a hip fracture died within a year (ICCONIC; Papanicolas et al., Health Services Research, 2021).
- In France, 20.2% of people aged 65+ admitted with a hip fracture died within a year, the lowest of the ICCONIC countries (Papanicolas et al., Health Services Research, 2021).
- In-hospital mortality after a hip fracture ranged from 1.5% in Australia (New South Wales) to 11.5% in England across 11 high-income countries (average 4.1%) in the ICCONIC comparison (Papanicolas et al., Health Services Research, 2021).
- Over 85% of hip-fracture patients in Sweden had surgery on the day of admission or the next day, the highest share among seven countries compared by ICCONIC (Papanicolas et al., Health Services Research, 2021).
- A 2025 paper by the ICCONIC network restated the earlier ICCONIC finding as 30-day mortality after a hip fracture ranging from 5.8% in Australia to 9.8% in England (Estupinan-Romero et al., European Journal of Public Health, 2025).
- In Taiwan, 3.0% of adults aged 66+ hospitalised with a hip fracture in 2018 died within 30 days, the lowest of six high-income countries (Burrack et al., Journal of the American Geriatrics Society, 2023).
- In the Netherlands, 10.3% of adults aged 66+ hospitalised with a hip fracture in 2018 died within 30 days, the highest of six high-income countries (Burrack et al., Journal of the American Geriatrics Society, 2023).
- In Taiwan, 15.7% of adults aged 66+ hospitalised with a hip fracture in 2018 died within a year (Burrack et al., Journal of the American Geriatrics Society, 2023).
- In England, 19.4% of adults aged 66+ hospitalised with a hip fracture in 2018 died within a year (Burrack et al., Journal of the American Geriatrics Society, 2023).
- In the United States, 26.2% of adults aged 66+ hospitalised with a hip fracture in 2018 died within a year (Burrack et al., Journal of the American Geriatrics Society, 2023).
- In the Netherlands, 27.5% of adults aged 66+ hospitalised with a hip fracture in 2018 died within a year (Burrack et al., Journal of the American Geriatrics Society, 2023).
- In 2018, the mean hospital stay after a hip fracture ranged from 6.4 days in the United States to 18.7 days in England among six high-income countries (Burrack et al., Journal of the American Geriatrics Society, 2023).
- In Ontario (Canada), the predicted median risk-adjusted 30-day mortality after hip-fracture surgery was 40.5 per 1,000 operations, 2017-2021 (Estupinan-Romero et al., European Journal of Public Health, 2025).
- In Aragon (Spain), the predicted median risk-adjusted 30-day mortality after hip-fracture surgery was 49.3 per 1,000 operations, 2017-2021 (Estupinan-Romero et al., European Journal of Public Health, 2025).
- In Finland, the predicted median risk-adjusted 30-day mortality after hip-fracture surgery was 38.8 per 1,000 operations, 2017-2021 (Estupinan-Romero et al., European Journal of Public Health, 2025).
- In Sweden, the predicted median risk-adjusted 30-day mortality after hip-fracture surgery was 51.9 per 1,000 operations, 2017-2021 (Estupinan-Romero et al., European Journal of Public Health, 2025).
- In the United States (Medicare, 40 states), the predicted median risk-adjusted 30-day mortality after hip-fracture surgery was 40.2 per 1,000 operations, 2017-2021 (Estupinan-Romero et al., European Journal of Public Health, 2025).
- In Ontario (Canada), 3,291 of 48,974 hip-fracture operations in patients aged 65+ were followed by death within 30 days (6.7%, computed from the published counts; Estupinan-Romero et al., European Journal of Public Health, 2025).
- In Aragon (Spain), 538 of 7,453 hip-fracture operations in patients aged 65+ were followed by death within 30 days (7.2%, computed from the published counts; Estupinan-Romero et al., European Journal of Public Health, 2025).
- In Finland, 1,710 of 22,653 hip-fracture operations in patients aged 65+ were followed by death within 30 days (7.5%, computed from the published counts; Estupinan-Romero et al., European Journal of Public Health, 2025).
- In Sweden, 1,012 of 13,039 hip-fracture operations in patients aged 65+ were followed by death within 30 days (7.8%, computed from the published counts; Estupinan-Romero et al., European Journal of Public Health, 2025).
- In US Medicare (40 states), 27,066 of 443,400 hip-fracture operations in patients aged 65+ were followed by death within 30 days (6.1%, computed from the published counts; Estupinan-Romero et al., European Journal of Public Health, 2025).
England, Wales and Northern Ireland

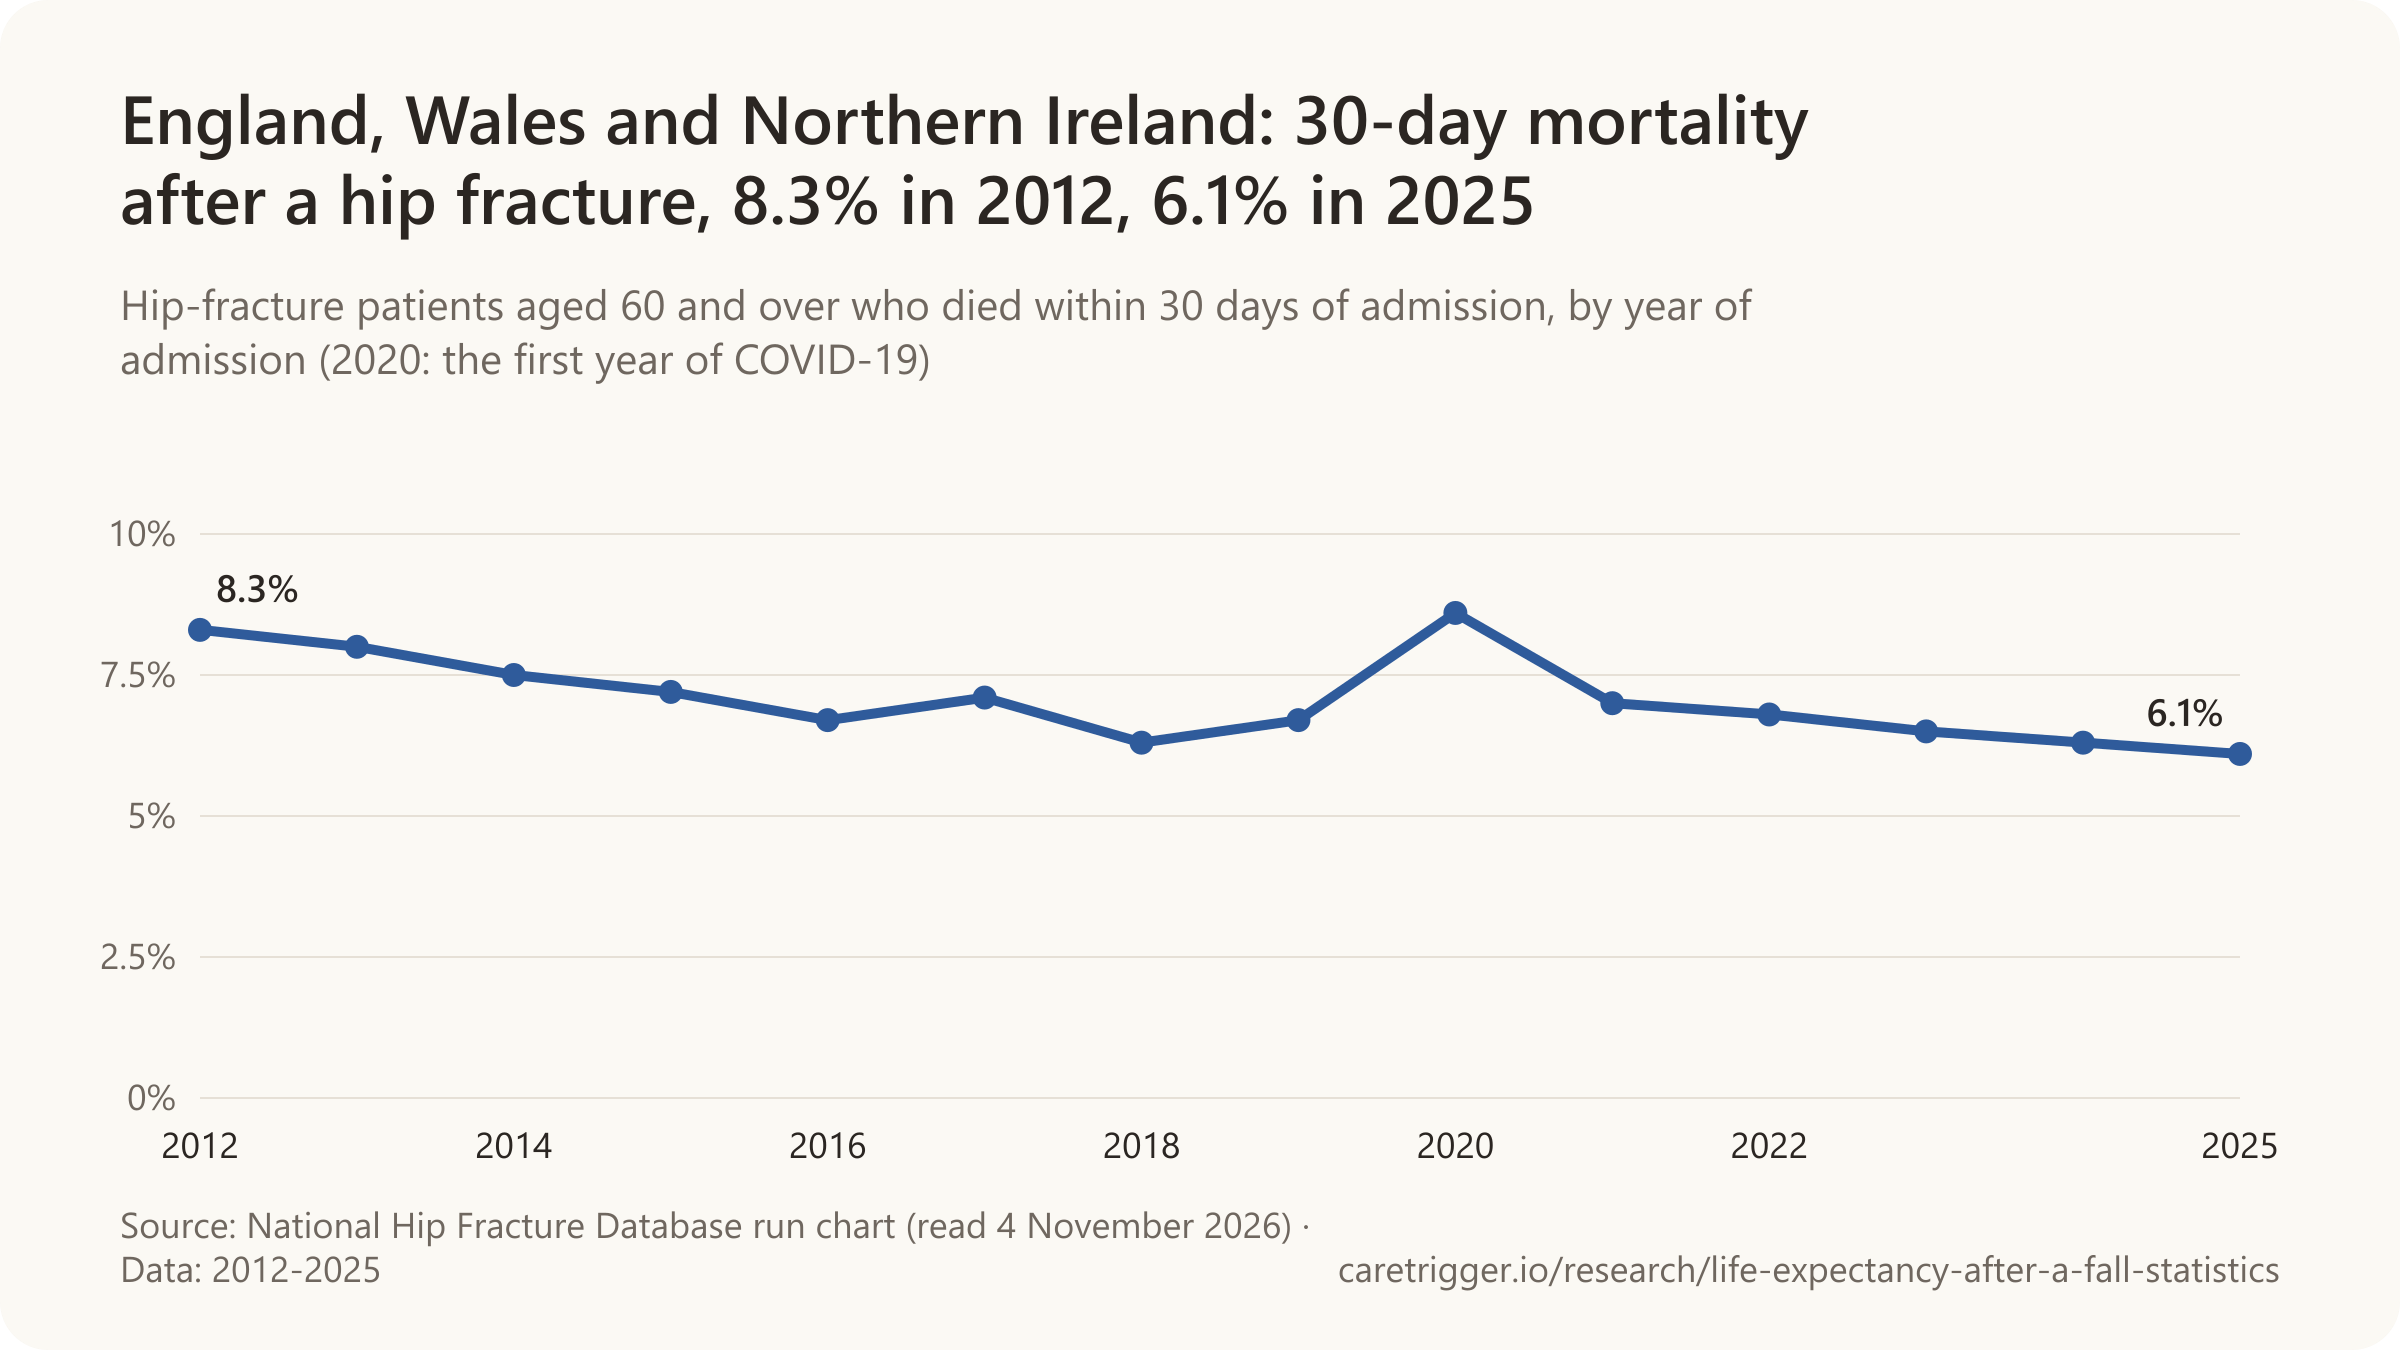
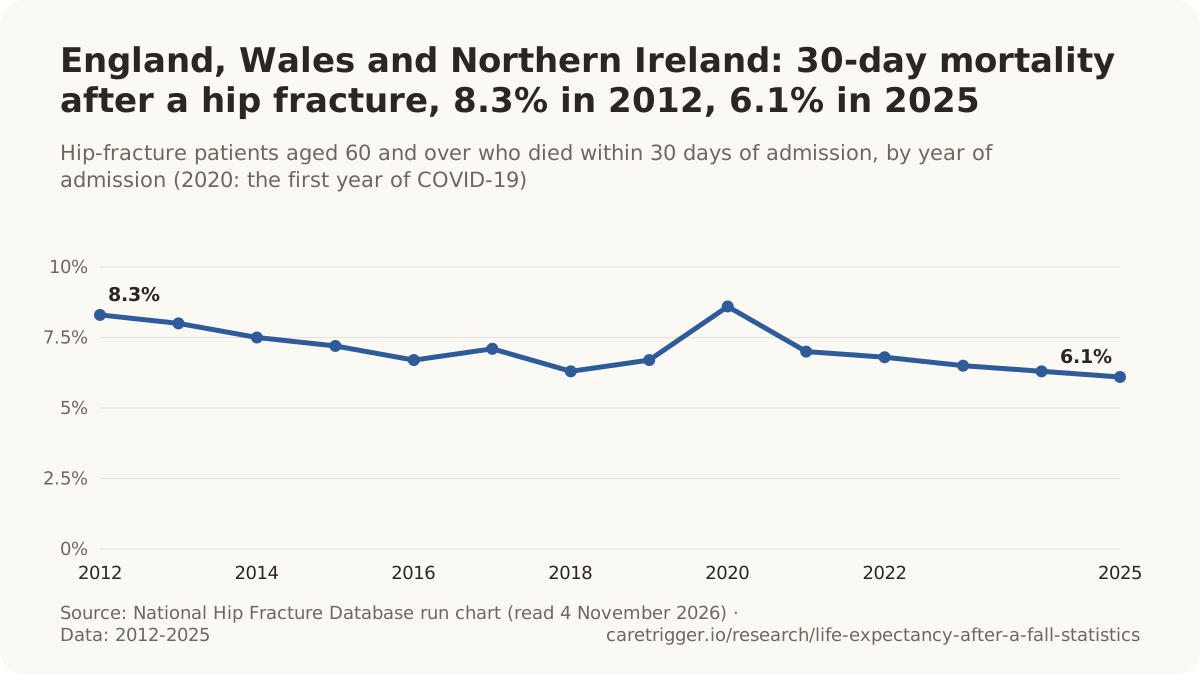

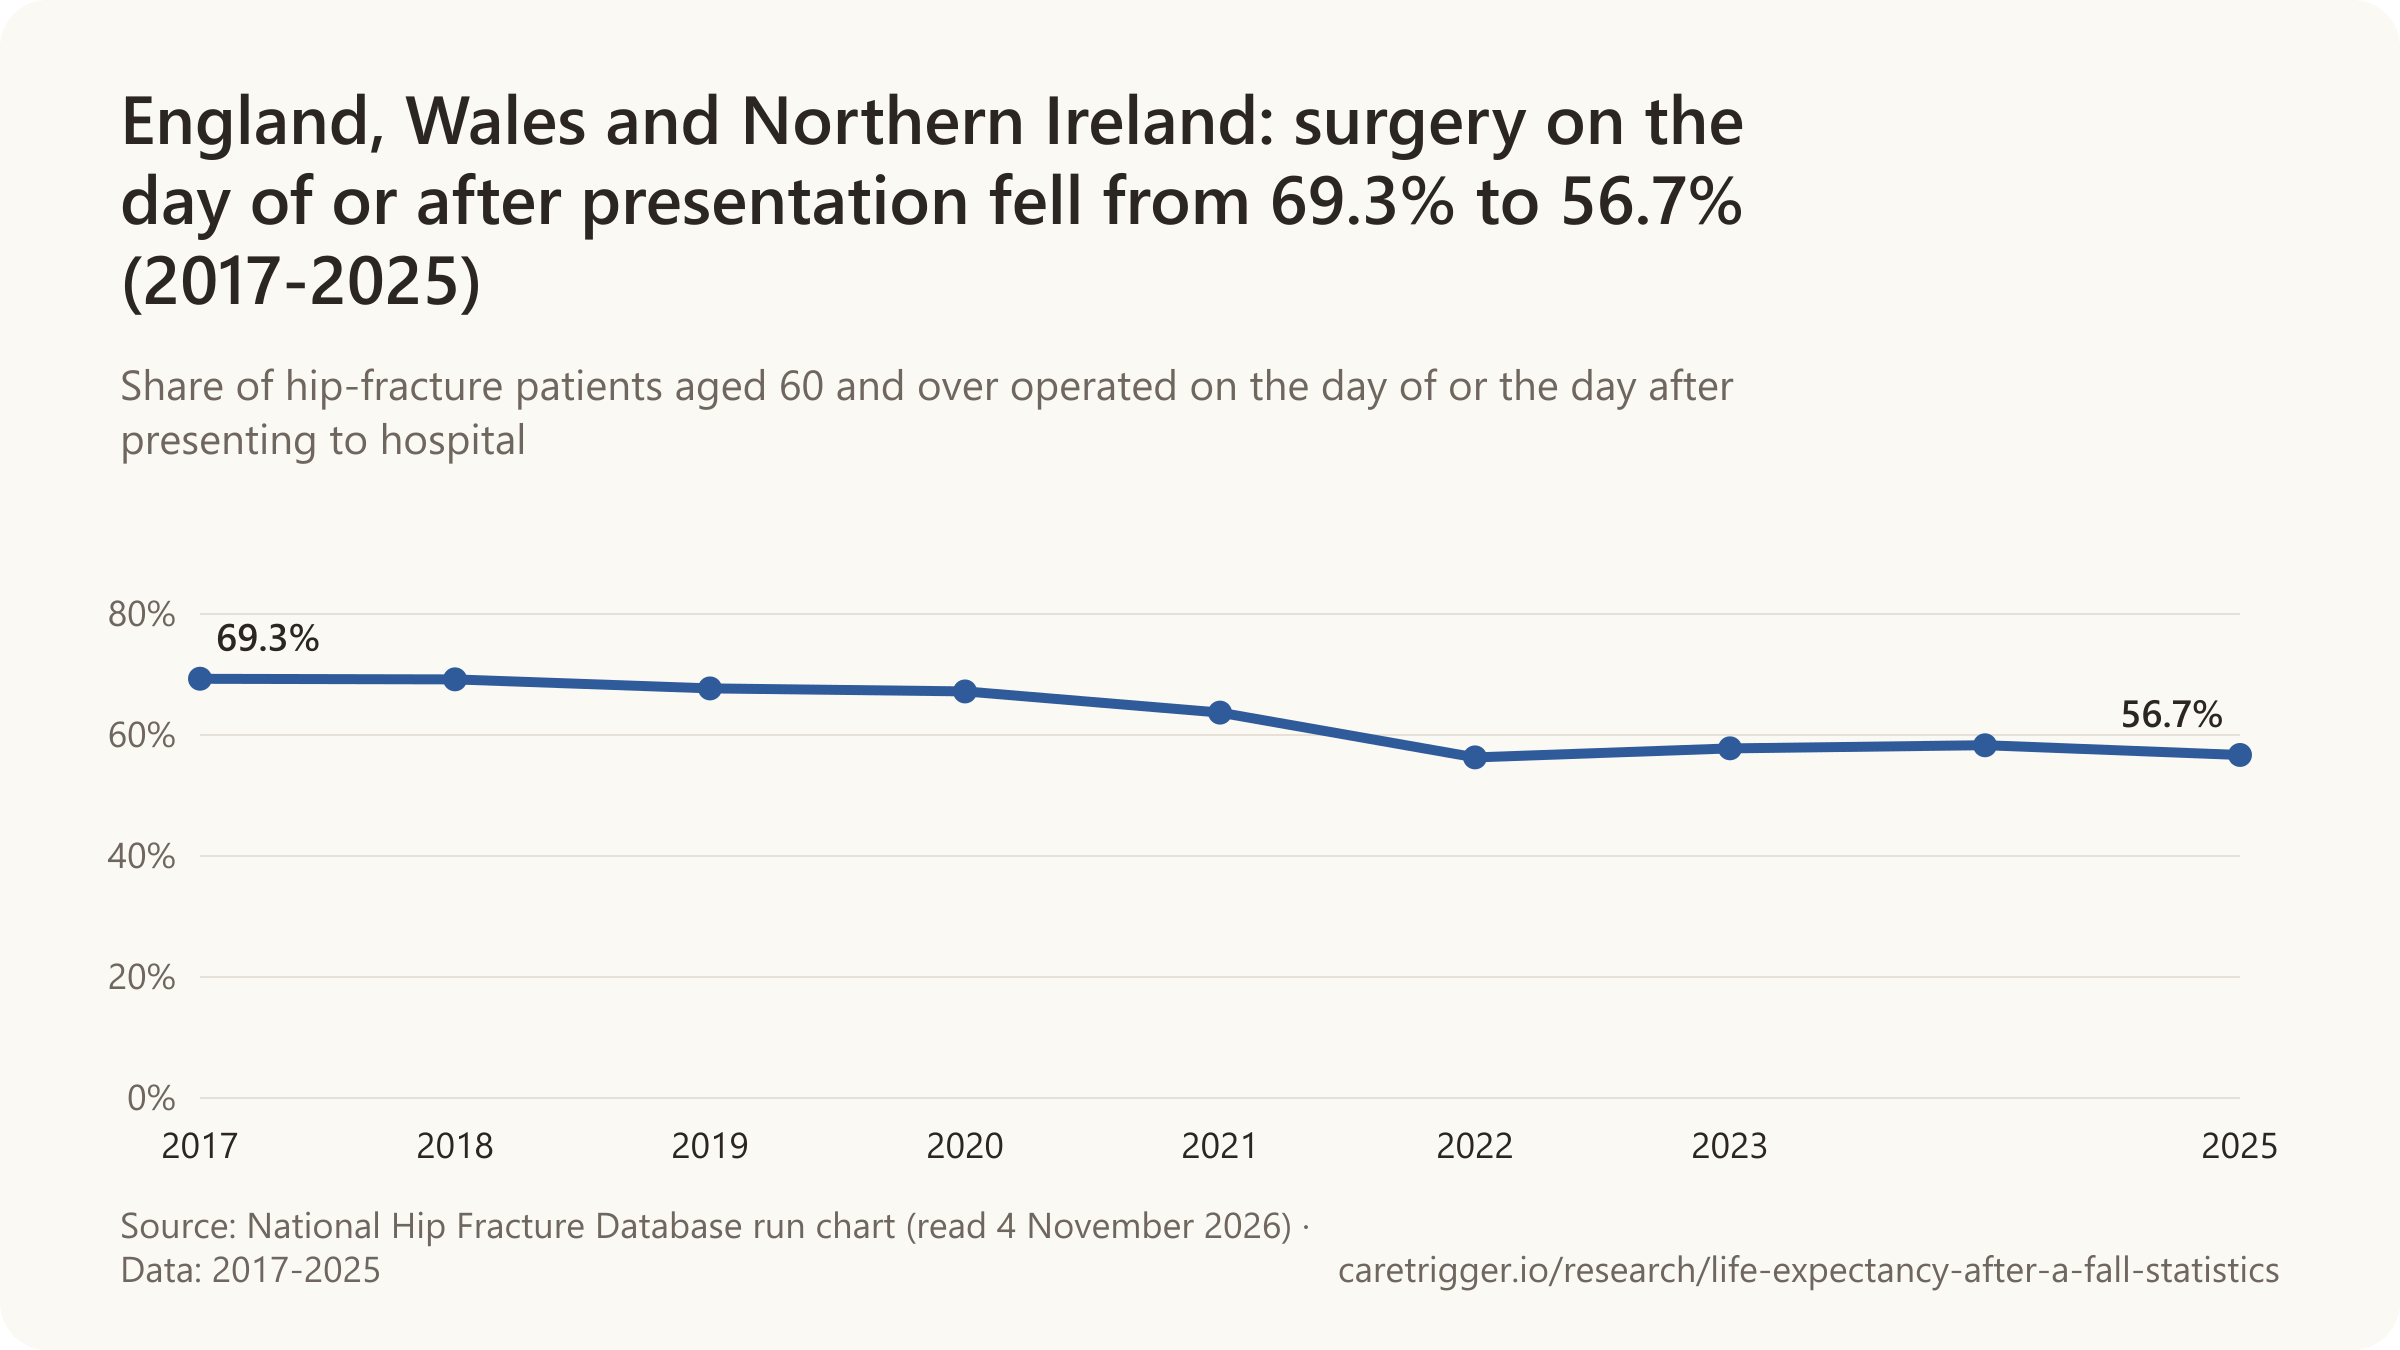
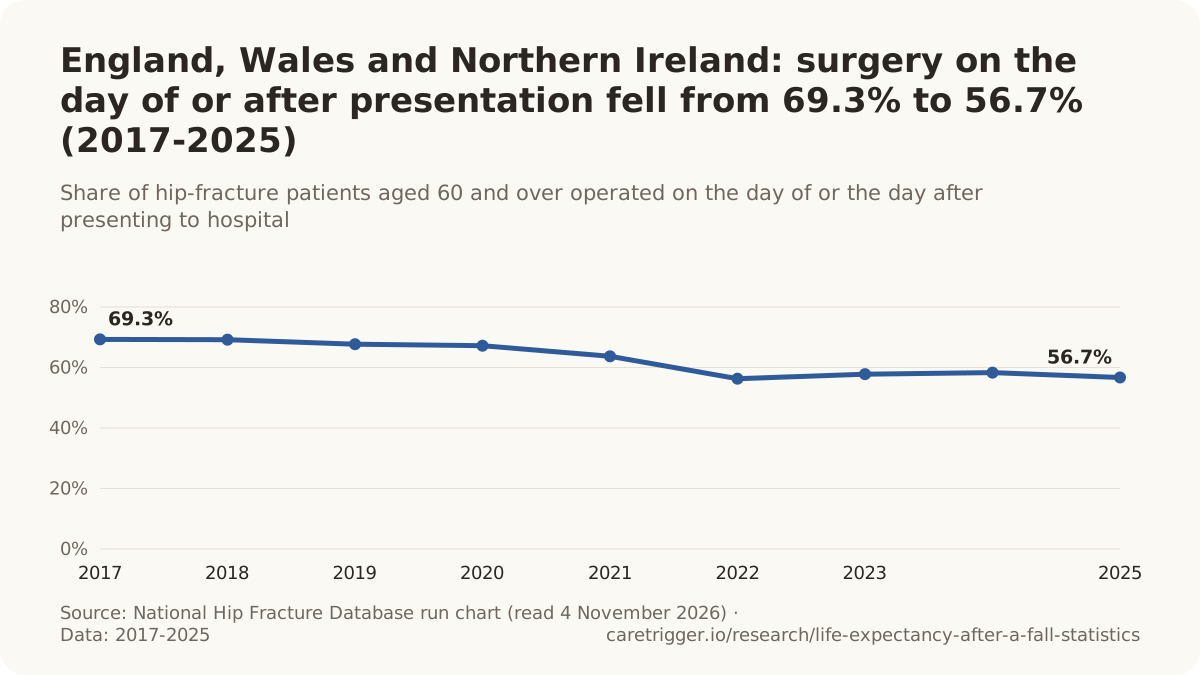
- In 2025, 30-day mortality after a hip fracture was 8.1% for the fifth of patients admitted to the poorest-performing hospitals in England and Wales, compared with 3.0% for the fifth admitted to the best-performing (National Hip Fracture Database, 2026).
- One-year mortality after a hip fracture in the UK fell from 22.3% before 2009 to 20.5% after (adjusted HR 0.86), in 31,495 patients with a first hip fracture, 2000-2010 (Klop et al., Bone, 2014).
- 30-day mortality after a hip fracture at one English trauma centre fell from 12.1% to 6.5% between 2006 and 2013, and 77% of these deaths happened in hospital (Chatterton et al., Bone & Joint Journal, 2015).
- In 2025, 82.1% of hip-fracture patients aged 60 and over in England, Wales and Northern Ireland were got out of bed by the day after their operation (National Hip Fracture Database KPI 4 run chart, 2026).
- In 2025, people aged 60 and over treated for a hip fracture in England, Wales and Northern Ireland spent an average of 20.3 days in the admitting hospital trust, including 15.7 days on the acute ward (National Hip Fracture Database run chart, 2026).
- In 2025, 30-day mortality after a hip fracture was 6.3% among people from the most deprived fifth of areas in England and Wales and 5.3% among the least deprived fifth (National Hip Fracture Database, 2026).
- The average time from presentation to hip-fracture surgery in England, Wales and Northern Ireland rose from 33.6 hours in 2020 to 39.3 hours in 2025 (National Hip Fracture Database, 2026).
- 72,623 people aged 60 and over were recorded with a hip fracture in England, Wales and Northern Ireland in 2025 (National Hip Fracture Database, 2026).
- The share of hip-fracture patients in England, Wales and Northern Ireland who die in the month after the fracture has halved since 2007, when it was 11%; 94% now survive beyond the first month (National Hip Fracture Database, 2025).
- 0.6% of hip-fracture patients in England, Wales and Northern Ireland were so unwell on arrival that they died before surgery could take place, in 2024 (National Hip Fracture Database, 2025).
- In 2024, 58% of hip-fracture patients in England, Wales and Northern Ireland had surgery by the day after they arrived, down from 68% in 2019 (National Hip Fracture Database, 2025).
- 30-day survival after a hip fracture in England, Wales and Northern Ireland was 94% in 2023, which the audit estimates means 8,435 more people survived over the 16 years since it began (National Hip Fracture Database, 2024).
- Thirty-day mortality after a hip fracture in England was 10.9% in 2007, when the National Hip Fracture Database started, and fell to 8.5% by 2011, according to an independent evaluation of national hospital data (National Hip Fracture Database, 2016).
- Thirty-day mortality after a hip fracture in England, Wales and Northern Ireland peaked at 8.7% for January admissions and was lowest at 6.7% for July admissions, over 2011-2018 (National Hip Fracture Database, 2019).
- About 325 more people (30% more) died within 30 days of a hip fracture in the three winter months than in the three summer months each year in England, Wales and Northern Ireland, over 2011-2018 (National Hip Fracture Database, 2019).
- Thirty-day mortality after a hip fracture in Northern Ireland fell from 6.3% in 2012-13 to 4.9% in 2017, lower than in England (7.1%) and Wales (7.8%) (National Hip Fracture Database, 2018).
- Thirty-day mortality after a hip fracture in England fell from 8.4% at the start of 2012 to 7.1% in 2017 (National Hip Fracture Database, 2018).
- Fitter hip-fracture patients (ASA grade 1 to 3) who stayed on non-specialist "outlying" wards had an inpatient mortality of 8.3%, compared with 5.0% for those who reached an orthopaedic or orthogeriatric ward (National Hip Fracture Database, 2023).
Scotland
- In Scotland, 8.6% of hip-fracture patients died within 30 days of admission in 2020, up from 7.9% in 2019 (Scottish Hip Fracture Audit, Public Health Scotland, 2021).
- In Scotland, 7.9% of hip-fracture patients died within 30 days of admission in 2019 (Scottish Hip Fracture Audit, Public Health Scotland, 2021).
- In Scotland, 7.2% of hip-fracture patients died within 30 days of admission in 2022 (30-day survival 92.8%) (Scottish Hip Fracture Audit, Public Health Scotland, 2024).
- In Scotland, 7.0% of hip-fracture patients (582 of 8,355) died within 30 days of admission in 2023 (Scottish Hip Fracture Audit, Public Health Scotland, 2024).
- In Scotland in 2023, 30-day survival after a hip fracture was 92% to 94% in every deprivation fifth, with no consistent gradient (Scottish Hip Fracture Audit, Public Health Scotland, 2024).
- In Scotland, 72% of eligible hip-fracture patients had surgery within 36 hours of admission in 2021, against 71% in 2020 and 76% in 2019 (Scottish Hip Fracture Audit, Public Health Scotland, 2022).
- In Scotland, the median time from admission to hip-fracture surgery was 24.3 hours in 2023 (Scottish Hip Fracture Audit, Public Health Scotland, 2024).
- In Scotland, patients admitted with a hip fracture spent an average of 17 days in hospital care in 2025, more than twice the average inpatient stay of 7 days (Scottish Hip Fracture Audit, Public Health Scotland, 2026).
- 8,426 people aged 50 and over had a hip fracture recorded by the Scottish Hip Fracture Audit in 2024, up from 8,355 in 2023 (Public Health Scotland, 2025).
- Scottish hip-fracture patients had 7.2% higher odds of surviving 30 days for each 1% increase in the share of hip-fracture care standards met, adjusting for age, gender and other factors (Scottish Health Technologies Group, 2023).
Ireland
- In Ireland, 4% of hip-fracture patients (182 people) died in hospital in 2024 (Irish Hip Fracture Database, National Office of Clinical Audit, 2025).
- In Ireland, 5% of hip-fracture patients (180 people) died in hospital in 2023 (Irish Hip Fracture Database, National Office of Clinical Audit, 2024).
- In Ireland in 2024, 78% of hip-fracture patients had surgery within 48 hours (44% within 24 hours, 61% within 36 hours), with a median wait of 26 hours (Irish Hip Fracture Database, 2025).
- In Ireland in 2024, hip-fracture patients spent a mean of 19 days (median 12 days) in the acute hospital (Irish Hip Fracture Database, 2025).
- 4,294 hip fractures in people aged 60 and over were recorded by the Irish Hip Fracture Database in 2024, the highest annual number so far (National Office of Clinical Audit, 2025).
- At University Hospital Waterford, an Irish hospital with near-complete follow-up, 21.5% of hip-fracture patients died within a year in 2022, 5.7% within 30 days and 13.7% within 120 days (423 patients) (Irish Hip Fracture Database, 2025).
- In Ireland, in-hospital mortality after a hip fracture fell from 5% to 4% between 2013 and 2024, and mean hospital stay from 20 to 19 days (Brent et al., Archives of Osteoporosis, 2026).
- In Ireland, 77% of hip-fracture patients were operated within 48 hours in 2024, up from 70% in 2013, and the share discharged directly home rose from 20% to 22% (Brent et al., Archives of Osteoporosis, 2026).
Denmark

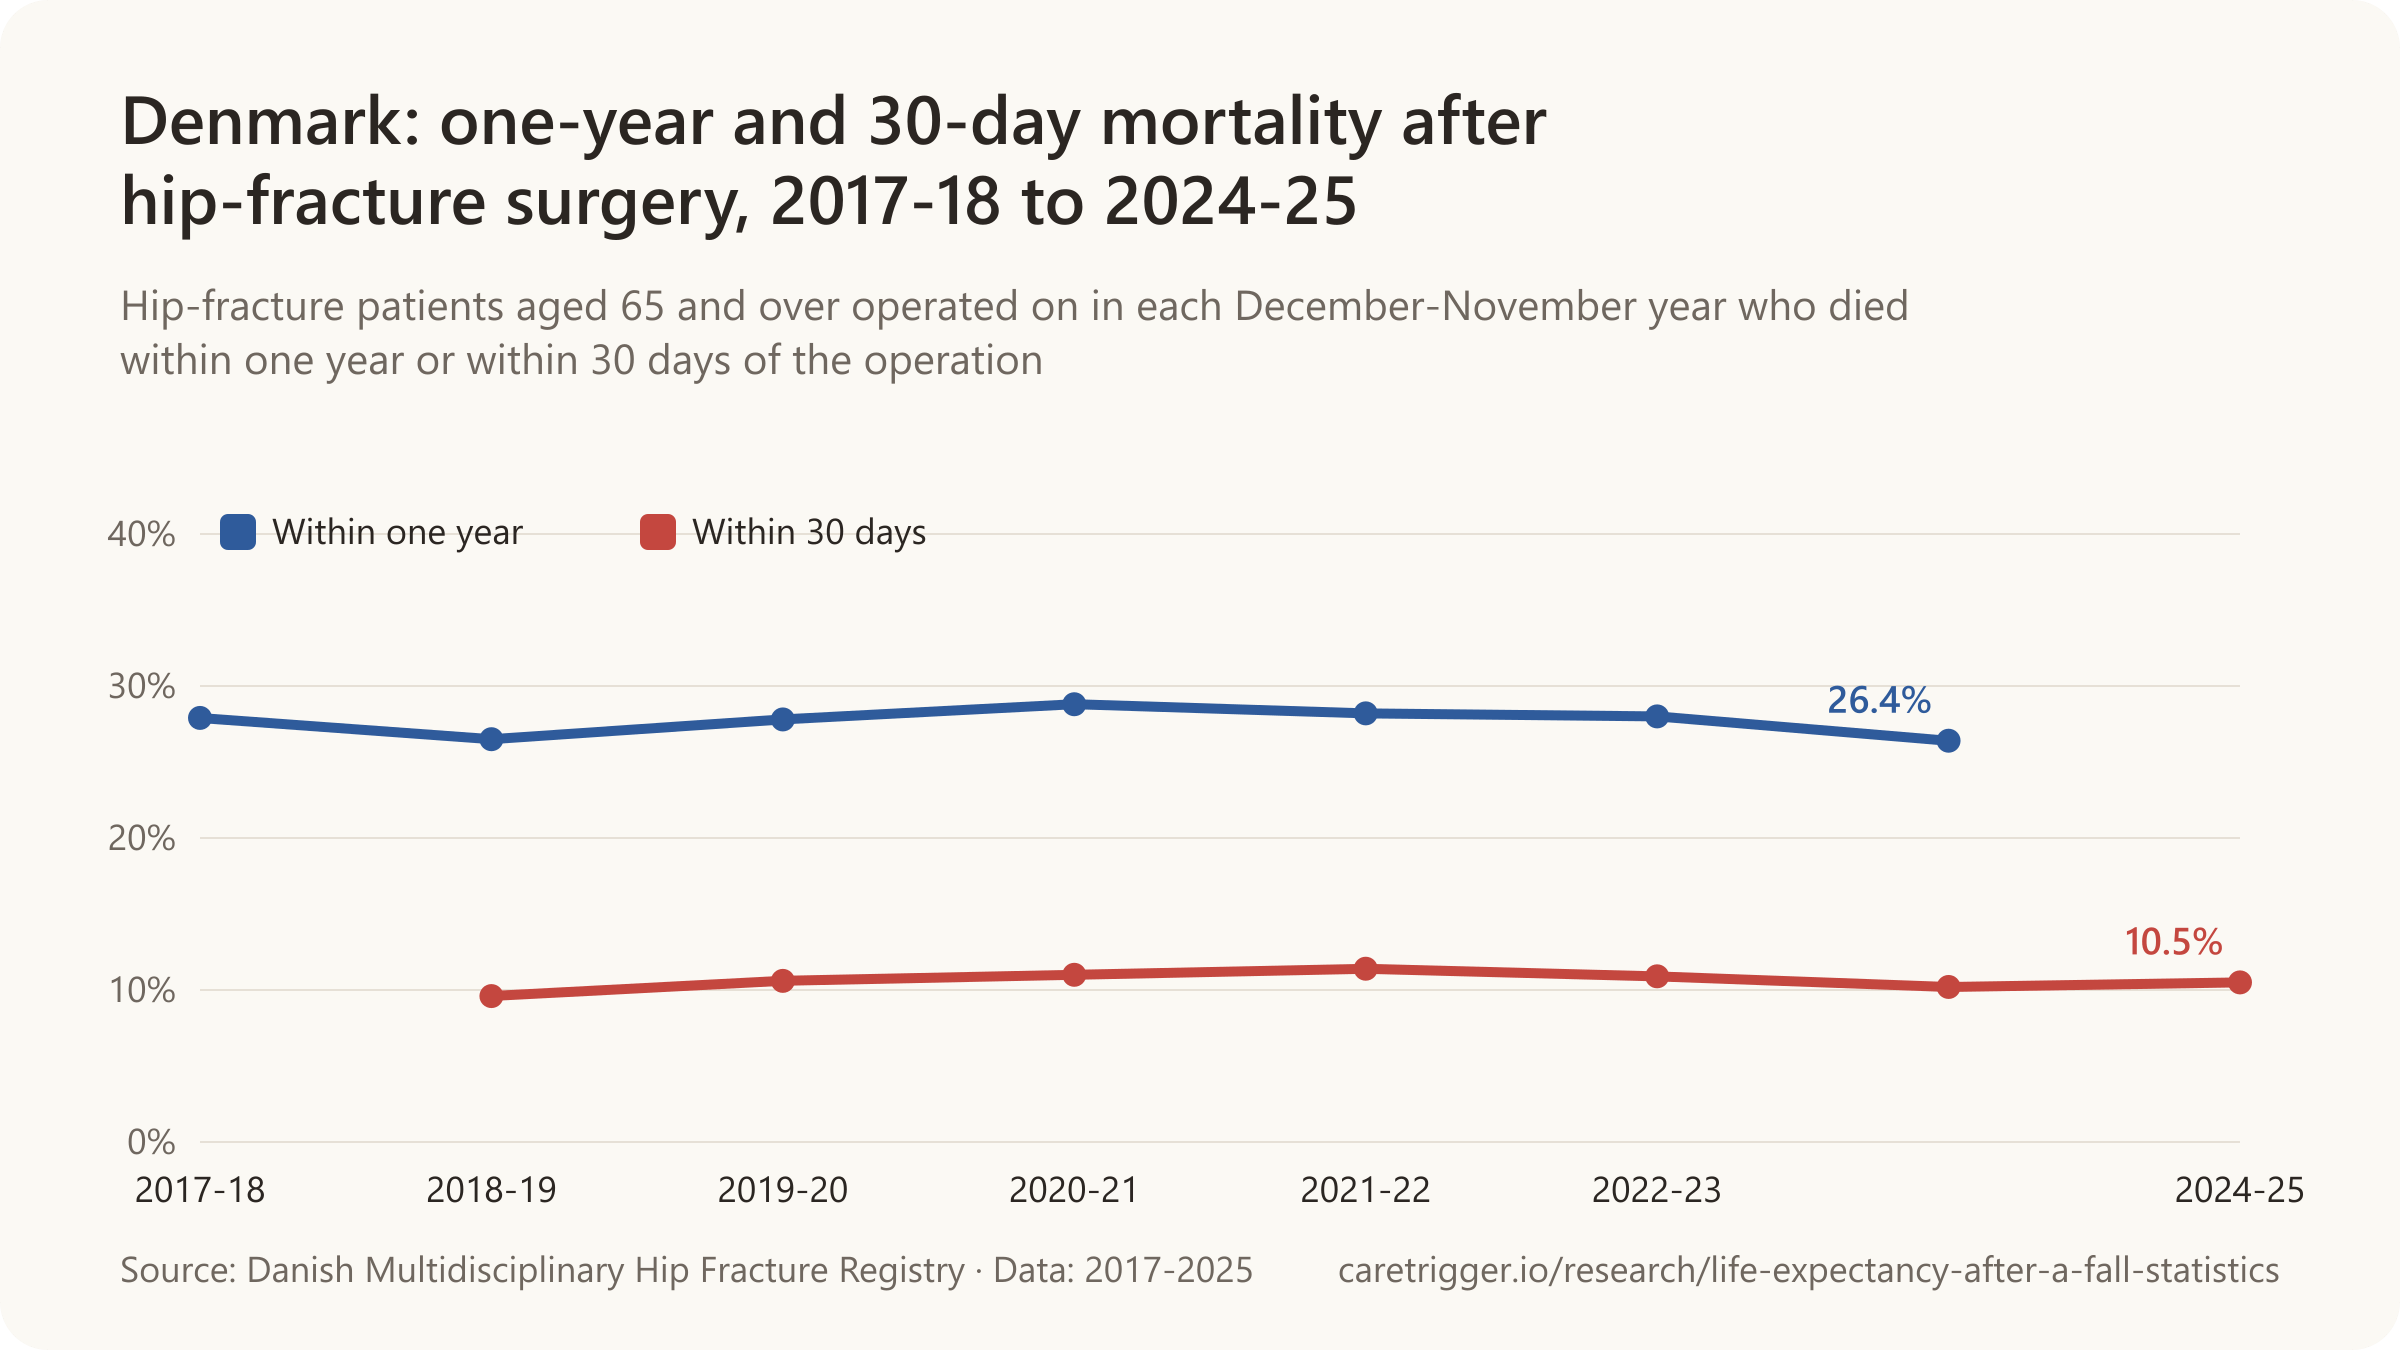
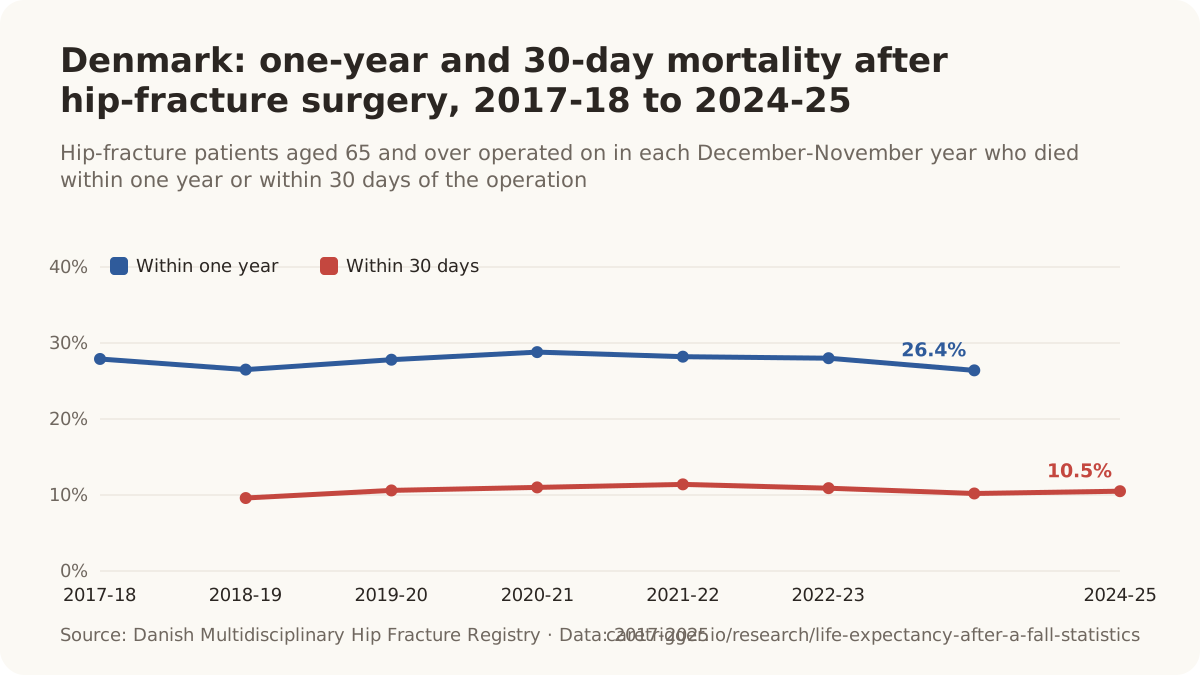

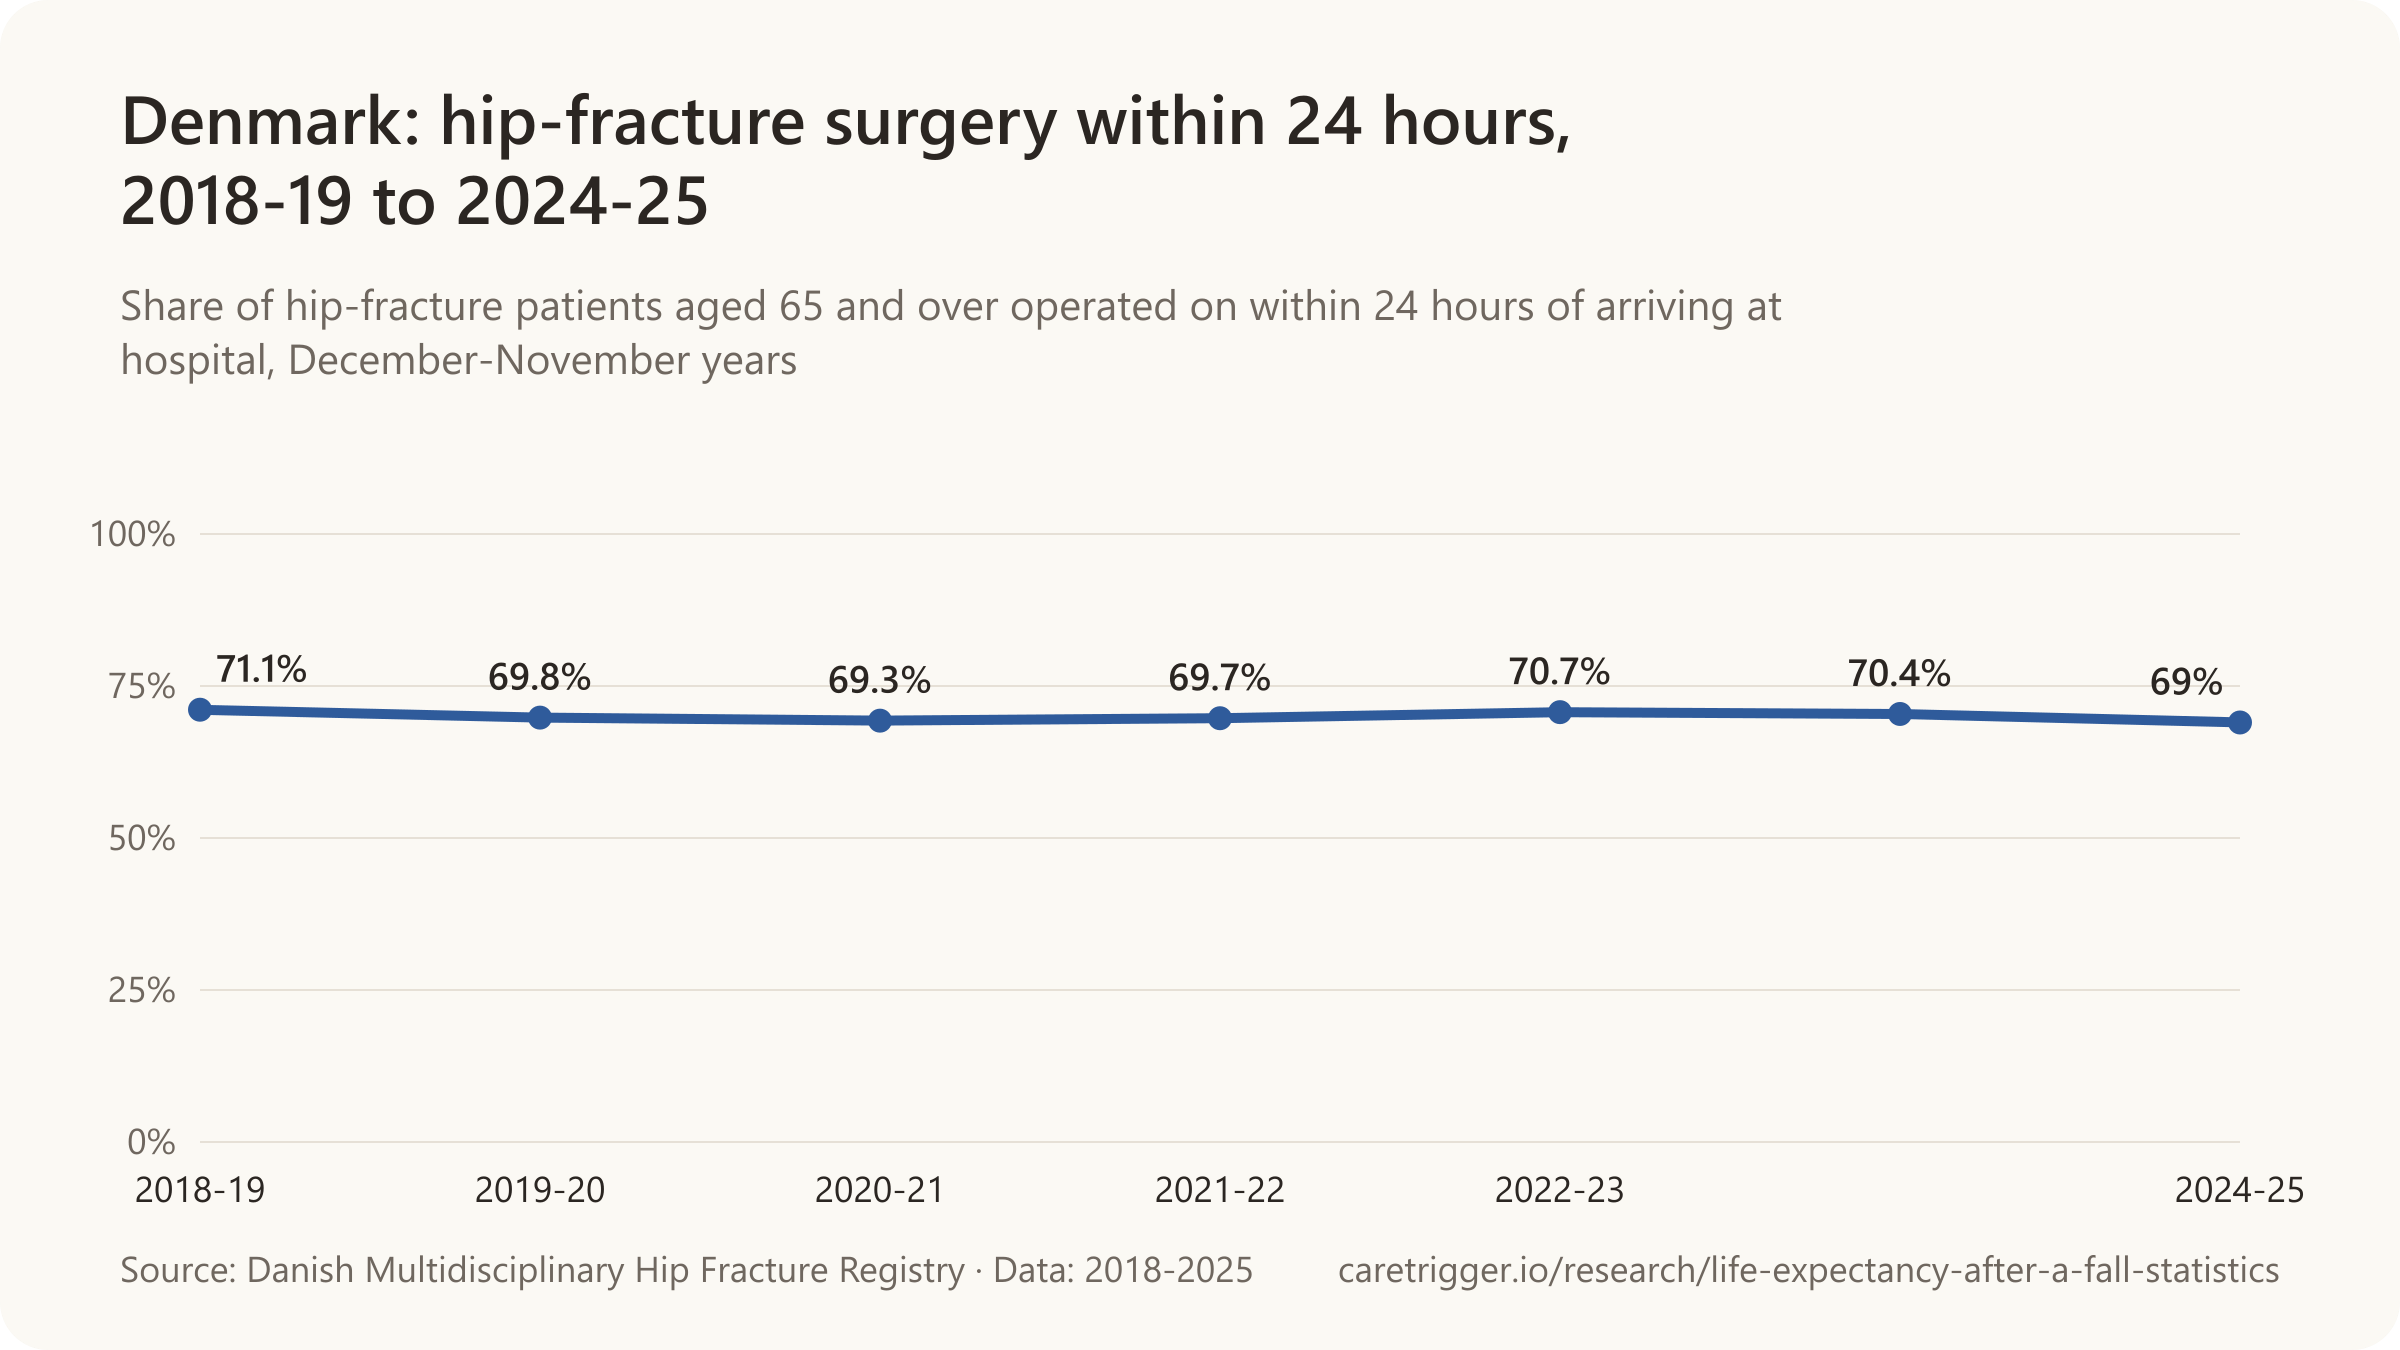
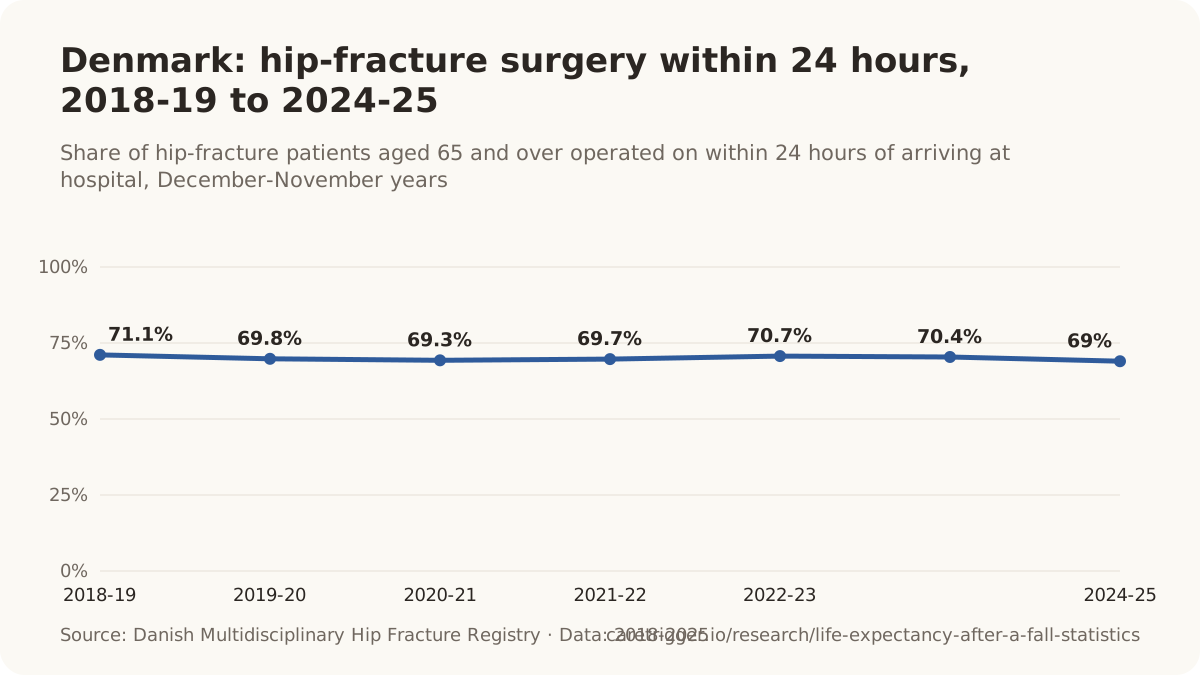
- 9.6% of Danish hip-fracture patients died within 30 days of surgery (113,721 patients, 2000-2014), with no decline over the 15 years (Gundel et al., Acta Orthopaedica, 2020).
- 16% of Danish hip-fracture patients died within 90 days of surgery (113,721 patients, 2000-2014), with no decline over the 15 years (Gundel et al., Acta Orthopaedica, 2020).
- 27% of Danish hip-fracture patients died within one year of surgery (113,721 patients, 2000-2014), with no decline over the 15 years (Gundel et al., Acta Orthopaedica, 2020).
- 30-day mortality after a first hip fracture was 9.7% among Danish patients in 1999 (no significant change 1999-2012) (Jantzen et al., Acta Orthopaedica, 2018).
- 30-day mortality after a first hip fracture was 10.3% among Danish patients in 2012 (no significant change 1999-2012) (Jantzen et al., Acta Orthopaedica, 2018).
- 1-year mortality after a first hip fracture was 28.2% among Danish patients in 1999 (no significant change 1999-2012) (Jantzen et al., Acta Orthopaedica, 2018).
- 1-year mortality after a first hip fracture was 27.4% among Danish patients in 2012 (no significant change 1999-2012) (Jantzen et al., Acta Orthopaedica, 2018).
- 1-year mortality after a first hip fracture was 33.5% among Danish men in 1999 (no significant change 1999-2012) (Jantzen et al., Acta Orthopaedica, 2018).
- 1-year mortality after a first hip fracture was 31.3% among Danish men in 2012 (no significant change 1999-2012) (Jantzen et al., Acta Orthopaedica, 2018).
- 1-year mortality after a first hip fracture was 26.0% among Danish women in 1999 (no significant change 1999-2012) (Jantzen et al., Acta Orthopaedica, 2018).
- 1-year mortality after a first hip fracture was 25.5% among Danish women in 2012 (no significant change 1999-2012) (Jantzen et al., Acta Orthopaedica, 2018).
- In Denmark, 10.5% of hip-fracture patients aged 65+ died within 30 days of their operation in Dec 2024-Nov 2025 (Danish Multidisciplinary Hip Fracture Registry, 2026).
- In Denmark, 24.5% of hip-fracture patients who could not take part at all in their first mobilisation after surgery (Cumulated Ambulation Score 0) died within 30 days, compared with 1.6% of those who scored 5 (Danish Multidisciplinary Hip Fracture Registry, 2026).
- In Denmark, the median hospital stay after a hip fracture fell from 7.3 days in 2016 to 5.9 days in 2025 for patients aged 65+ (Danish Multidisciplinary Hip Fracture Registry, 2026).
- The Danish Multidisciplinary Hip Fracture Registry recorded 7,339 patients aged 65+ operated for a hip fracture between December 2024 and November 2025 (Danish Multidisciplinary Hip Fracture Registry, 2026).
- In Denmark, the median hospital stay after hip-fracture surgery fell from 14 to 8 days between 2000 and 2014 while mortality stayed the same (Gundel et al., Acta Orthopaedica, 2020).
Sweden

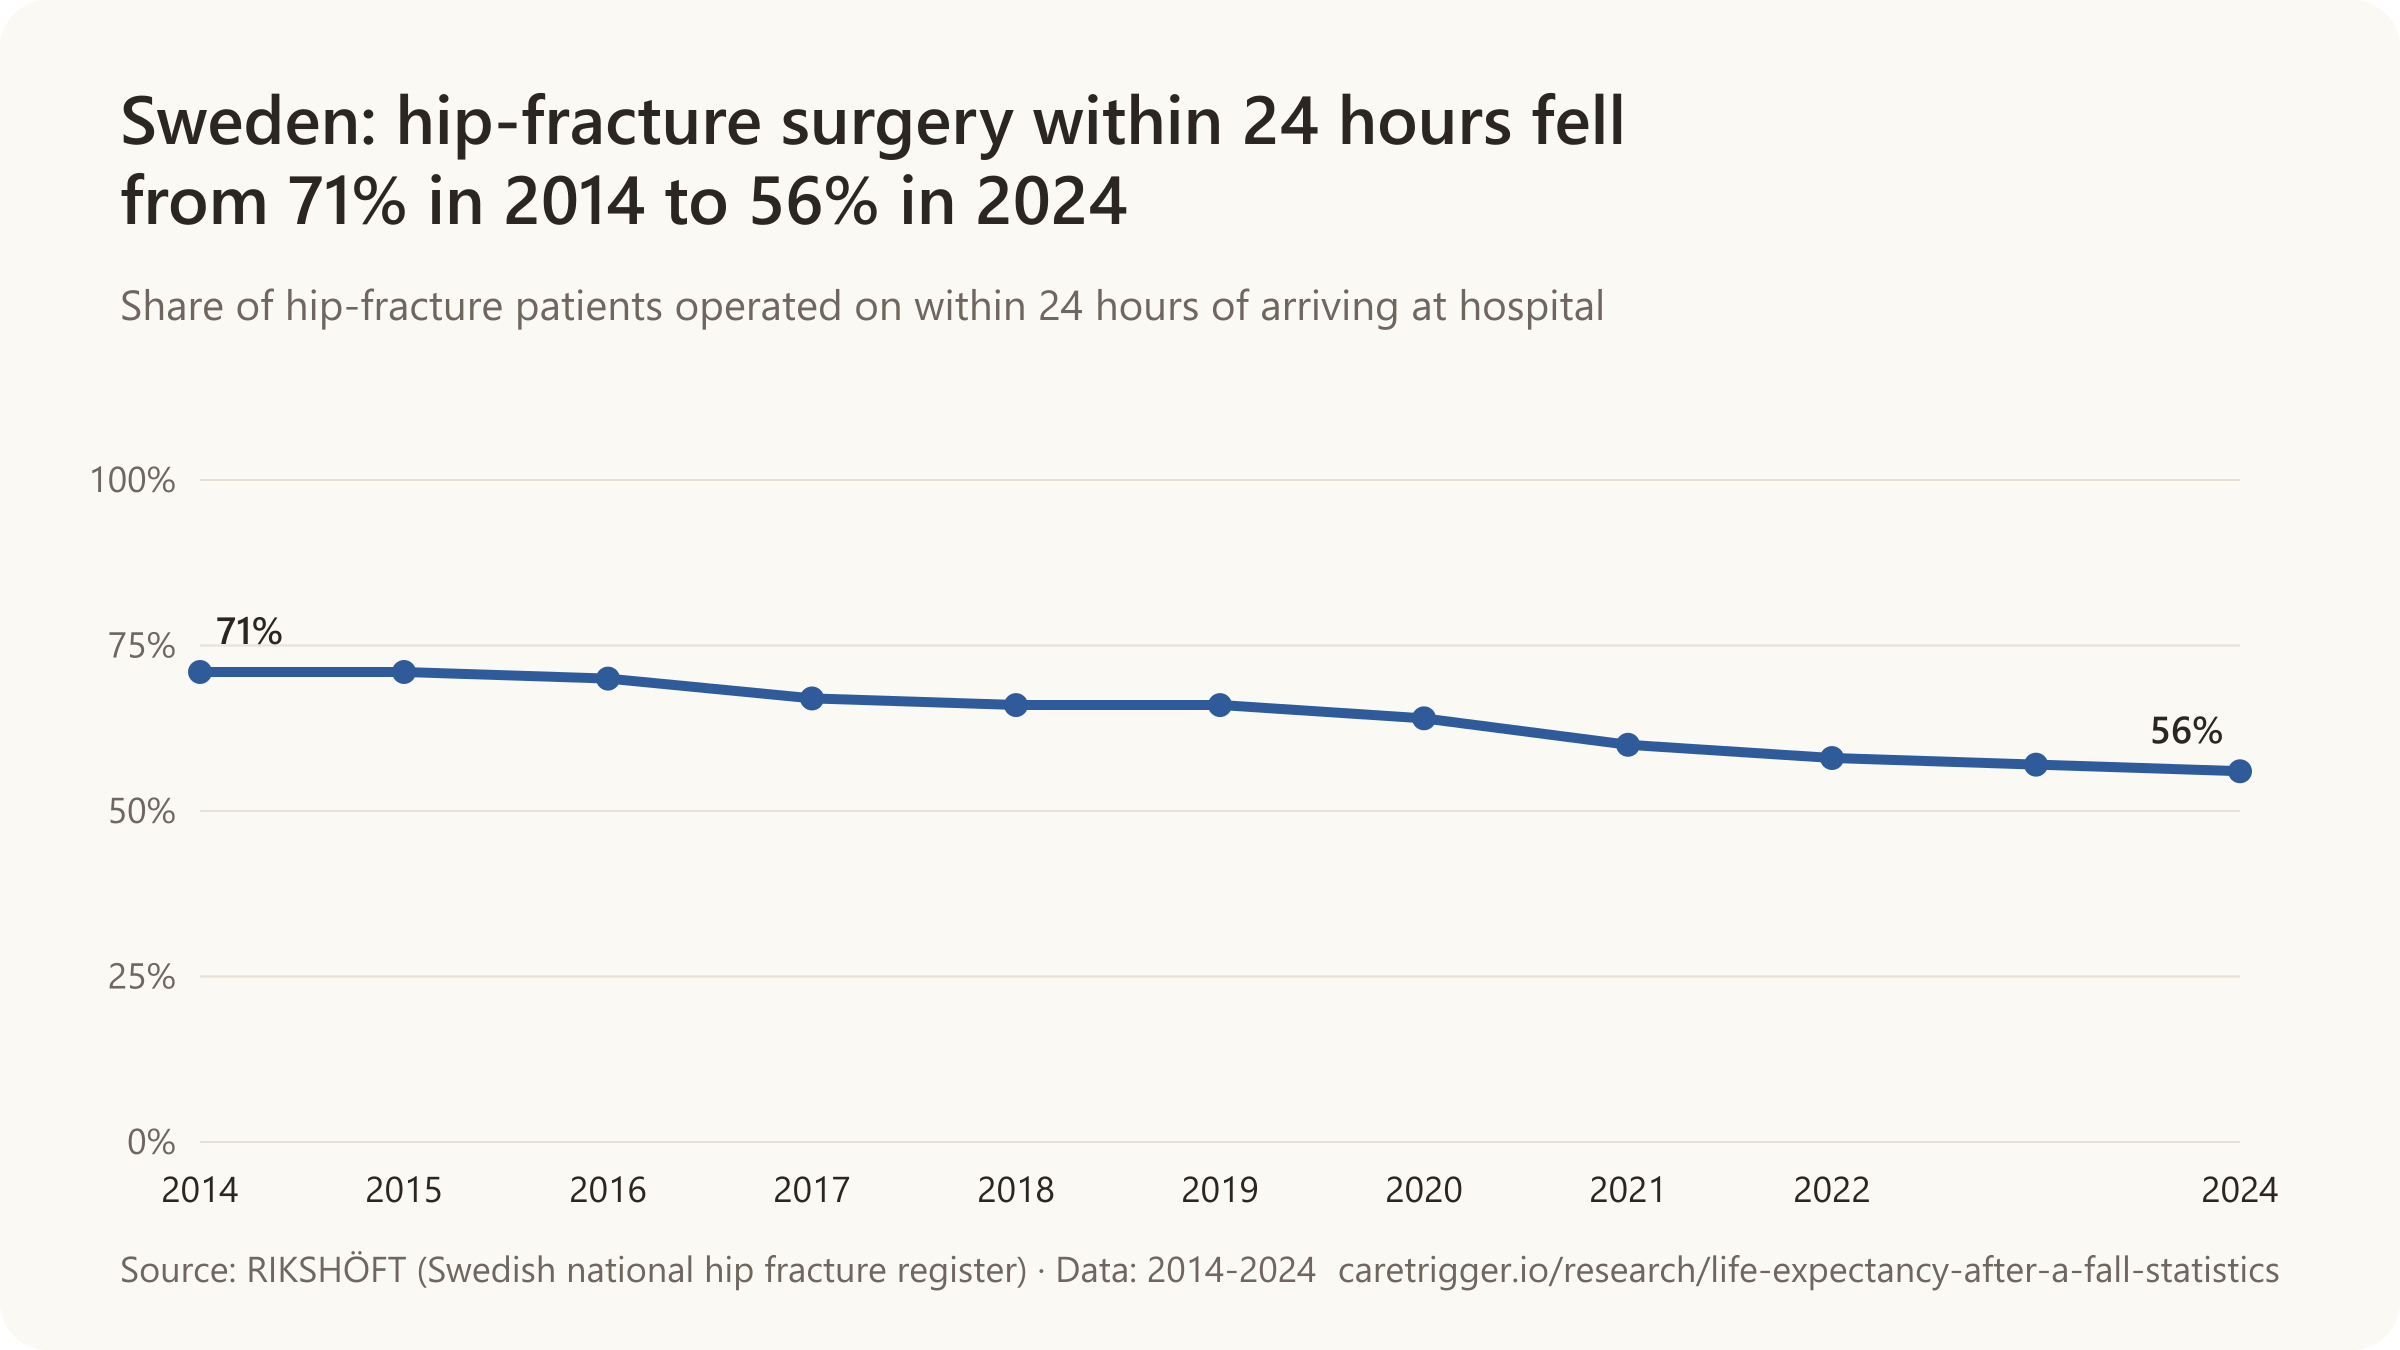
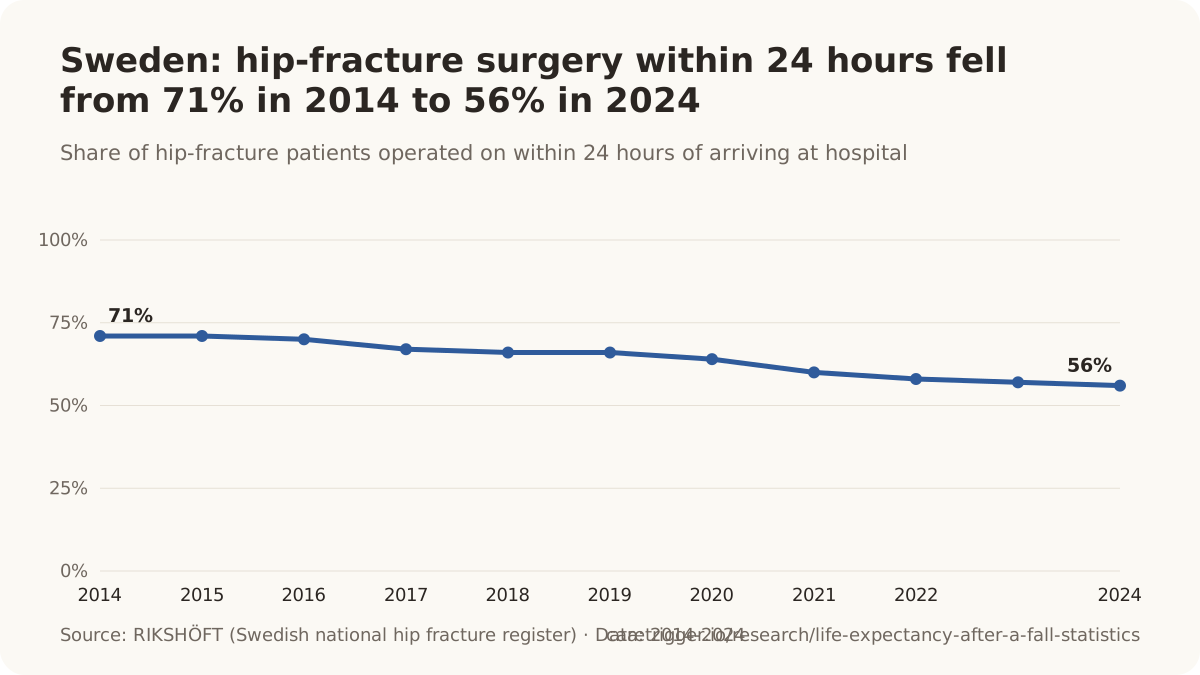

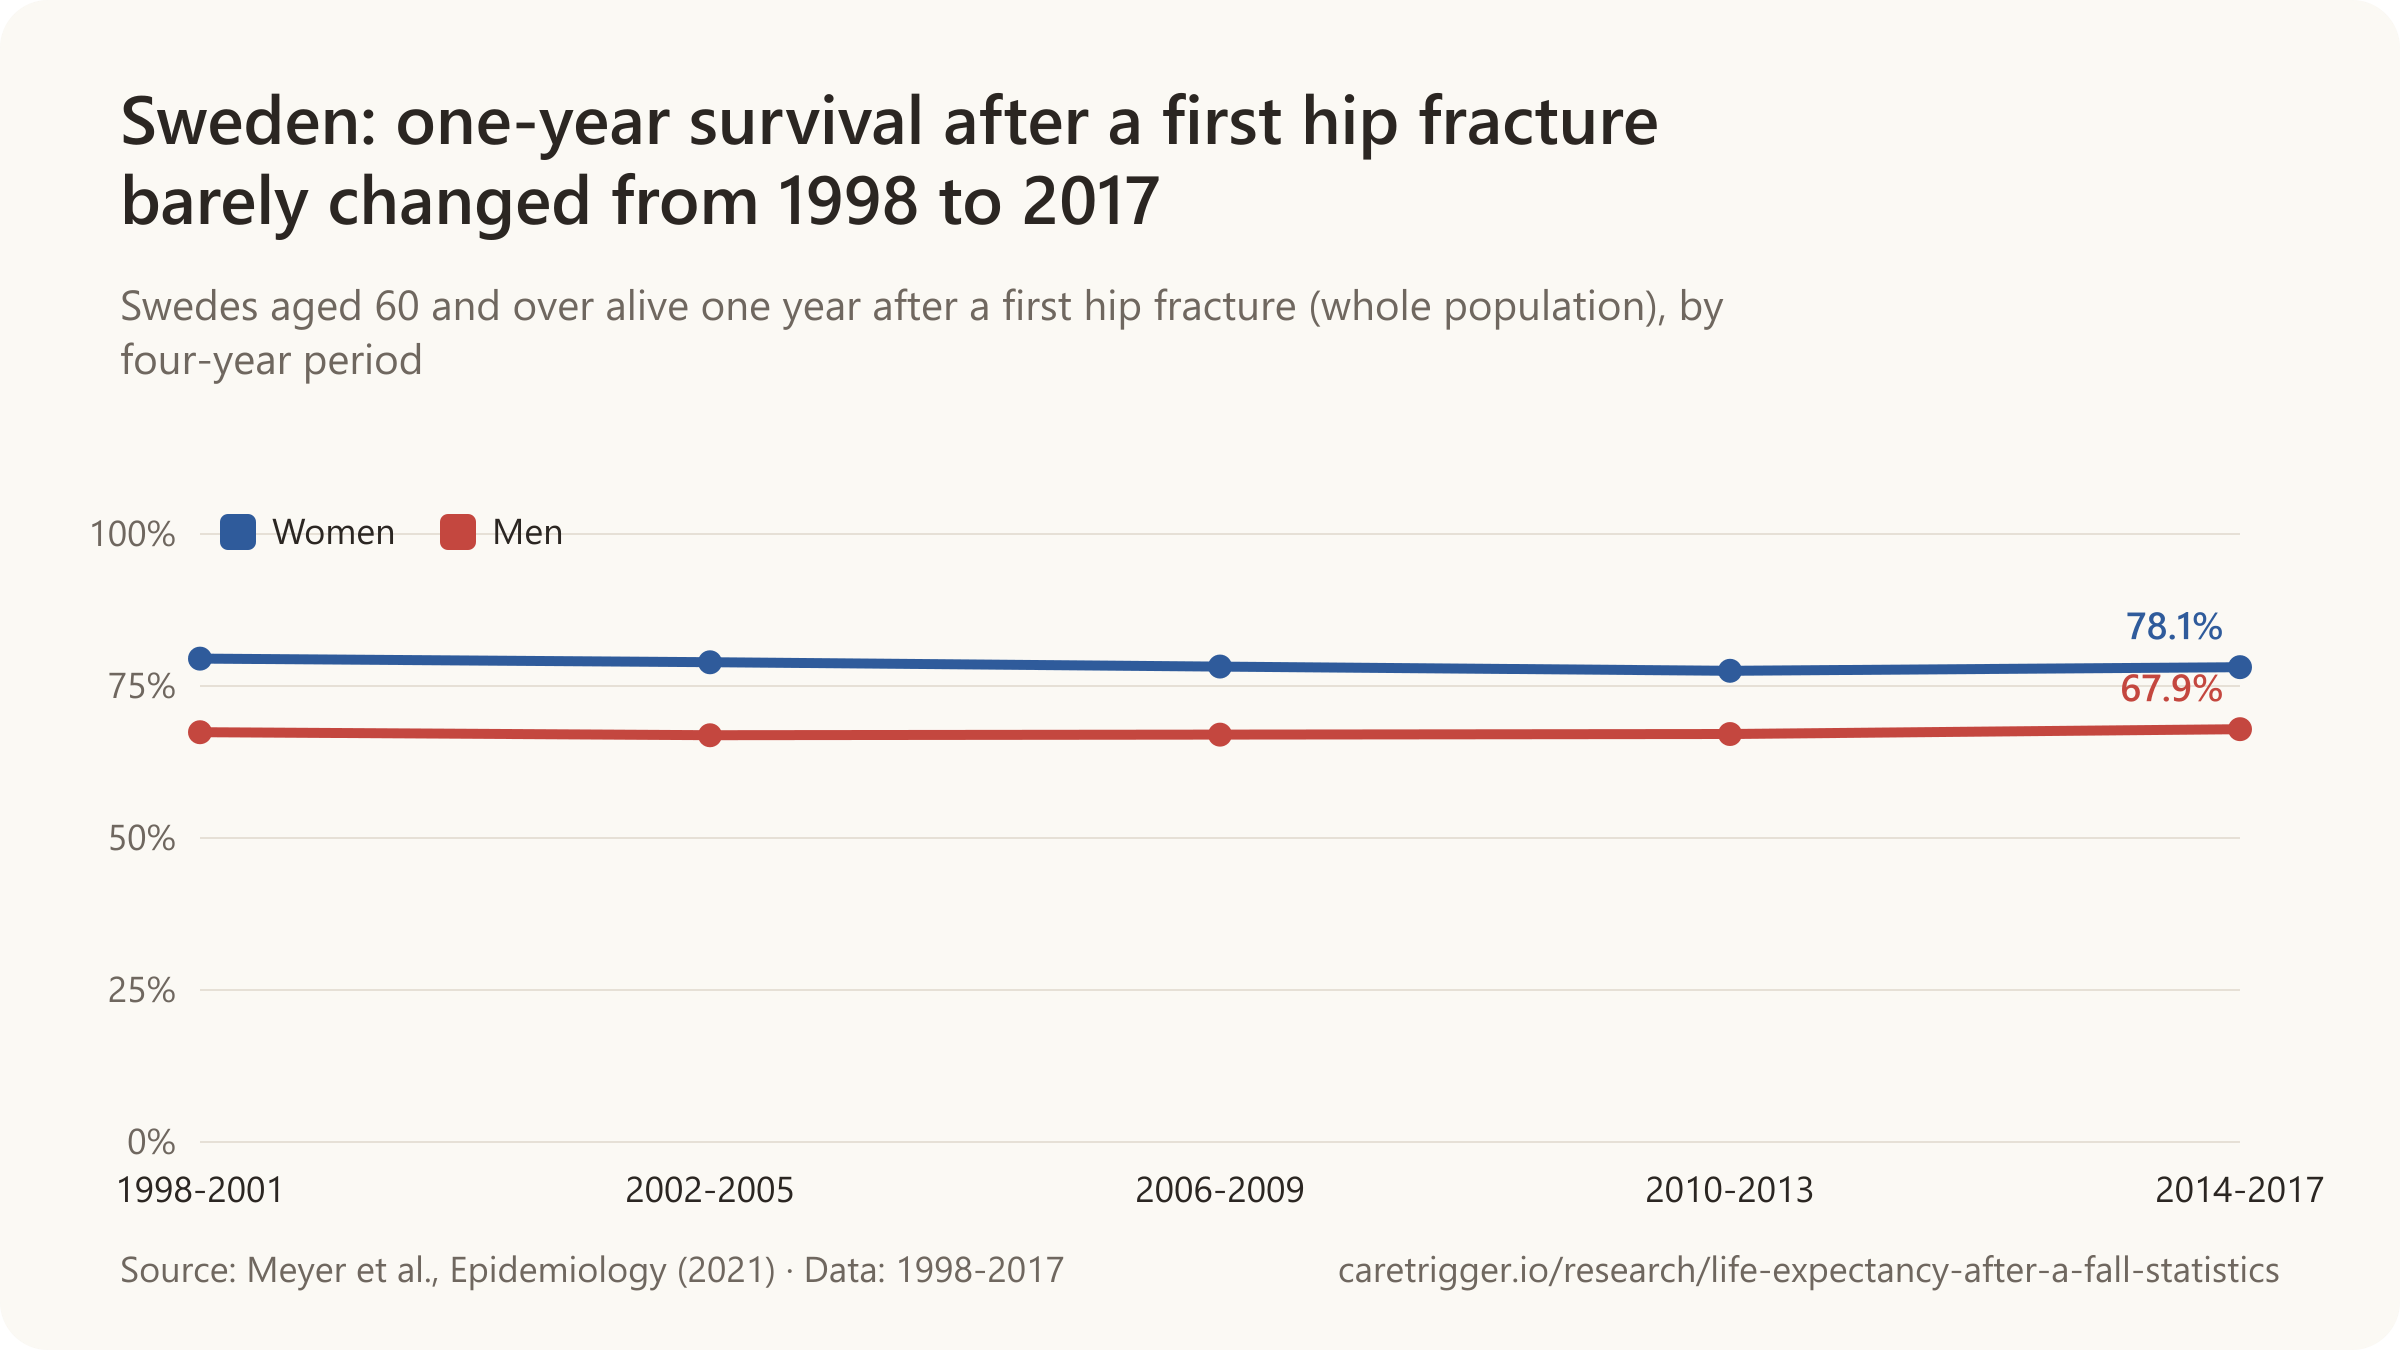
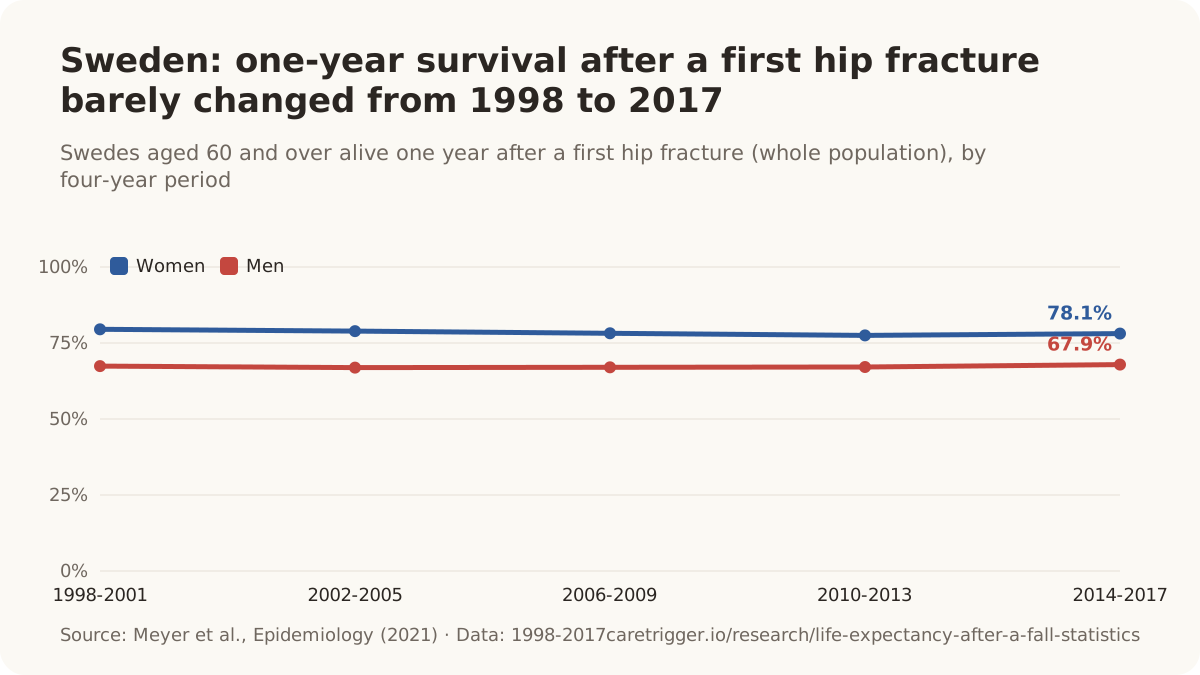
- 95.5% of Swedish women aged 60+ were alive 30 days after a first hip fracture in 1998-2001 (Meyer et al., Epidemiology, 2021).
- 93.9% of Swedish women aged 60+ were alive 30 days after a first hip fracture in 2014-2017 (Meyer et al., Epidemiology, 2021).
- 90.5% of Swedish men aged 60+ were alive 30 days after a first hip fracture in 1998-2001 (Meyer et al., Epidemiology, 2021).
- 88.8% of Swedish men aged 60+ were alive 30 days after a first hip fracture in 2014-2017 (Meyer et al., Epidemiology, 2021).
- About 20% of women and 30% of men in Sweden died within one year of their first hip fracture, a share that did not improve between 1998 and 2017 (Meyer et al., Epidemiology, 2021).
- Among Swedish hip-fracture patients with two or more other illnesses, one-year survival improved from 49% to 57% for men and from 72% to 78% for women between 1998 and 2017 (Meyer et al., Epidemiology, 2021).
- In Sweden, 76% of hip-fracture patients were operated on within 36 hours of arriving at hospital in 2024, down from 86% in 2019 (RIKSHÖFT, 2025).
- In Sweden, the average wait from arrival at hospital to hip-fracture surgery rose from 23.5 hours in 2019 to 28 hours in 2024 (RIKSHÖFT, 2025).
- In Sweden, the average hospital stay after a hip fracture fell from 7 days in 2019 to 6.2 days in 2024 (RIKSHÖFT, 2025).
- Sweden has an estimated 16,500 falls a year that lead to a hip fracture (RIKSHÖFT, 2025).
- In Sweden, 8% of people aged 50+ with a hip fracture died within 30 days in 2023 (Swedish Fracture Register, 2024).
- Sweden's national healthcare indicator site Vården i siffror has shown one-year mortality after a hip fracture at a fairly steady 25% through the 2010s for people aged 50+, as reported by the Swedish Fracture Register (Swedish Fracture Register, 2025).
- In Sweden, 57% of people over 60 with an unstable trochanteric hip fracture and 60% with a displaced femoral neck fracture who were not operated on died within 30 days in 2023-2025 (Swedish Fracture Register, 2026).
Norway
- 24.3% of Norwegians with a first hip fracture (35,498 of 146,132) died within one year (1999-2016) (Holvik et al., BMC Geriatrics, 2023).
- In Norway, 92% of patients operated for a hip fracture were alive 30 days after treatment, according to the Norwegian Hip Fracture Register (Norwegian Hip Fracture Register, 2025).
- In Norway, 24% of patients operated for a hip fracture die within one year, according to the Norwegian Hip Fracture Register (Norwegian Hip Fracture Register, 2025).
- In Norway, 84% of hip fractures were operated on within 48 hours of the fracture in 2024 (Norwegian Hip Fracture Register, 2025).
- The Norwegian Hip Fracture Register recorded 8,375 primary hip-fracture operations in 2024; about 9,000 people in Norway break a hip each year (Norwegian Hip Fracture Register, 2025).
- In Norway, 91.1% of people aged 65+ admitted to hospital with a hip fracture were alive 30 days later, a figure that has been stable over time (Norwegian Directorate of Health, 2025).
- In Norway, about 8.9% of people aged 65+ admitted to hospital with a hip fracture died within 30 days, computed as 100% minus the 91.1% 30-day survival reported for 2024 (Norwegian Directorate of Health, 2025).
Finland

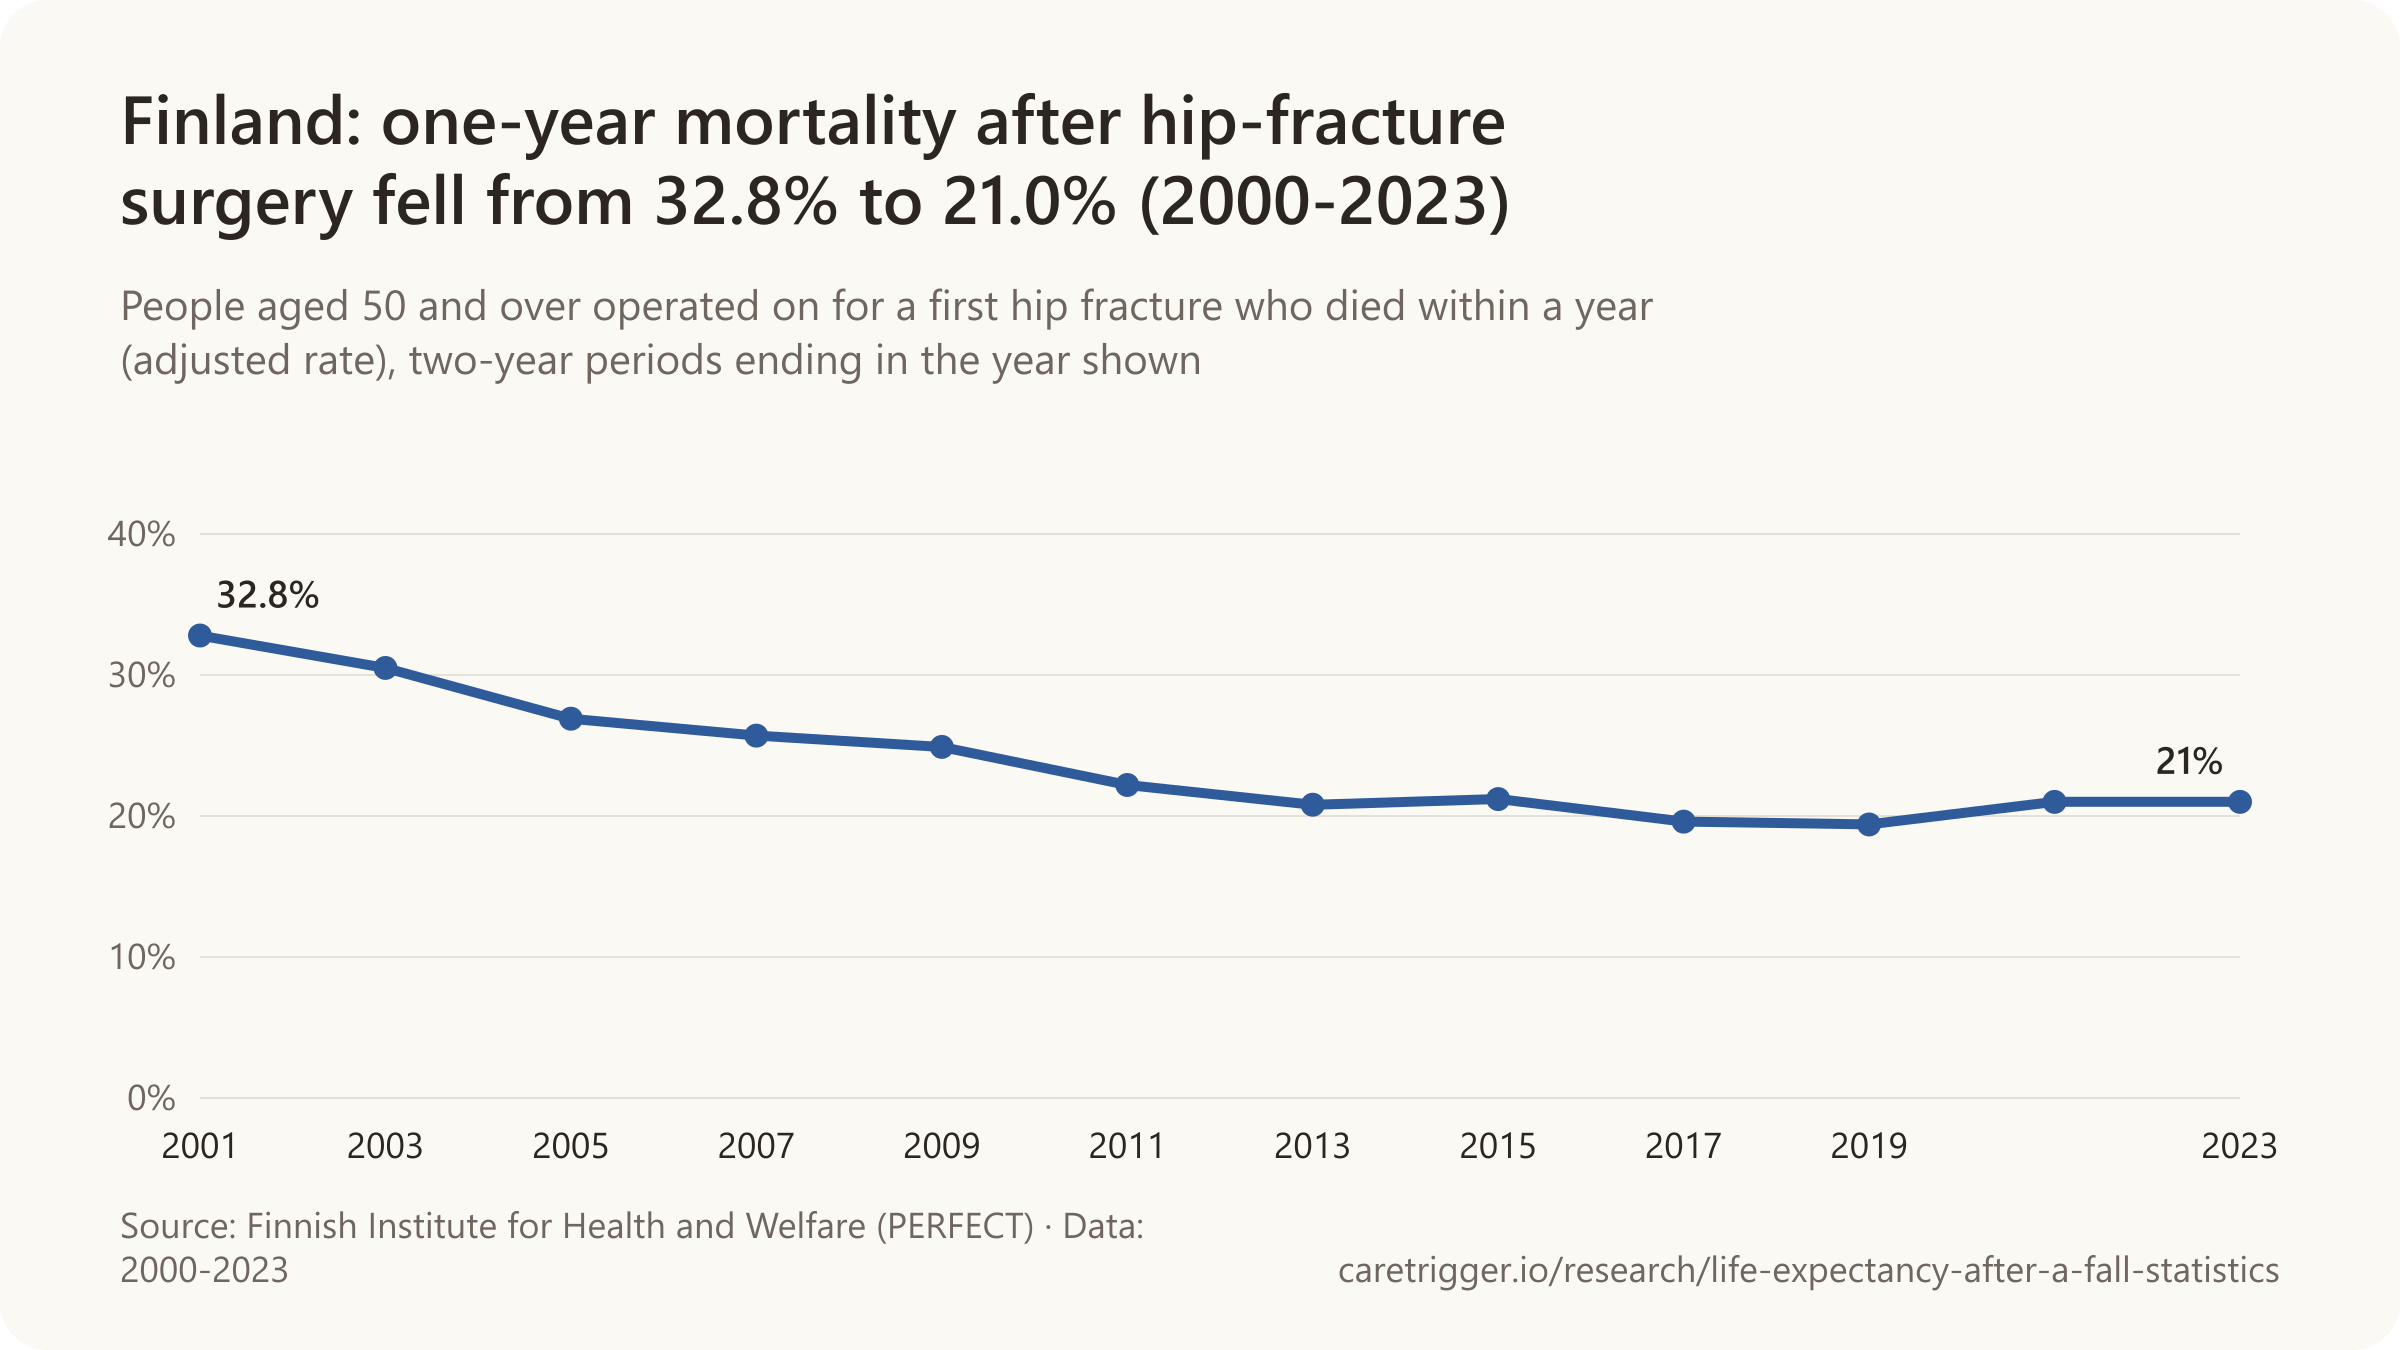

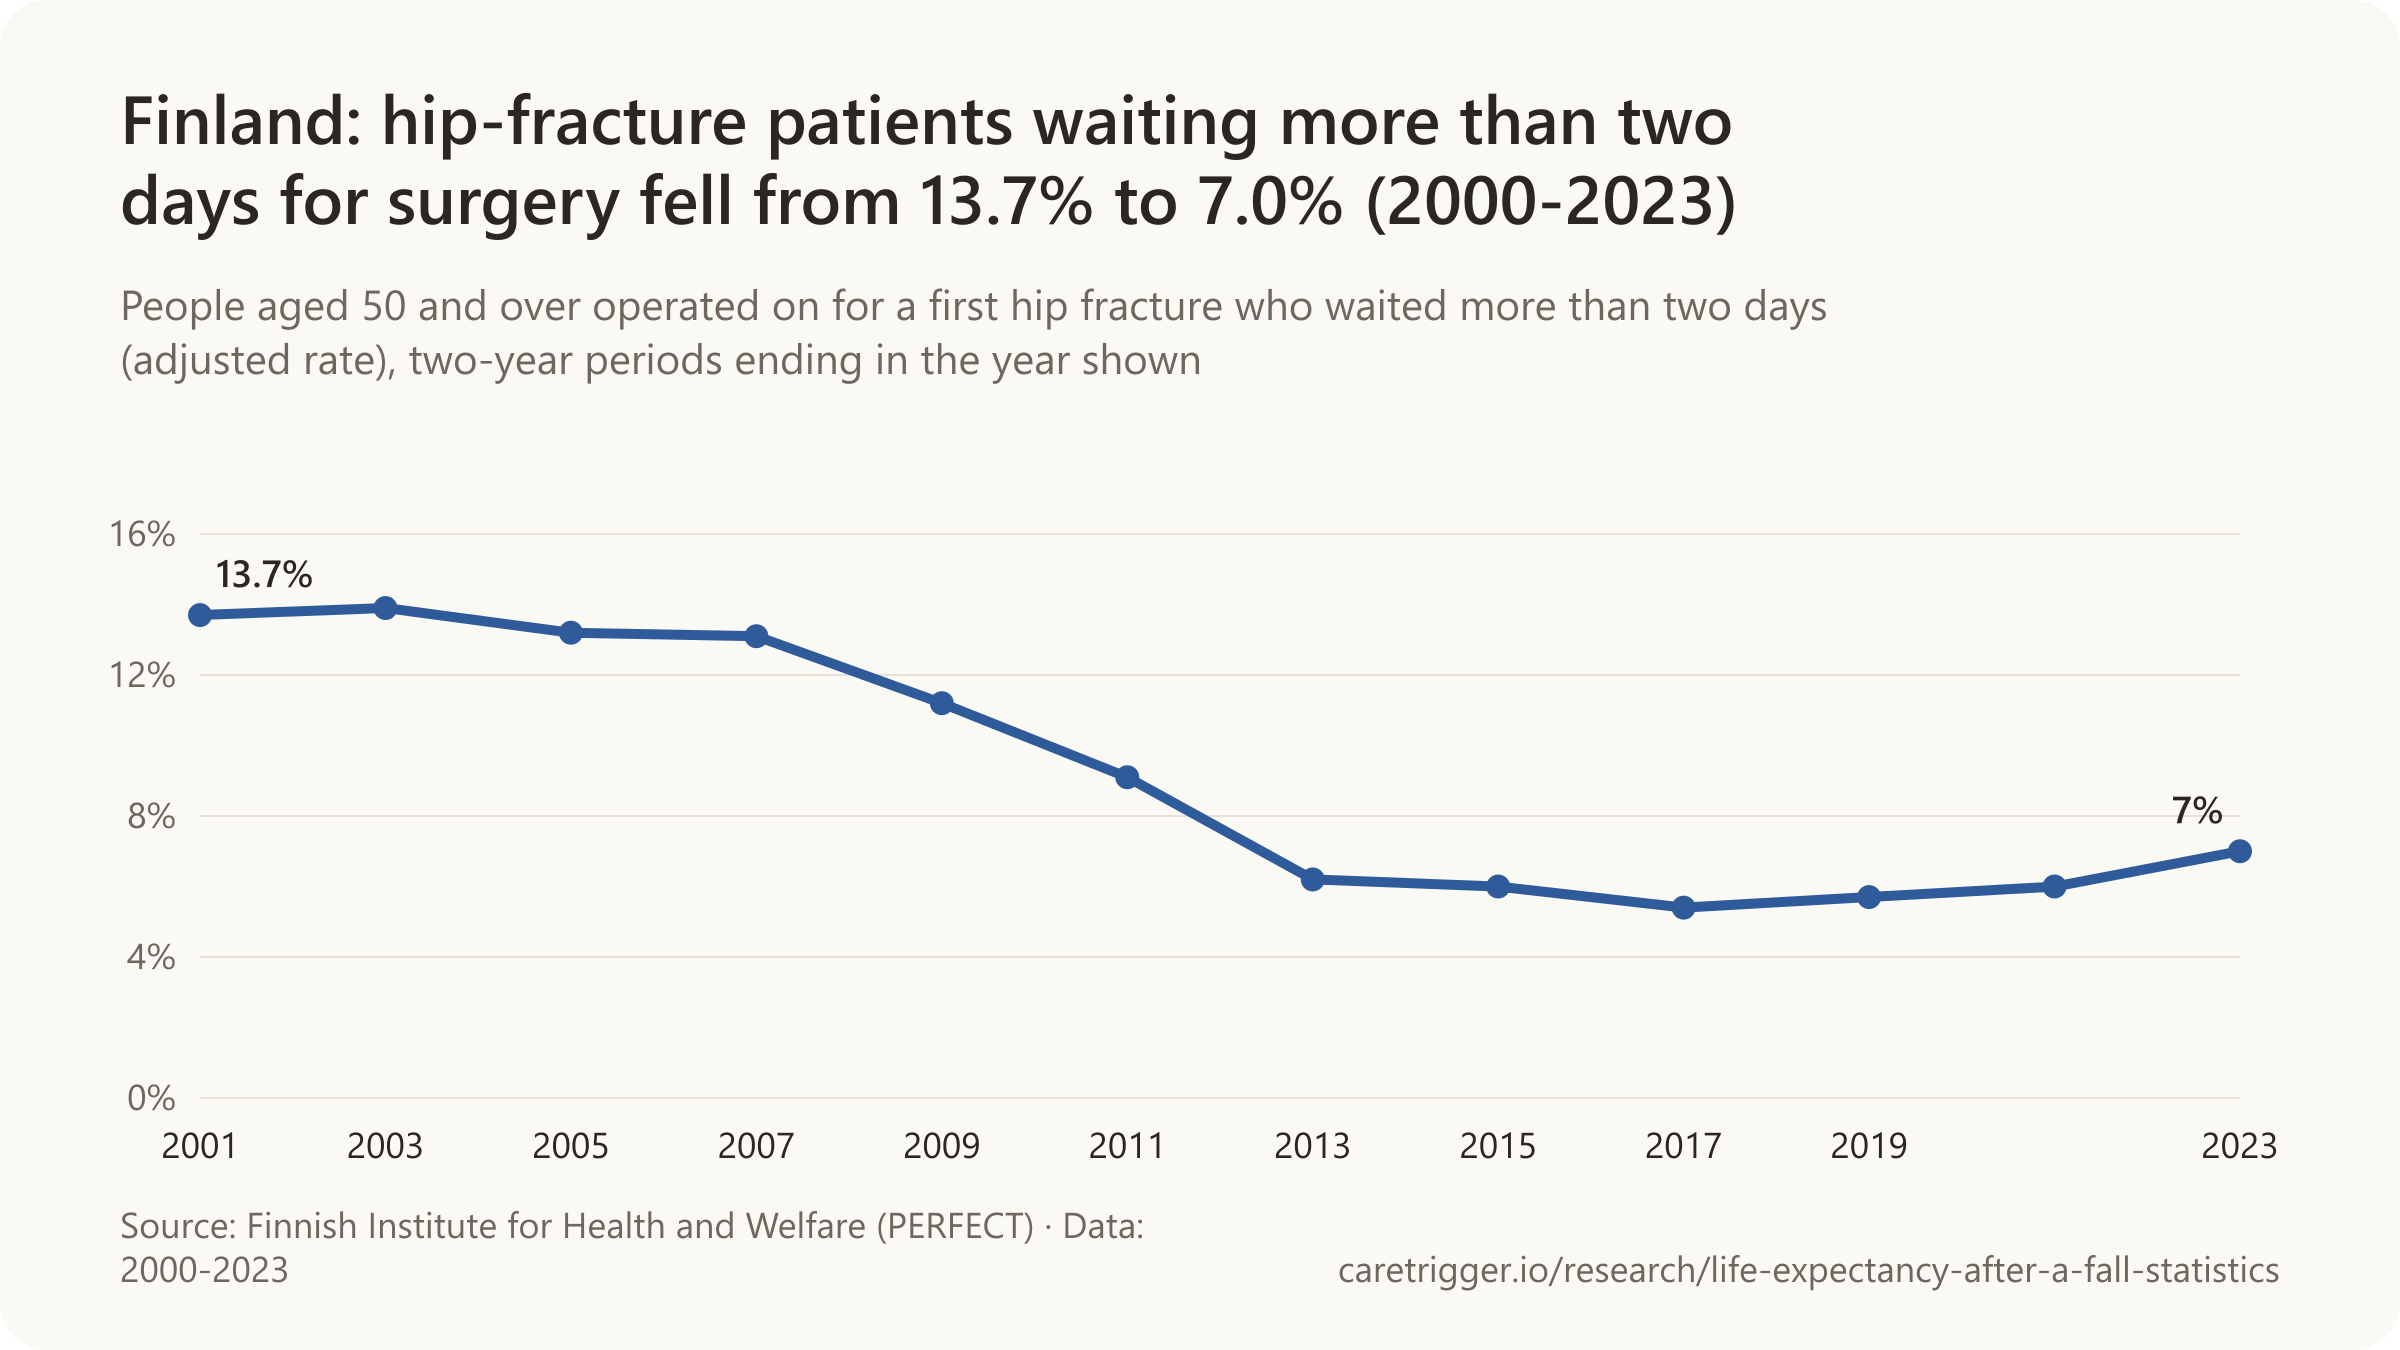
- In Finland, 21.0% of people aged 50+ operated for a first hip fracture in 2022-2023 died within a year (adjusted rate) (Finnish Institute for Health and Welfare, 2025).
The Netherlands
- In the Netherlands, 8.0% of hip-fracture patients with severe illness before the fracture (ASA grade 3-4) died within 30 days of the fracture in 2020 (Dutch Hip Fracture Audit, 2024).
- In the Netherlands, 8.0% of hip-fracture patients with severe illness before the fracture (ASA grade 3-4) died within 30 days of the fracture in 2021 (Dutch Hip Fracture Audit, 2024).
- In the Netherlands, 6.8% of hip-fracture patients with severe illness before the fracture (ASA grade 3-4) died within 30 days of the fracture in 2022 (Dutch Hip Fracture Audit, 2024).
- In the Netherlands, 5.1% of hip-fracture patients with severe illness before the fracture (ASA grade 3-4) died within 30 days of the fracture in 2023 (Dutch Hip Fracture Audit, 2024).
- In the Netherlands, 26.2% of hip-fracture patients with severe illness before the fracture (ASA grade 3-4) died within one year of the fracture in 2020 (Dutch Hip Fracture Audit, 2024).
- In the Netherlands, 26.6% of hip-fracture patients with severe illness before the fracture (ASA grade 3-4) died within one year of the fracture in 2021 (Dutch Hip Fracture Audit, 2024).
- In the Netherlands, 24% of hip-fracture patients with severe illness before the fracture (ASA grade 3-4) died within one year of the fracture in 2022 (Dutch Hip Fracture Audit, 2024).
- In the Netherlands, 92.1% of hip-fracture patients were operated on within 48 hours and 64.9% within 24 hours in 2024 (Dutch Hip Fracture Audit, 2025).
- In the Netherlands, 90% of hip-fracture patients were operated on within 48 hours and 63% within 24 hours in 2023 (Dutch Hip Fracture Audit, 2024).
- In the Netherlands, hip-fracture patients stayed in hospital for 6.2 days on average in 2024 (Dutch Hip Fracture Audit, 2025).
- The Dutch Hip Fracture Audit recorded 19,345 hip fractures in 66 hospitals in 2024 (Dutch Hip Fracture Audit, 2025).
- In the Dutch Hip Fracture Audit, unadjusted 90-day mortality after a hip fracture was 12.5% once deaths were linked from national insurance data, against 4.2% using hospital-recorded deaths alone (Würdemann et al., European Journal of Trauma and Emergency Surgery, 2022).
Germany
- In Germany, 5.15% of adults treated with internal fixation for a hip fracture died in hospital in 2022 (IQTIG, 2025).
- In Germany, 4.89% of adults treated with internal fixation for a hip fracture died in hospital in 2023 (IQTIG, 2025).
- In Germany, 4.69% of adults treated with internal fixation for a hip fracture died in hospital in 2024 (IQTIG, 2025).
- In Germany, 5.13% of adults with a hip fracture treated by internal fixation who had severe systemic disease (ASA 3) died in hospital in 2024, against 0.74% of those with mild disease (ASA 2) (IQTIG, 2025).
- In Germany, 9.90% of adults with a hip fracture treated by internal fixation waited more than 24 hours for surgery (48 hours if on a direct oral anticoagulant) in 2022 (IQTIG, 2025).
- In Germany, 8.80% of adults with a hip fracture treated by internal fixation waited more than 24 hours for surgery (48 hours if on a direct oral anticoagulant) in 2023 (IQTIG, 2025).
- In Germany, 7.57% of adults with a hip fracture treated by internal fixation waited more than 24 hours for surgery (48 hours if on a direct oral anticoagulant) in 2024 (IQTIG, 2025).
- In Germany, 7.5% of AOK-insured patients operated for a hip fracture in 2012-2014 died within 30 days of admission (WIdO, 2018).
- In Germany, 14.2% of AOK-insured patients operated for a hip fracture in 2012-2014 died within 90 days of admission (WIdO, 2018).
- In Germany, 26.6% of AOK-insured patients operated for a hip fracture in 2012-2014 died within one year of admission (WIdO, 2018).
- In Germany, 27.6% of hip-fracture patients aged 65+ died within 12 months and 20.9% within six months, in a national insurance-claims cohort of 123,119 patients from 2009-2012 (Schulz et al., Versorgungsatlas, 2021).
- In the German geriatric trauma registry, 15.44% of hip-fracture patients aged 100 or older died in hospital, compared with 3.58% of patients under 80 (ATR-DGU; Journal of Clinical Medicine, 2024).
Spain

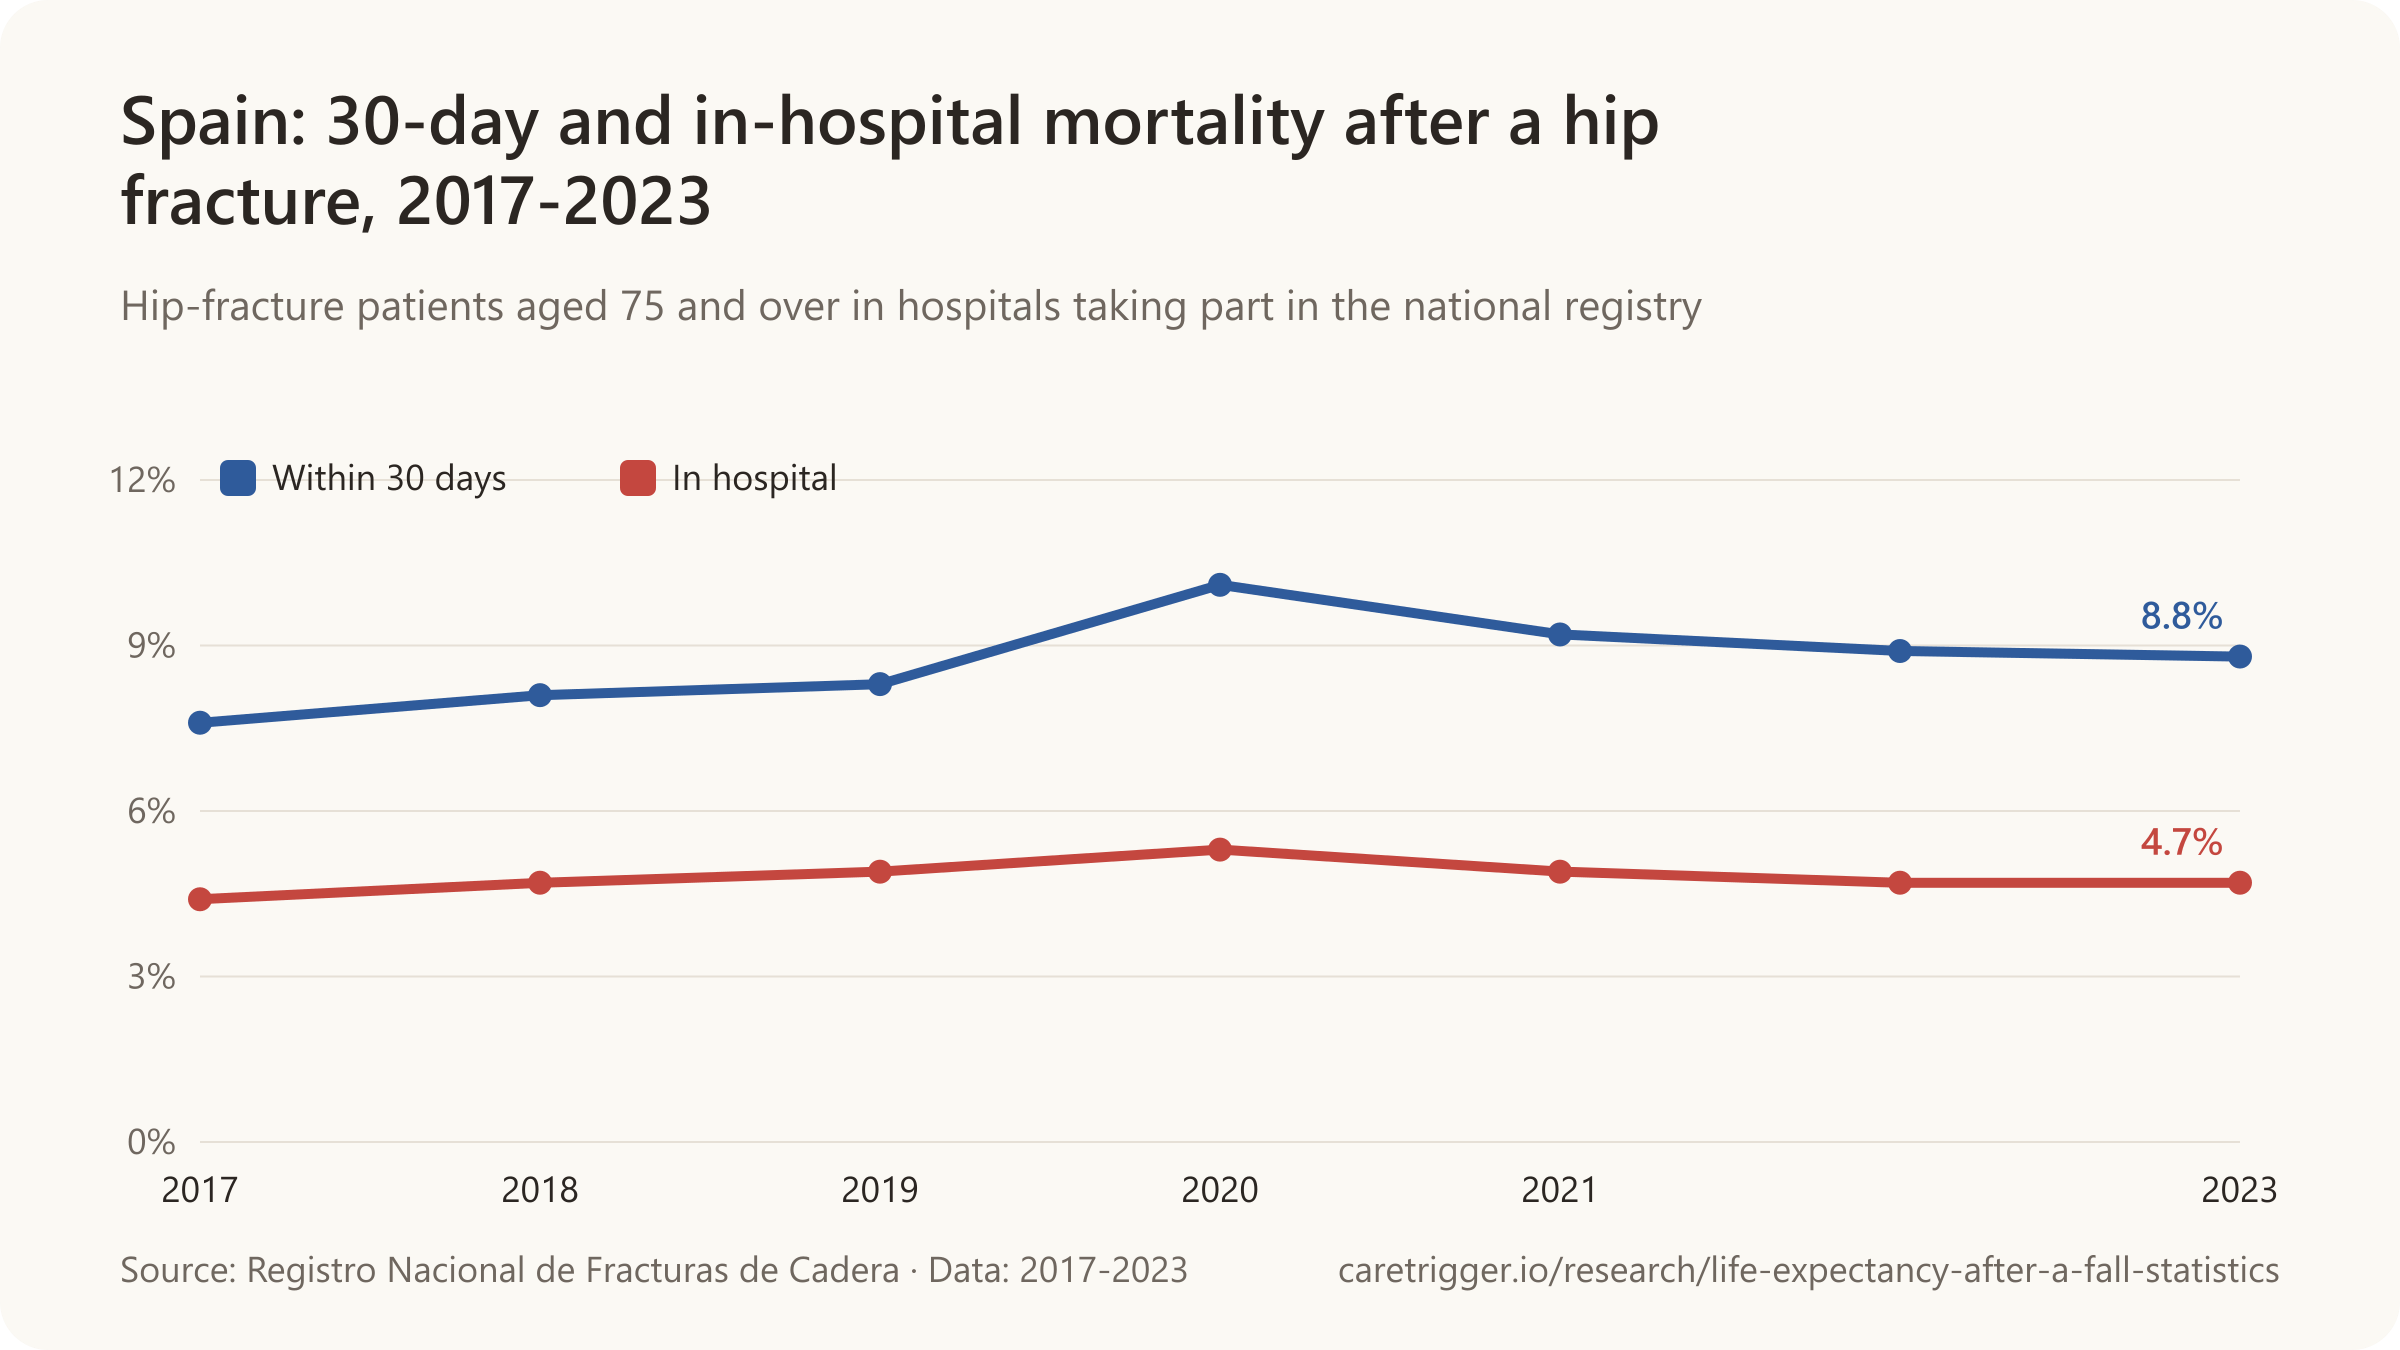
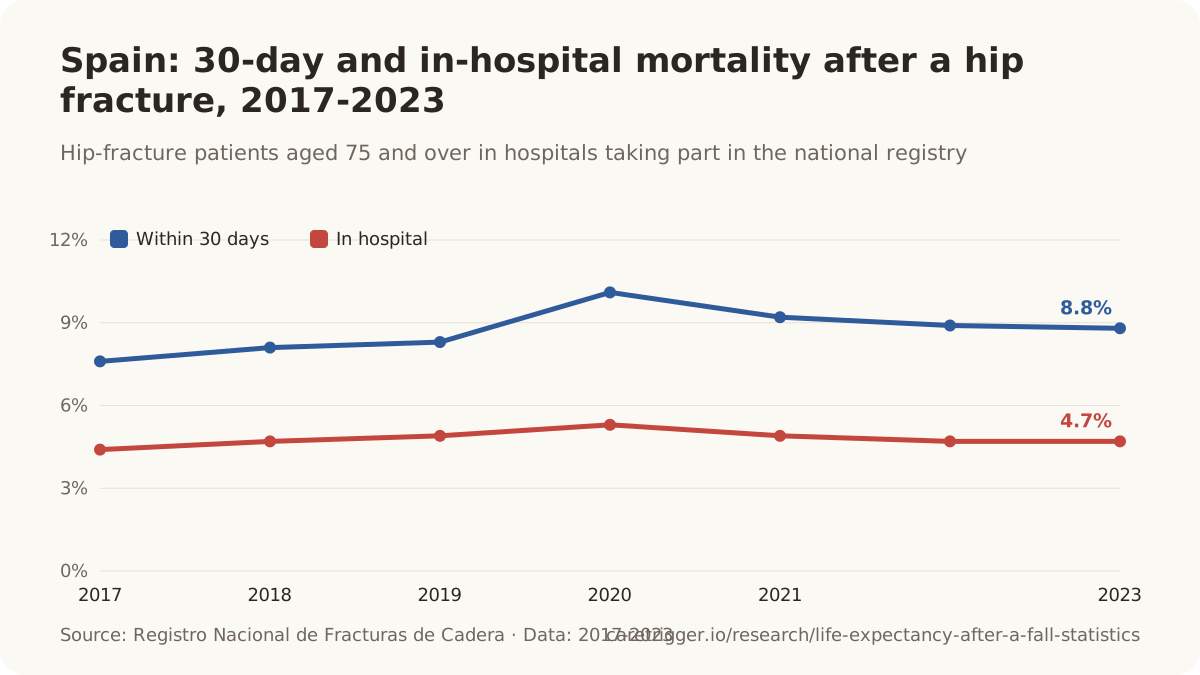
- One-year mortality after a hip fracture rose by 2% per year between 1999 and 2015 in a Madrid hospital (IRR 1.020), against the falling trend reported elsewhere (Guzon-Illescas et al., Journal of Orthopaedic Surgery and Research, 2019).
- In Spanish hospitals taking part in the national hip-fracture registry, 8.8% of hip-fracture patients aged 75+ died within 30 days in 2023 (Registro Nacional de Fracturas de Cadera, 2025).
- In Spanish hospitals taking part in the national hip-fracture registry, 47% of hip-fracture patients aged 75+ were operated on within 48 hours in 2023, up from 41% in 2017 (Registro Nacional de Fracturas de Cadera, 2025).
- In Spanish hospitals taking part in the national hip-fracture registry, patients aged 75+ waited an average of 64.9 hours from first hospital contact to hip-fracture surgery in 2023 (Registro Nacional de Fracturas de Cadera, 2025).
- The Spanish National Hip Fracture Registry recorded 9,906 patients from 53 hospitals in 2023 (Registro Nacional de Fracturas de Cadera, 2025).
Greece
- In the first Greek national hip-fracture registry, 10.9% of patients died within 30 days of a fragility hip fracture and 4% died in hospital (Iliopoulos et al., Cureus, 2026).
- In the first Greek national hip-fracture registry, 4% of patients with a fragility hip fracture died in hospital (Iliopoulos et al., Cureus, 2026).
- In the first Greek national hip-fracture registry, only 31% of patients were operated on within 48 hours of admission (Iliopoulos et al., Cureus, 2026).
Australia and New Zealand

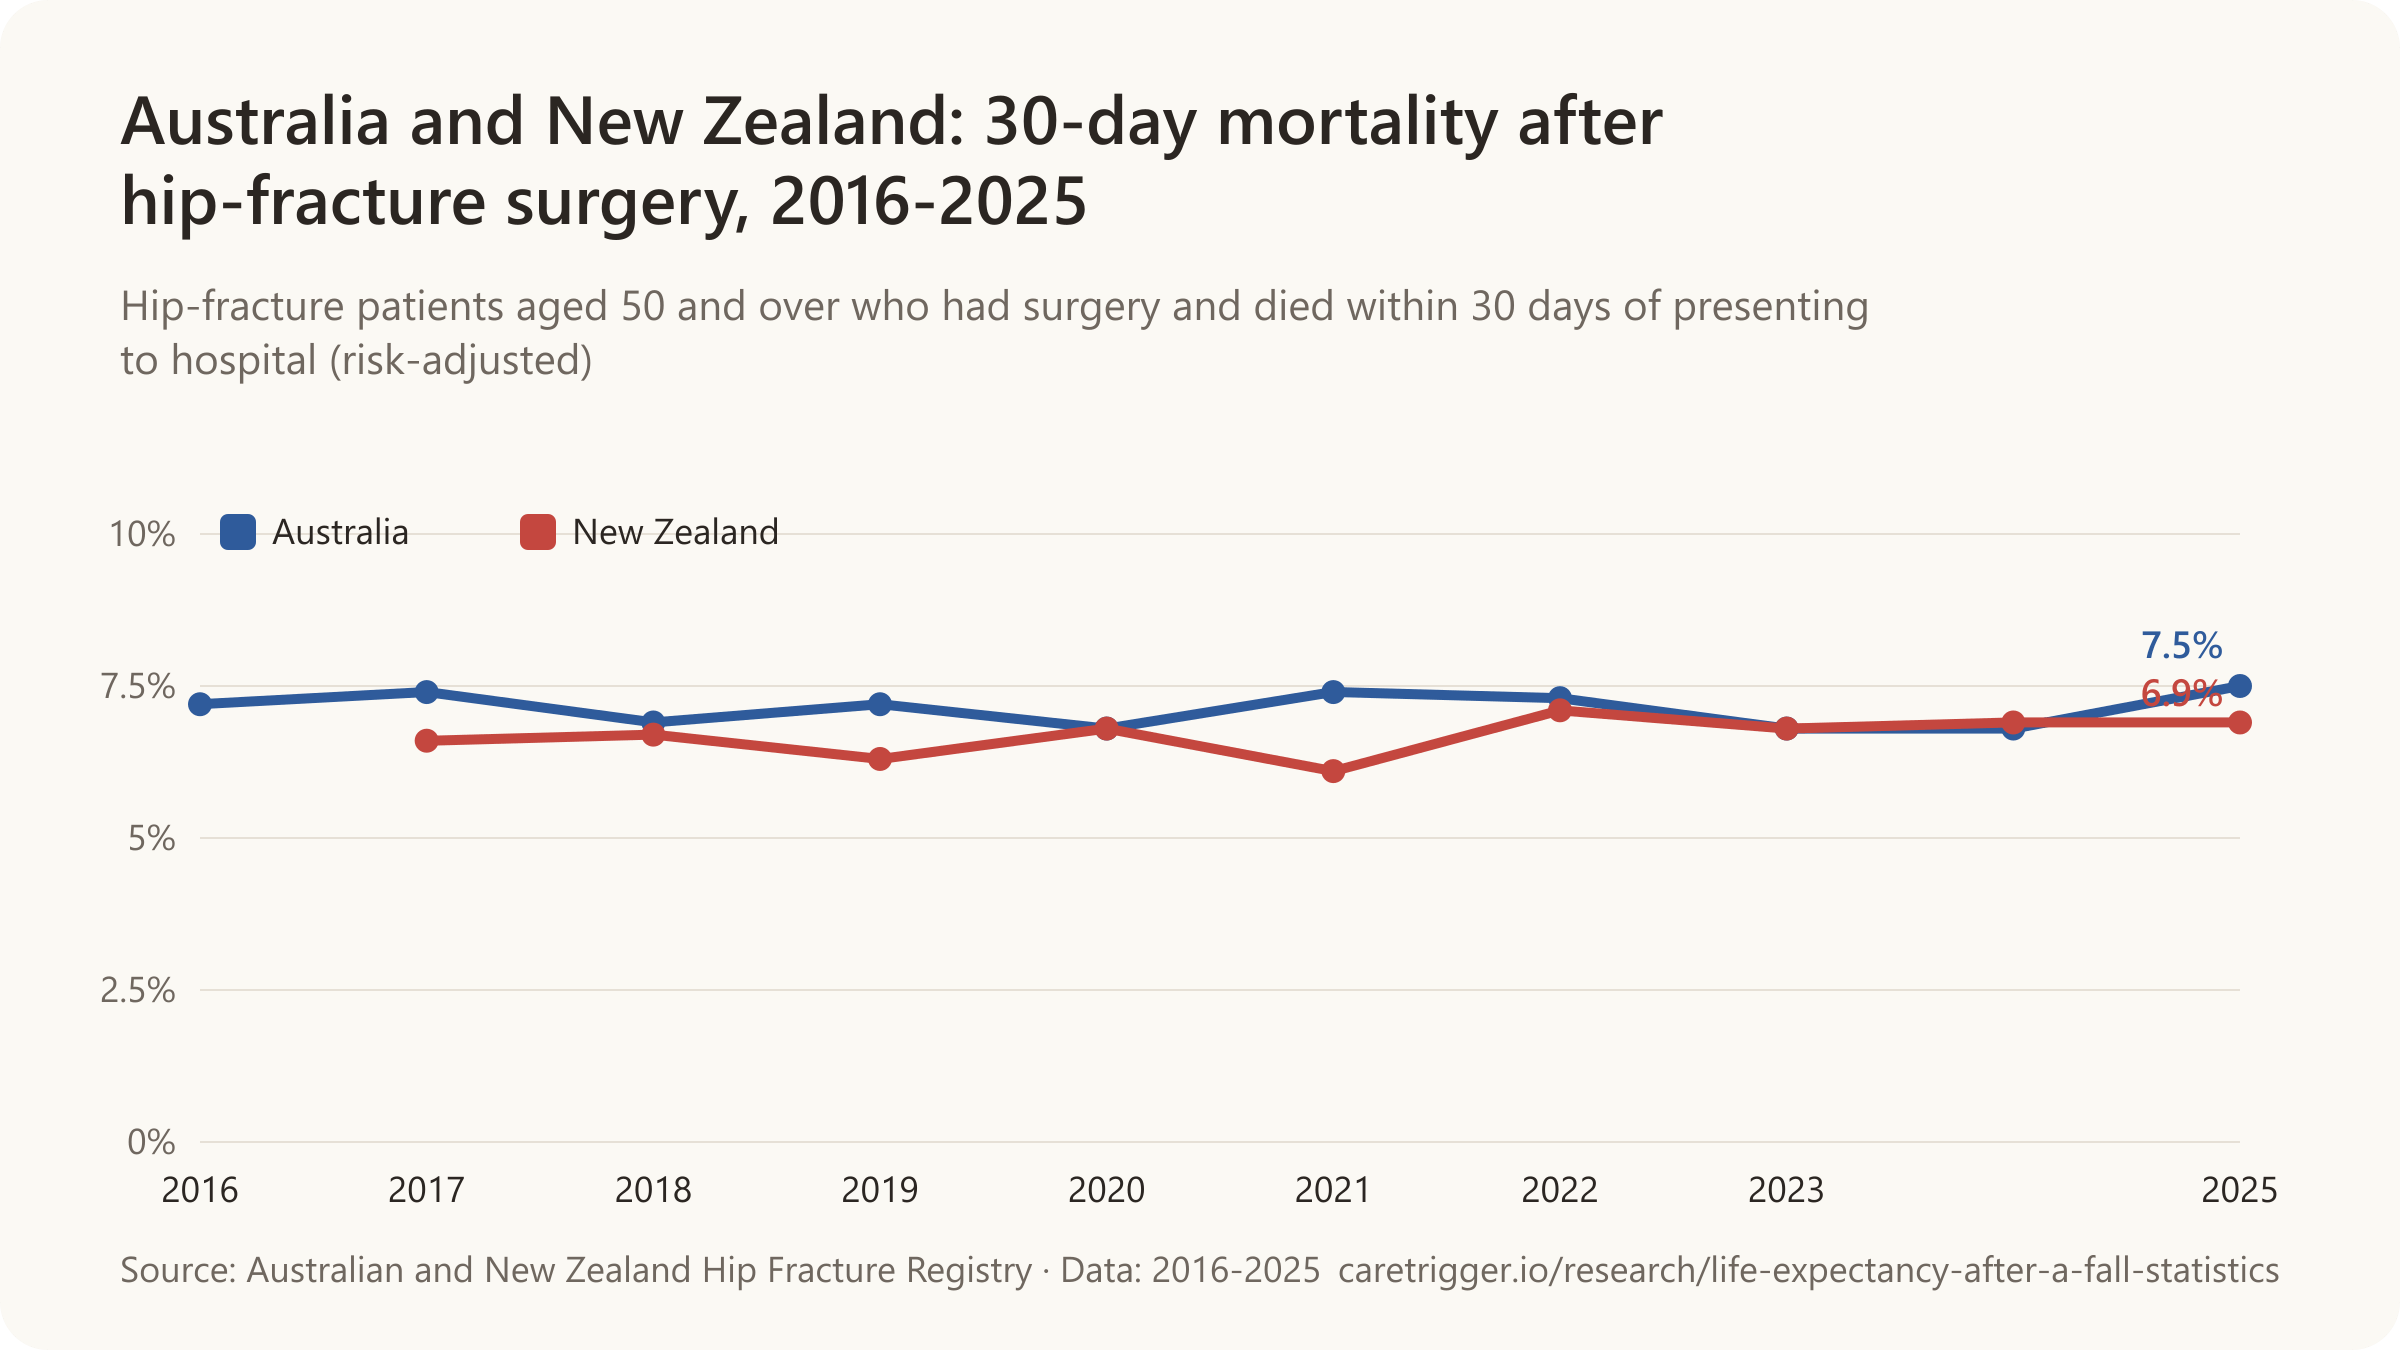
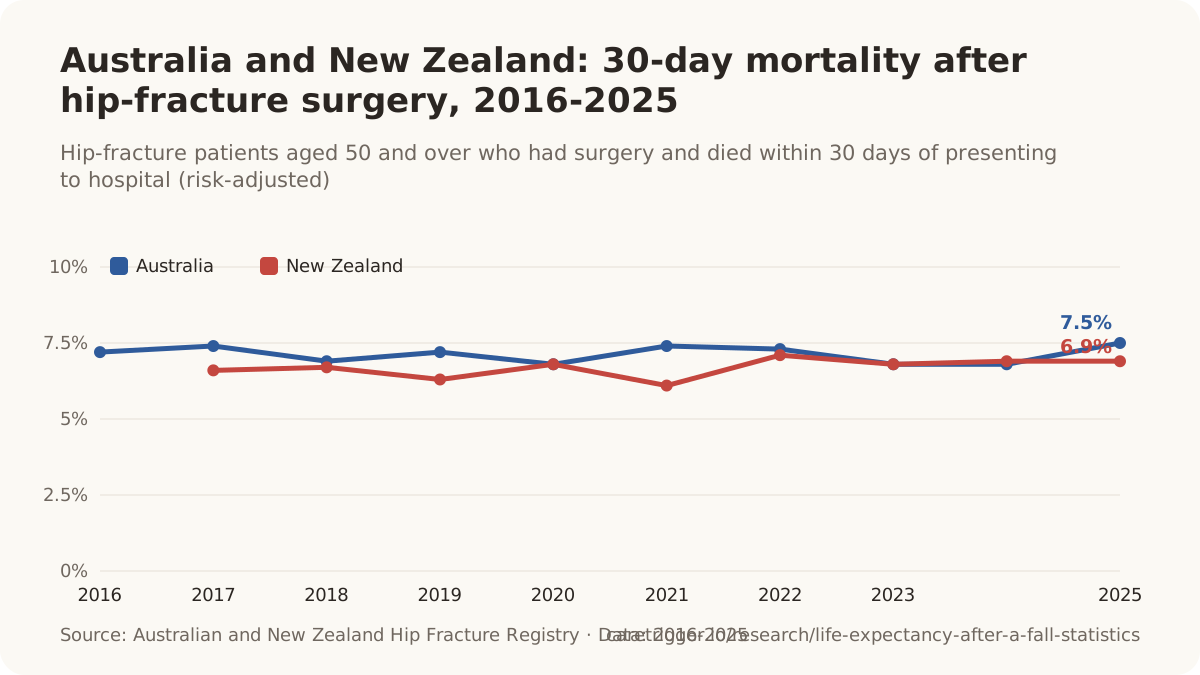

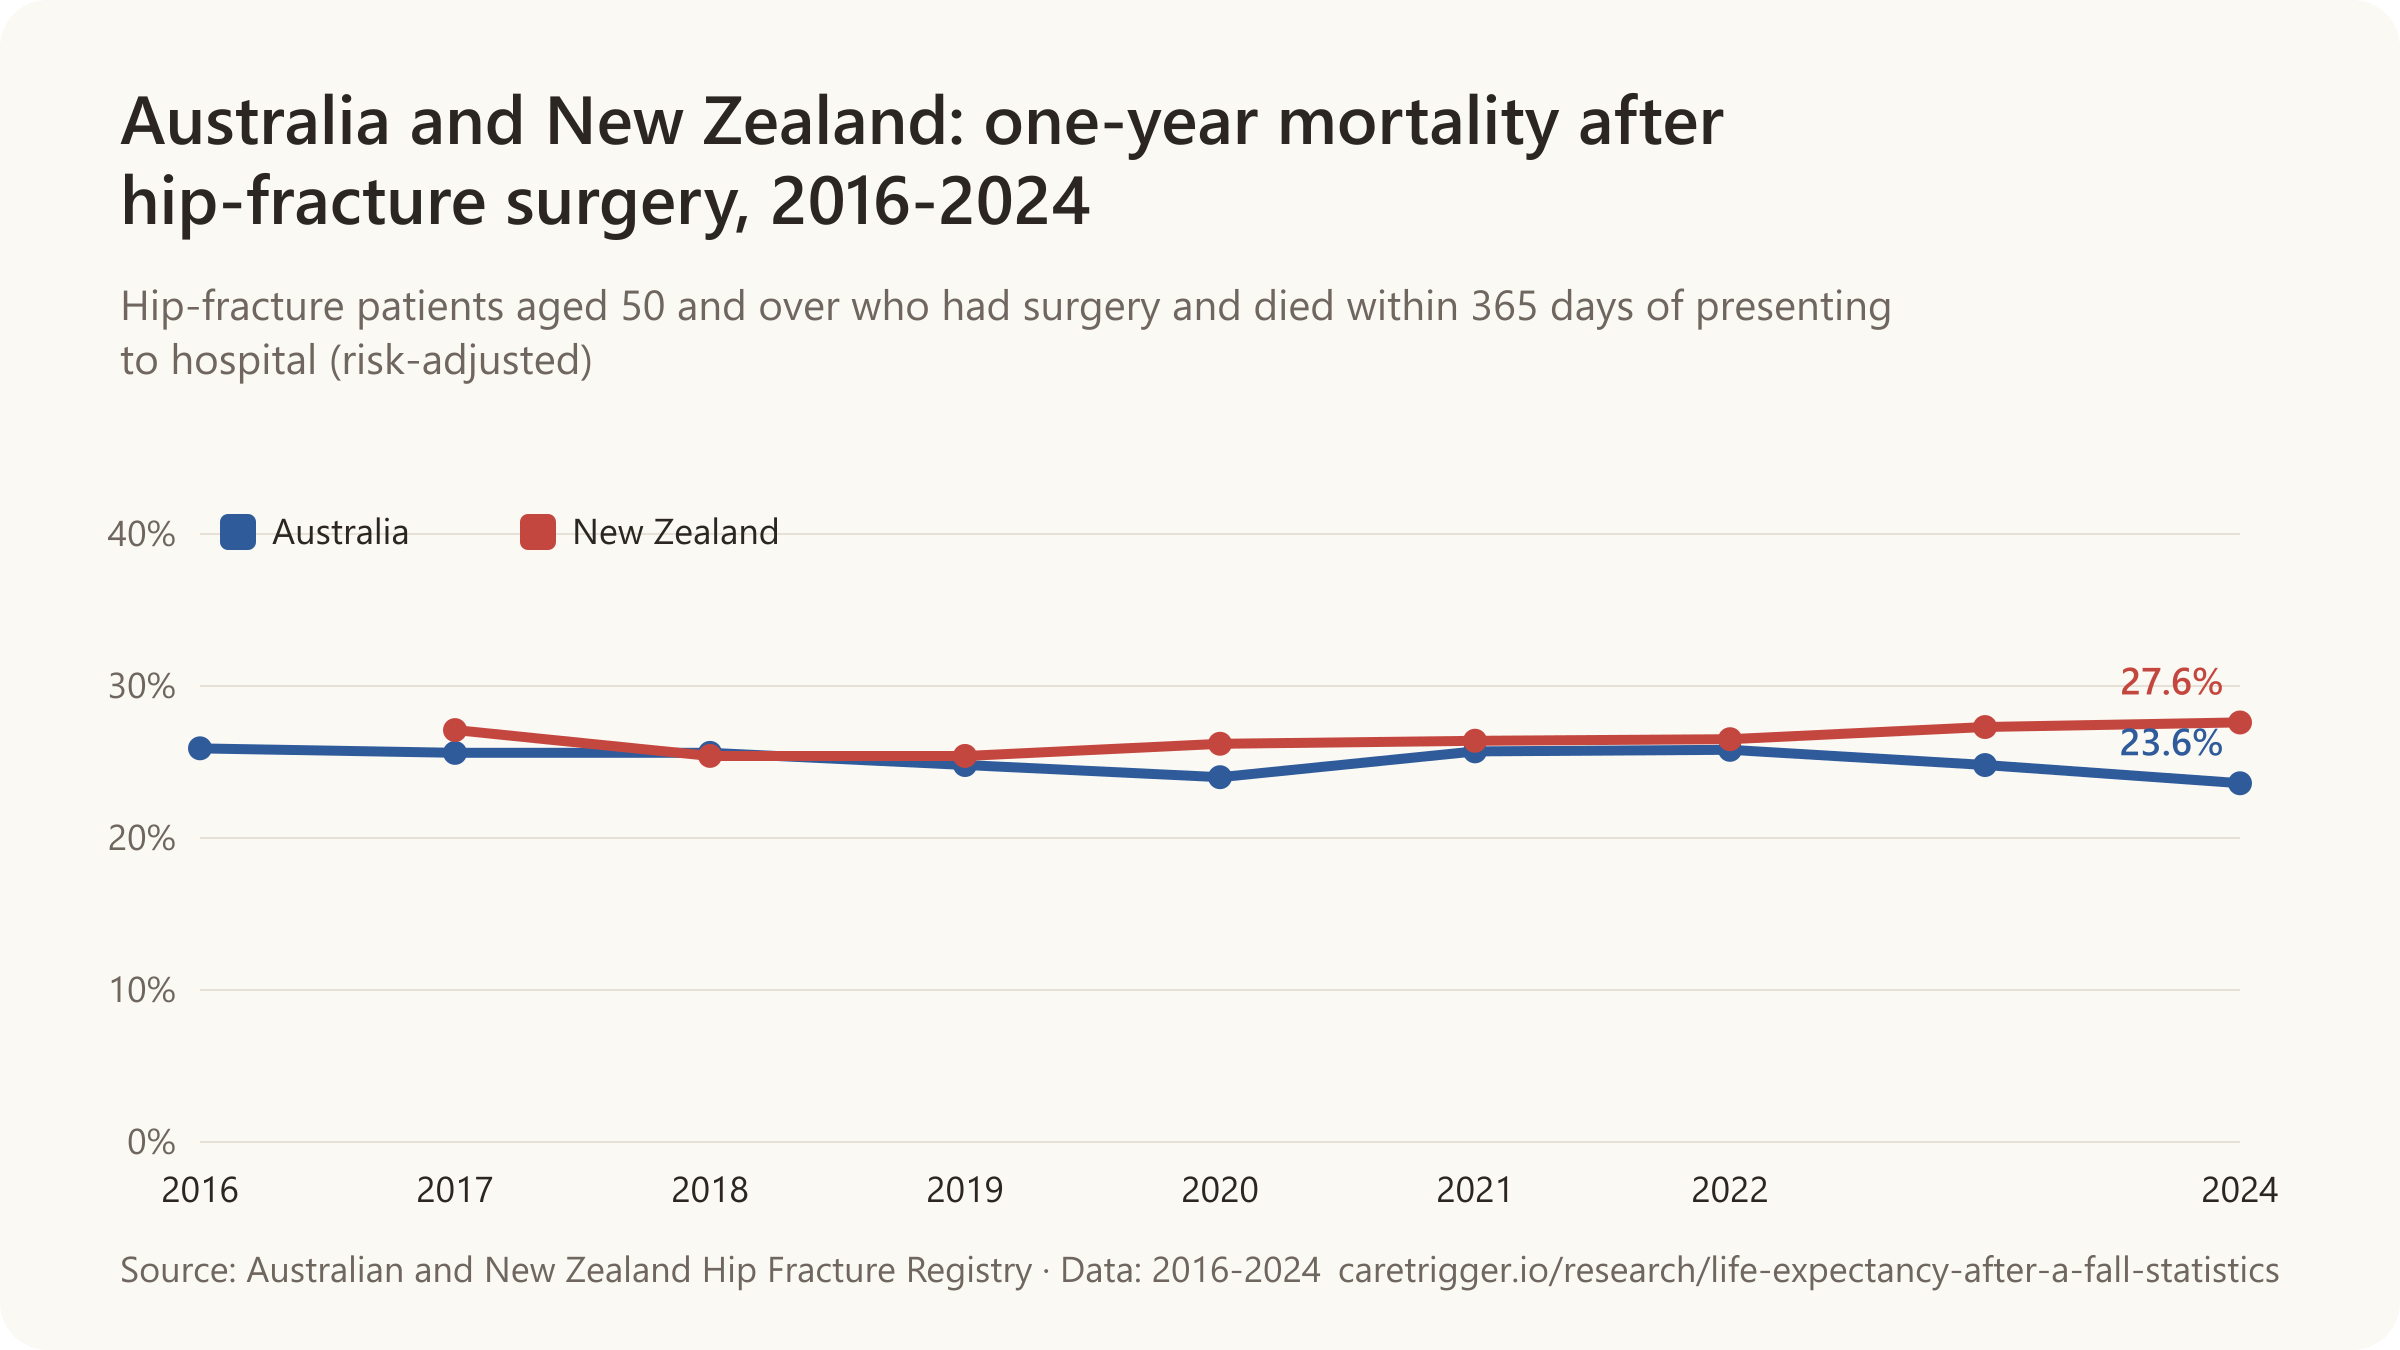

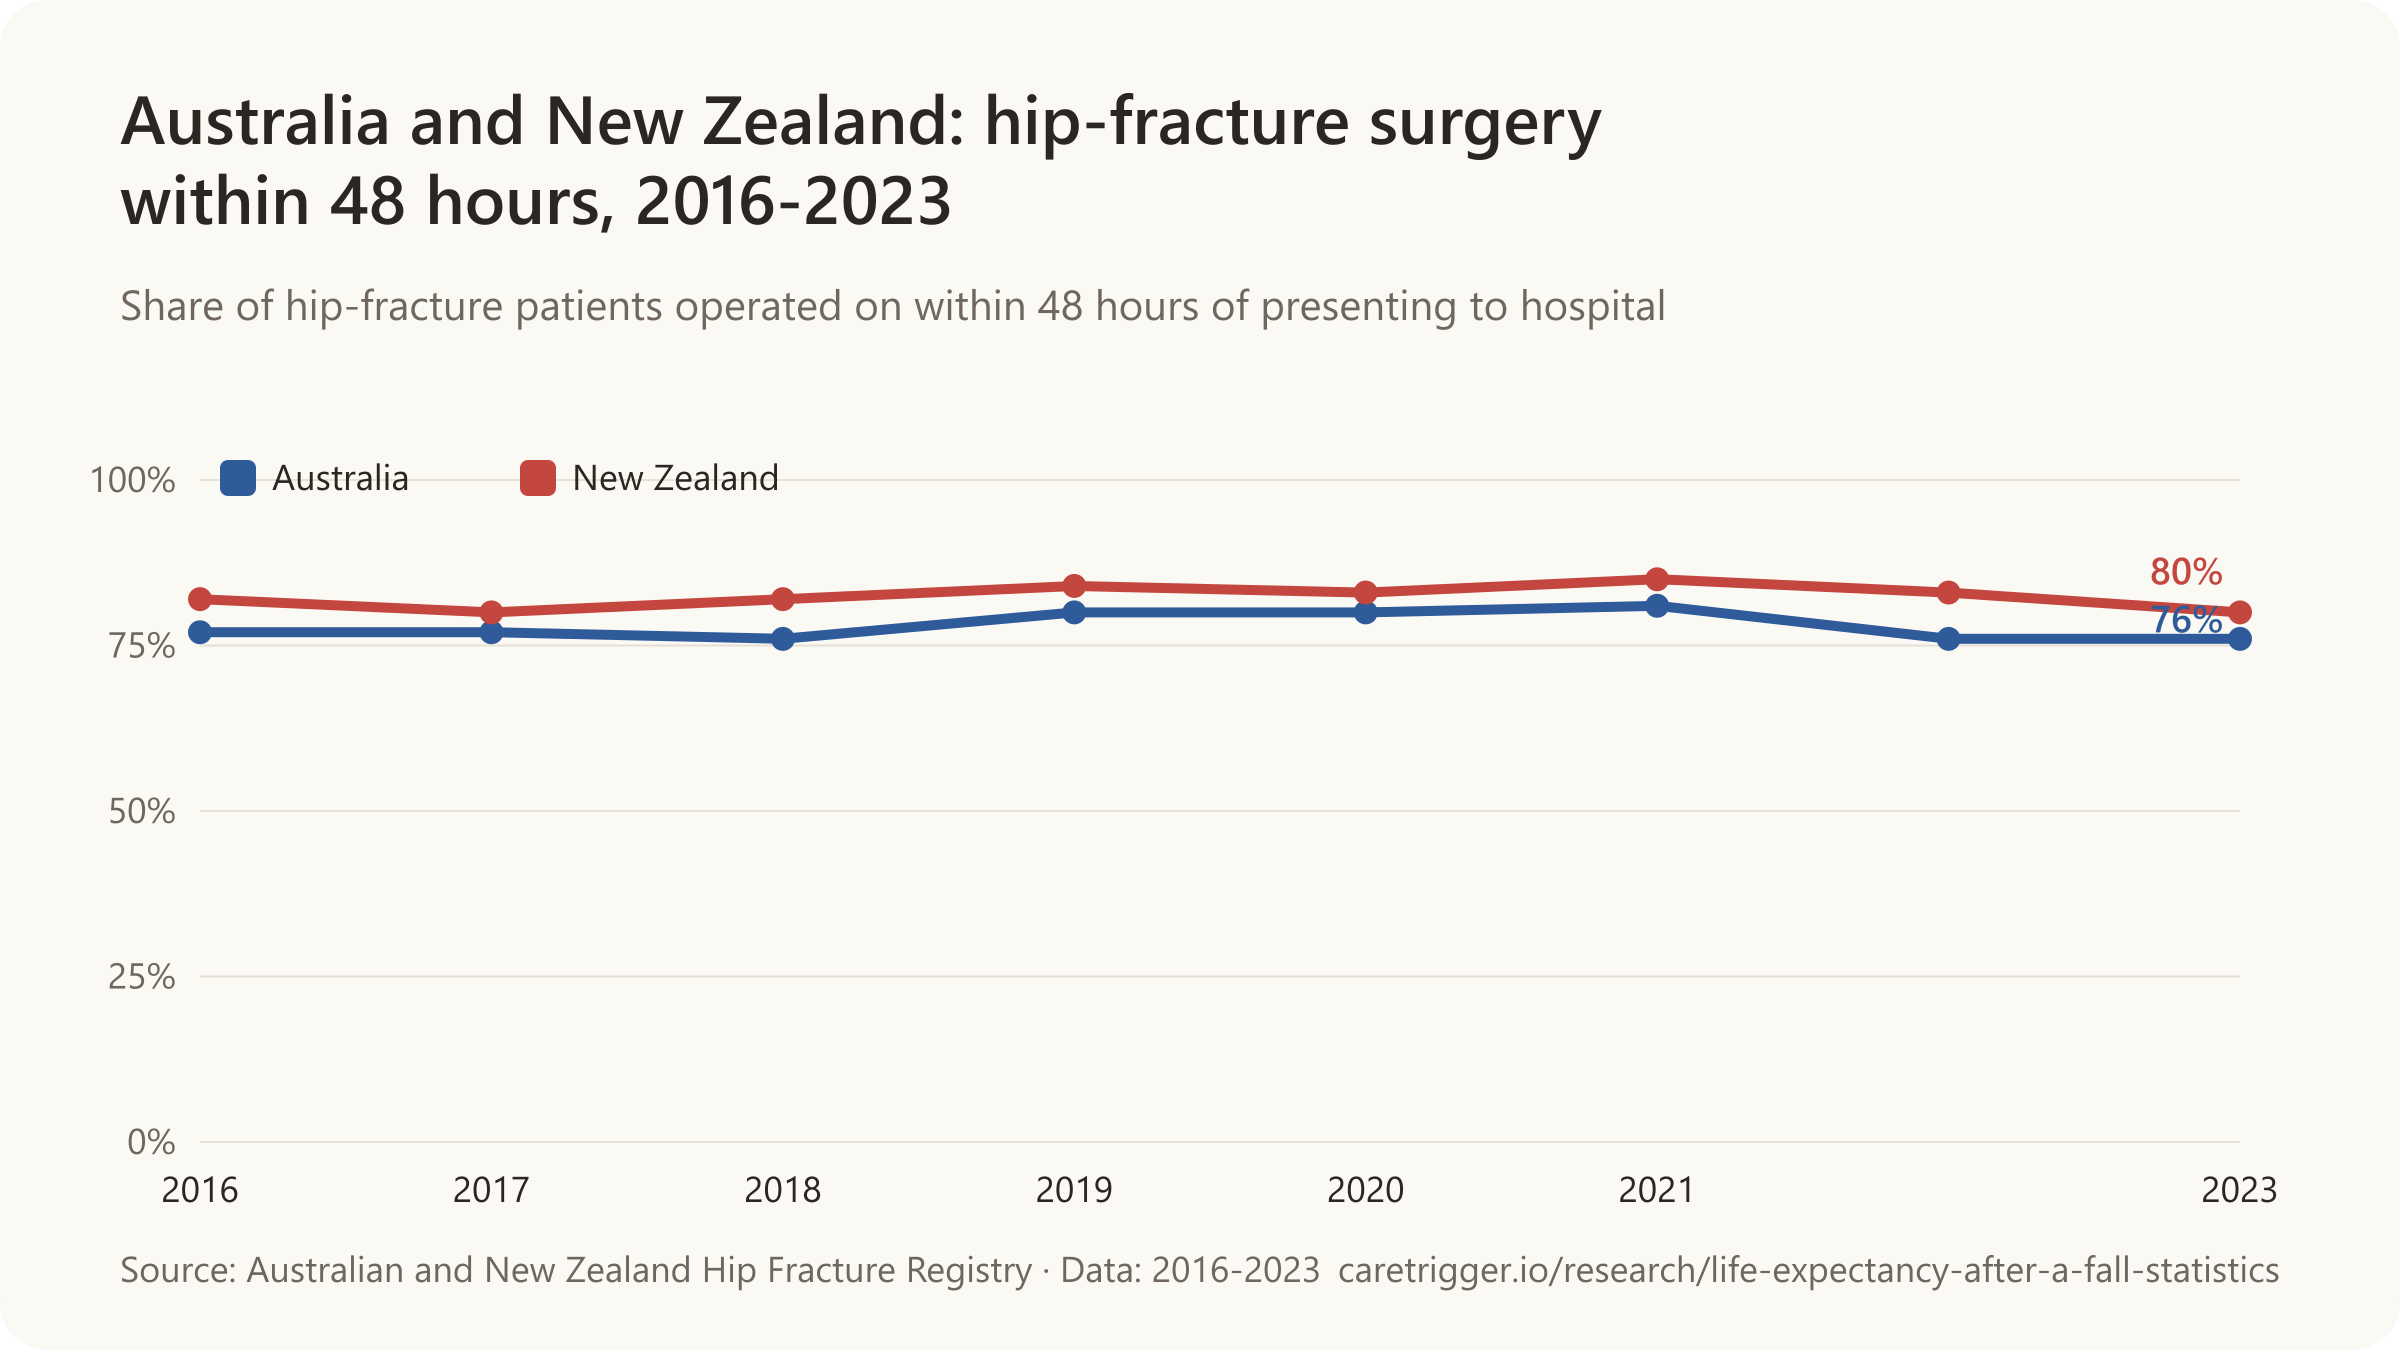
- In Australia, 7.5% of hip-fracture patients aged 50+ who had surgery in 2025 died within 30 days of presenting to hospital (risk-adjusted; Australian and New Zealand Hip Fracture Registry, 2026).
- In New Zealand, 6.9% of hip-fracture patients aged 50+ who had surgery in 2025 died within 30 days of presenting to hospital (risk-adjusted; Australian and New Zealand Hip Fracture Registry, 2026).
- Over 2023-2025, 6.5% of hip-fracture patients aged 50+ who had surgery in New Zealand died within 30 days of presenting to hospital (national rate across participating hospitals; Australian and New Zealand Hip Fracture Registry, 2026).
- Over 2023-2025, 6.9% of hip-fracture patients aged 50+ who had surgery in Australia died within 30 days of presenting to hospital (national rate across participating hospitals; Australian and New Zealand Hip Fracture Registry, 2026).
- Over 2022-2024, 26.8% of hip-fracture patients aged 50+ who had surgery in New Zealand died within 365 days of presenting to hospital (national rate across participating hospitals; Australian and New Zealand Hip Fracture Registry, 2026).
- Over 2022-2024, 24.9% of hip-fracture patients aged 50+ who had surgery in Australia died within 365 days of presenting to hospital (national rate across participating hospitals; Australian and New Zealand Hip Fracture Registry, 2026).
- In New Zealand, 62% of hip-fracture patients who had surgery in 2024 were operated on within 36 hours of presenting to the first hospital (Australian and New Zealand Hip Fracture Registry, 2025).
- In Australia, 57% of hip-fracture patients who had surgery in 2024 were operated on within 36 hours of presenting to the first hospital (Australian and New Zealand Hip Fracture Registry, 2025).
- In New Zealand, 65% of hip-fracture patients who had surgery in 2025 were operated on within 36 hours of presenting to the first hospital (Australian and New Zealand Hip Fracture Registry, 2026).
- In Australia, 56% of hip-fracture patients who had surgery in 2025 were operated on within 36 hours of presenting to the first hospital (Australian and New Zealand Hip Fracture Registry, 2026).
- In 2025, the average time from presentation to hip-fracture surgery was 36 hours in Australia (median 29) and 34 hours in New Zealand (median 25), for patients not transferred between hospitals (Australian and New Zealand Hip Fracture Registry, 2026).
- The median stay on the acute ward after a hip fracture was 10 days in Australia in 2025 (Australian and New Zealand Hip Fracture Registry, 2026).
- The median stay on the acute ward after a hip fracture was 7 days in New Zealand in 2025 (Australian and New Zealand Hip Fracture Registry, 2026).
- The Australian and New Zealand Hip Fracture Registry recorded 19,560 hip fractures in 2025: 15,740 from 84 Australian hospitals and 3,820 from 21 New Zealand hospitals (Australian and New Zealand Hip Fracture Registry, 2026).
- Among hip-fracture patients followed up in 2018, 90% in New Zealand and 87% in Australia were alive 120 days after surgery (Australian and New Zealand Hip Fracture Registry, 2019).
Canada

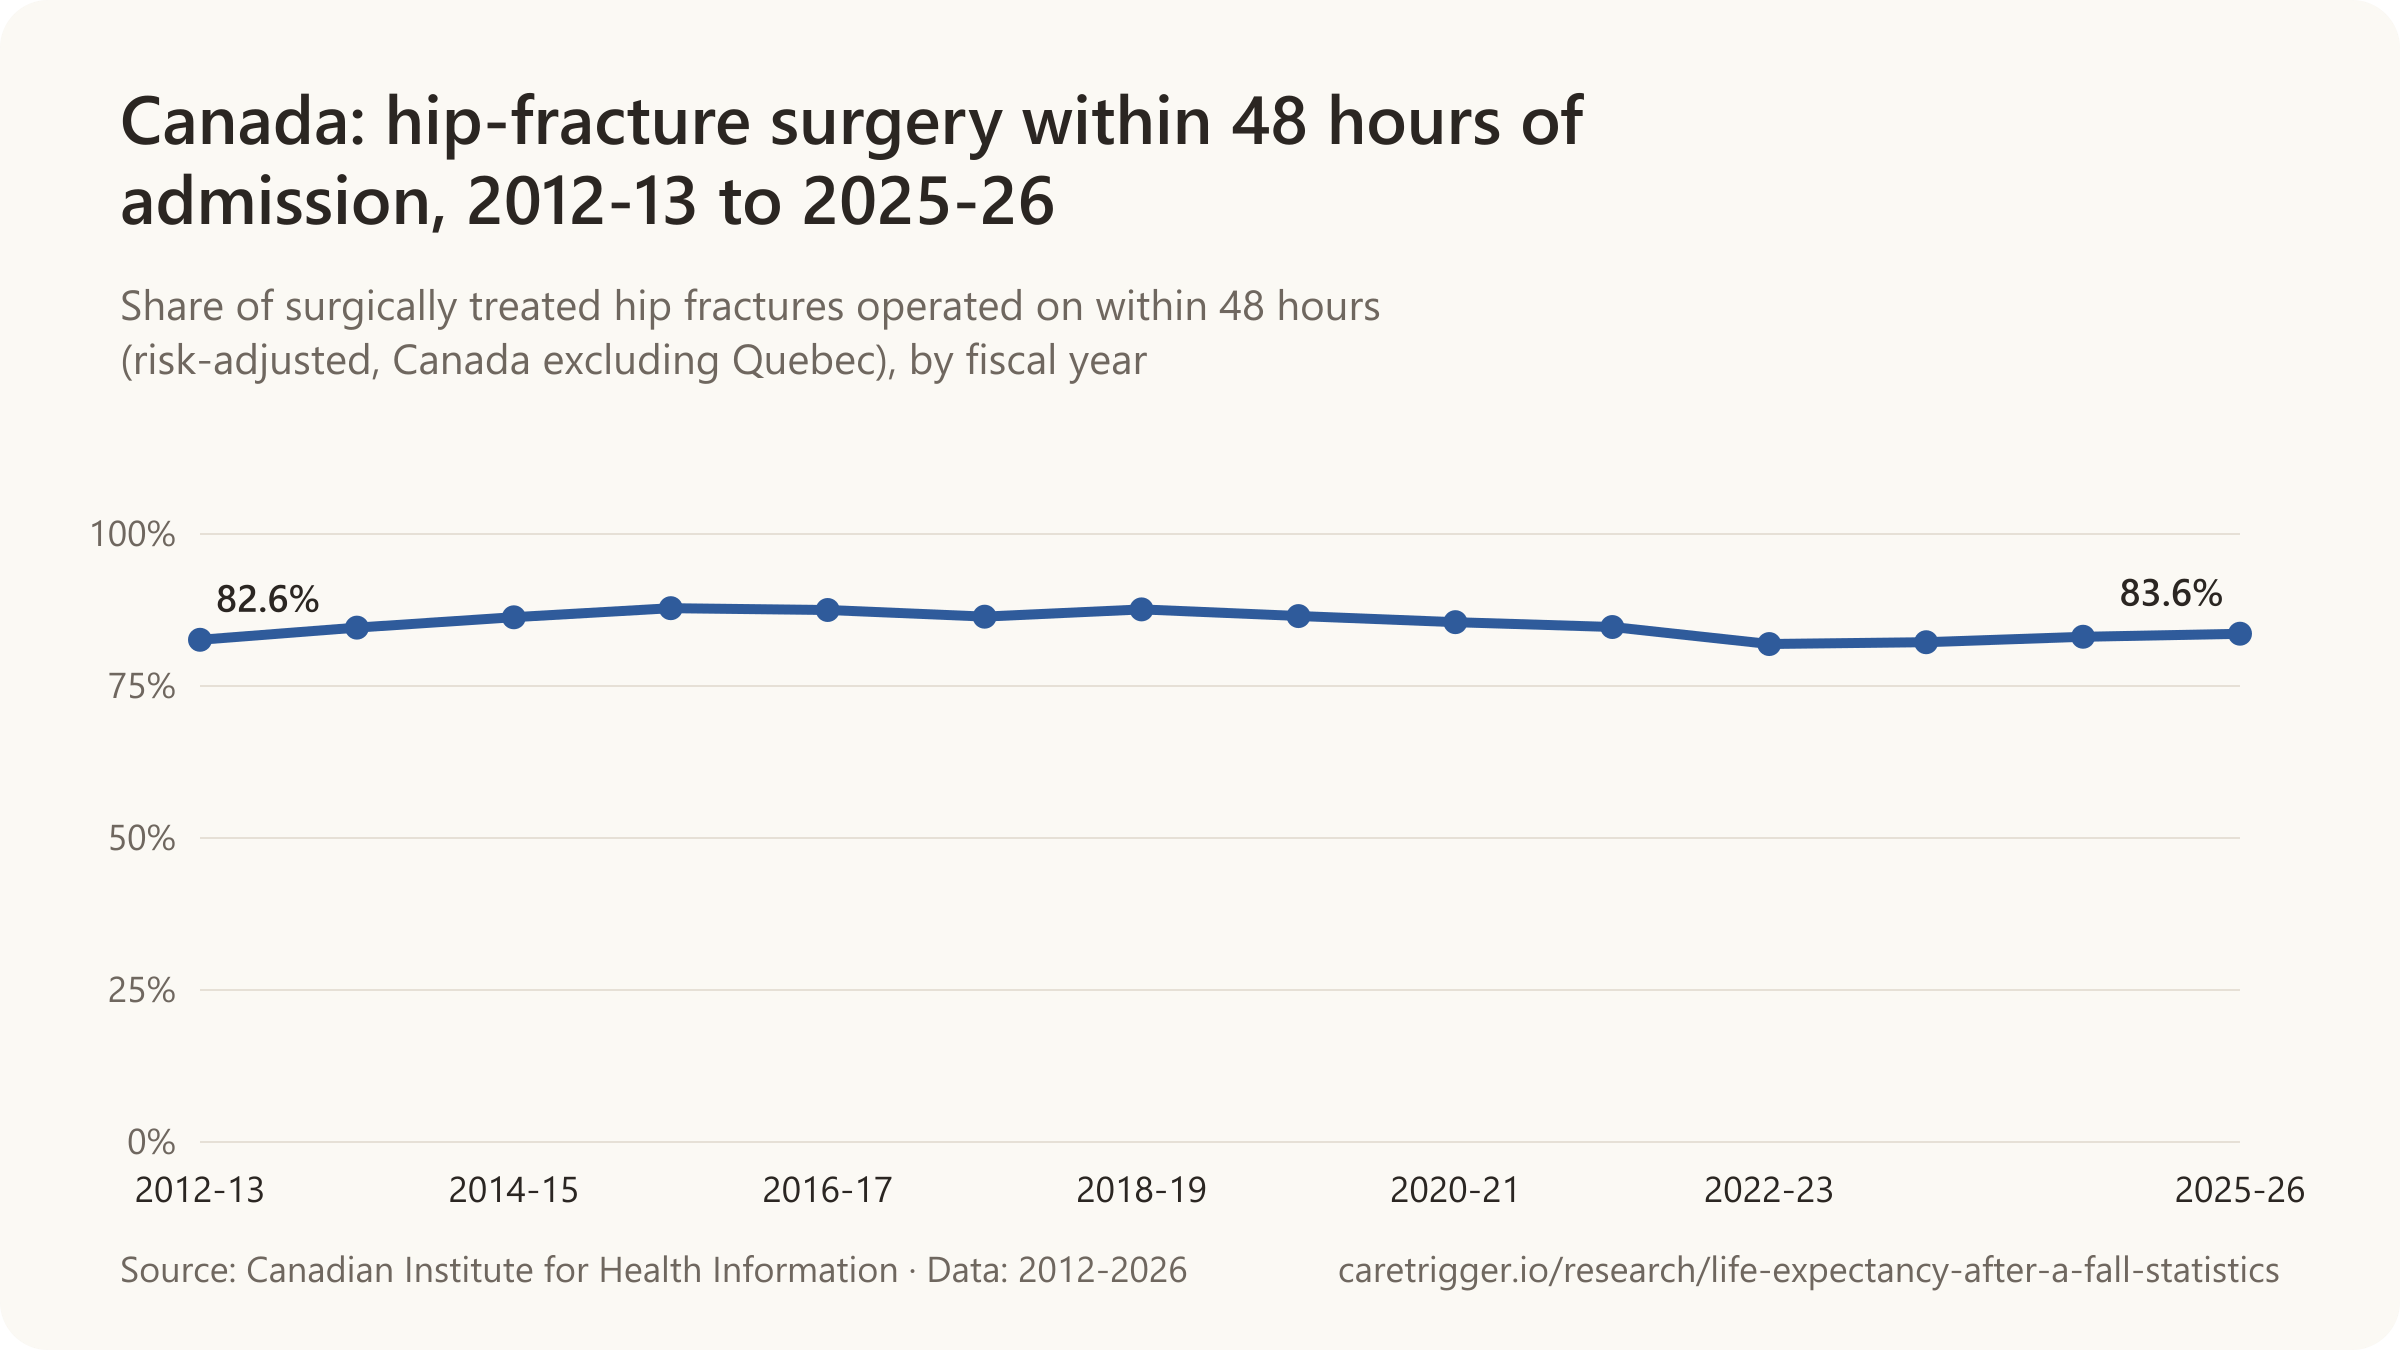
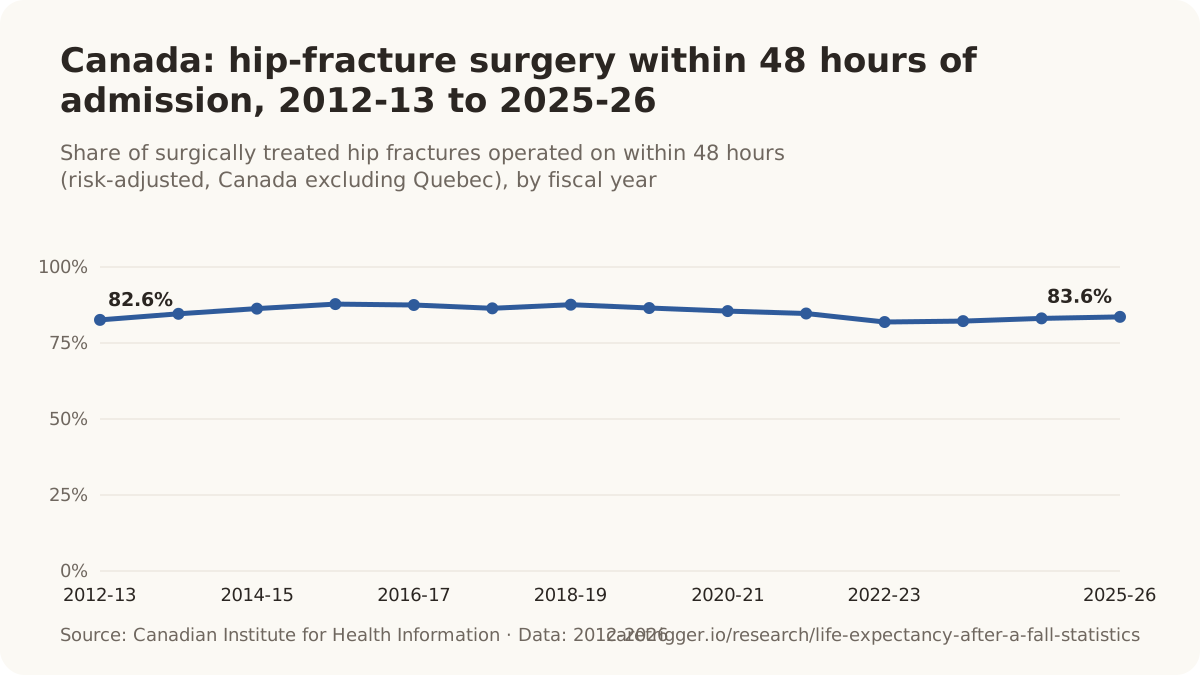
- In British Columbia, 75.7% of hip fractures treated surgically in fiscal year 2025-2026 were operated on within 48 hours of hospital admission (risk-adjusted; Canadian Institute for Health Information, 2026).
- In Saskatchewan, 77.7% of hip fractures treated surgically in fiscal year 2025-2026 were operated on within 48 hours of hospital admission (risk-adjusted; Canadian Institute for Health Information, 2026).
- In Alberta, 87.3% of hip fractures treated surgically in fiscal year 2025-2026 were operated on within 48 hours of hospital admission (risk-adjusted; Canadian Institute for Health Information, 2026).
- In Ontario, 86.3% of hip fractures treated surgically in fiscal year 2025-2026 were operated on within 48 hours of hospital admission (risk-adjusted; Canadian Institute for Health Information, 2026).
- Canadian hospitals outside Quebec treated 29,134 hip fractures surgically in fiscal year 2025-2026 (Canadian Institute for Health Information, 2026).
- In 2024, 83% of patients in Canada had hip fracture repair within 48 hours, 3 percentage points fewer than in 2019 (Canadian Institute for Health Information, 2025).
- In Canada, 22.8% of people aged 40+ with a hip fracture in 2014-2015, about 6,600 people, died of any cause within 12 months (Public Health Agency of Canada, 2024).
- In Canada, 28.6% of people aged 80+ who broke a hip died of any cause within 12 months, the highest rate of any age group (Public Health Agency of Canada, 2024).
- In Canada, the age-standardised rate of death within 12 months of a hip fracture was 244.8 per 1,000 people aged 40+ in 2000-2001 (Public Health Agency of Canada, 2024).
- In Canada, the age-standardised rate of death within 12 months of a hip fracture was 227.5 per 1,000 people aged 40+ in 2014-2015 (Public Health Agency of Canada, 2024).
United States
- Risk-adjusted 360-day mortality after a hip fracture among US Medicare women aged 65+ was 21.9% in 2004 (Brauer et al., JAMA, 2009).
- Risk-adjusted 30-day mortality after a hip fracture among US Medicare women aged 65+ was 5.9% in 1986 (Brauer et al., JAMA, 2009).
- Risk-adjusted 30-day mortality after a hip fracture among US Medicare women aged 65+ was 5.2% in 2005 (Brauer et al., JAMA, 2009).
- Risk-adjusted 180-day mortality after a hip fracture among US Medicare women aged 65+ was 16.8% in 1986 (Brauer et al., JAMA, 2009).
- Risk-adjusted 180-day mortality after a hip fracture among US Medicare women aged 65+ was 14.3% in 2005 (Brauer et al., JAMA, 2009).
- Risk-adjusted 360-day mortality after a hip fracture among US Medicare women aged 65+ was 24.0% in 1986 (Brauer et al., JAMA, 2009).
- Risk-adjusted 30-day mortality after a hip fracture among US Medicare men aged 65+ was 11.9% in 1986 (Brauer et al., JAMA, 2009).
- Risk-adjusted 30-day mortality after a hip fracture among US Medicare men aged 65+ was 9.3% in 2005 (Brauer et al., JAMA, 2009).
- Risk-adjusted 180-day mortality after a hip fracture among US Medicare men aged 65+ was 30.7% in 1986 (Brauer et al., JAMA, 2009).
- Risk-adjusted 180-day mortality after a hip fracture among US Medicare men aged 65+ was 22.9% in 2005 (Brauer et al., JAMA, 2009).
- Risk-adjusted 360-day mortality after a hip fracture among US Medicare men aged 65+ was 40.6% in 1986 (Brauer et al., JAMA, 2009).
- Risk-adjusted 360-day mortality after a hip fracture among US Medicare men aged 65+ was 32.5% in 2004 (Brauer et al., JAMA, 2009).
- In US hospitals in the ACS NSQIP programme, 8.1% of patients who had hip-fracture surgery in 2011 died within 30 days of the operation (Rhayem et al., Journal of Clinical Endocrinology and Metabolism, 2025).
- In US hospitals in the ACS NSQIP programme, 6.5% of patients who had hip-fracture surgery in 2017 died within 30 days of the operation (Rhayem et al., Journal of Clinical Endocrinology and Metabolism, 2025).
- In US hospitals, 19.97 per 1,000 hip-fracture admissions of patients aged 65+ ended in death in hospital (about 2.0%), pooled 2020-2022 data (Agency for Healthcare Research and Quality, 2025).
- In US hospitals, 2.0% of patients aged 65+ admitted with a hip fracture (19.97 per 1,000 admissions) died in hospital, pooled 2020-2022 data (Agency for Healthcare Research and Quality, 2025).
Japan, South Korea and Taiwan
- Korean women aged 60+ had 196.7 deaths per 1,000 person-years in the year after a hip fracture in 2006 (nationwide) (Hong & Han, Osteoporosis and Sarcopenia, 2019).
- Korean women aged 60+ had 177.7 deaths per 1,000 person-years in the year after a hip fracture in 2015 (nationwide) (Hong & Han, Osteoporosis and Sarcopenia, 2019).
- Korean men aged 60+ had 228.7 deaths per 1,000 person-years in the year after a hip fracture in 2006 (nationwide) (Hong & Han, Osteoporosis and Sarcopenia, 2019).
- Korean men aged 60+ had 260.3 deaths per 1,000 person-years in the year after a hip fracture in 2015 (nationwide) (Hong & Han, Osteoporosis and Sarcopenia, 2019).
- In South Korea, 18.9% of people aged 50+ who had a hip fracture in 2006 died within one year (national health insurance claims; Chung et al., Osteoporosis International, 2025).
- In South Korea, 15.4% of people aged 50+ who had a hip fracture in 2018 died within one year (national health insurance claims; Chung et al., Osteoporosis International, 2025).
- In South Korea, 18.2% of people aged 50+ who had a hip fracture in 2021 died within one year (national health insurance claims; Chung et al., Osteoporosis International, 2025).
- In Taiwan, 3.76% of people aged 50+ hospitalised for a first hip fracture in 2000 died within 30 days (national insurance data; Wu et al., Scientific Reports, 2024).
- In Taiwan, 2.92% of people aged 50+ hospitalised for a first hip fracture in 2015 died within 30 days (national insurance data; Wu et al., Scientific Reports, 2024).
- In Taiwan, 8,505 of 285,891 people aged 50+ hospitalised for a first hip fracture (2.98%) died within 30 days, 2000-2015 (Wu et al., Scientific Reports, 2024).
- 22% of people in Taiwan who died within 30 days of a hip fracture died of circulatory diseases such as ischaemic heart disease and stroke, and 18% of accidents and unintentional injuries (Wu et al., Scientific Reports, 2024).
- In Japan, 1.8% of patients aged 60+ operated on for a hip fracture in 2011 died during their hospital stay (national DPC inpatient database; Hatano et al., Archives of Osteoporosis, 2025).
- In Japan, 1.9% of patients aged 60+ operated on for a hip fracture in 2021 died during their hospital stay (national DPC inpatient database; Hatano et al., Archives of Osteoporosis, 2025).
- In Japan, the mean acute hospital stay after hip-fracture surgery fell from 37.1 days in 2011 to 33.1 days in 2021, and the mean wait for surgery from 3.5 to 3.0 days (Hatano et al., Archives of Osteoporosis, 2025).
- In the Japan National Hip Fracture Database, 48.1% of patients had surgery within 36 hours of arriving at hospital in 2018 (Yamamoto et al., Injury, 2024).
- In the Japan National Hip Fracture Database, 58.6% of patients had surgery within 36 hours of arriving at hospital in 2019 (Yamamoto et al., Injury, 2024).
- In the Japan National Hip Fracture Database, 44.9% of patients had surgery within 36 hours of arriving at hospital in 2020 (Yamamoto et al., Injury, 2024).
- About 240,000 people in Japan had a hip fracture in 2020, a number projected to reach 320,000 by 2040 (Yamamoto et al., Injury, 2024).
Trends in studies
- Across six decades of published studies, mean one-year mortality after a hip fracture fell from 27% in the 1960s to 20% in the 2010s, while the mean age of patients rose from 73 to 82 (Haleem et al., Injury, 2023).
- The average age of hip-fracture patients in published studies was 82 years in the 2010s, up from 81 in the 2000s and 73 in the 1960s (Haleem et al., Injury, 2023).
- Studies published from 1959 to 1998 reported mortality after a hip fracture of 11-23% at six months and 22-29% at one year, essentially unchanged over four decades (Haleem et al., Injury, 2008).
- Mean one-year mortality after hip-fracture surgery in randomised trials published in the 1980s was 24% (70 trials, 1981-2012; change not significant) (Mundi et al., Acta Orthopaedica, 2014).
- Mean one-year mortality after hip-fracture surgery in randomised trials published in the 1990s was 23% (70 trials, 1981-2012; change not significant) (Mundi et al., Acta Orthopaedica, 2014).
- Mean one-year mortality after hip-fracture surgery in randomised trials published after 1999 was 21% (70 trials, 1981-2012; change not significant) (Mundi et al., Acta Orthopaedica, 2014).
- Mean one-year mortality after intertrochanteric hip fractures in randomised trials fell from 34% in studies published before 2000 to 23% after 1999, while femoral neck fractures stayed around 20% (Mundi et al., Acta Orthopaedica, 2014).
Sources: National Hip Fracture Database (2016-2026); Archives of Gerontology and Geriatrics; Health Services Research; Journal of Bone and Mineral Research; Australian and New Zealand Hip Fracture Registry / NeuRA; European Journal of Public Health; Journal of the American Geriatrics Society; Bone; The Bone & Joint Journal; Public Health Scotland (2021-2026); Scottish Health Technologies Group; National Office of Clinical Audit (2024, 2025); Archives of Osteoporosis (2025, 2026); Danish Multidisciplinary Hip Fracture Registry (2022-2026); Acta Orthopaedica (2014, 2018, 2019); RIKSHÖFT; Epidemiology; Swedish Fracture Register (2024, 2025, 2026); BMC Geriatrics; Norwegian Hip Fracture Register; Norwegian Directorate of Health; Finnish Institute for Health and Welfare, PERFECT (2025); Dutch Hip Fracture Audit, DICA (2024, 2025); European Journal of Trauma and Emergency Surgery; IQTIG (2025); Wissenschaftliches Institut der AOK; Zentralinstitut für die kassenärztliche Versorgung; Journal of Clinical Medicine; Registro Nacional de Fracturas de Cadera; Journal of Orthopaedic Surgery and Research; Cureus; Australian and New Zealand Hip Fracture Registry (2017-2026); Canadian Institute for Health Information (2025, 2026); Public Health Agency of Canada; JAMA; Journal of Clinical Endocrinology and Metabolism; Agency for Healthcare Research and Quality; Osteoporosis and Sarcopenia; Osteoporosis International; Scientific Reports; Injury (2008, 2022, 2024)
06 / The oldest and frailest
What is the prognosis for a 90-year-old with a broken hip?
In Germany, 51.96% of men aged 90 died within a year of hip-fracture surgery, against 18.25% of all men that age (WIdO, 2012-2014).

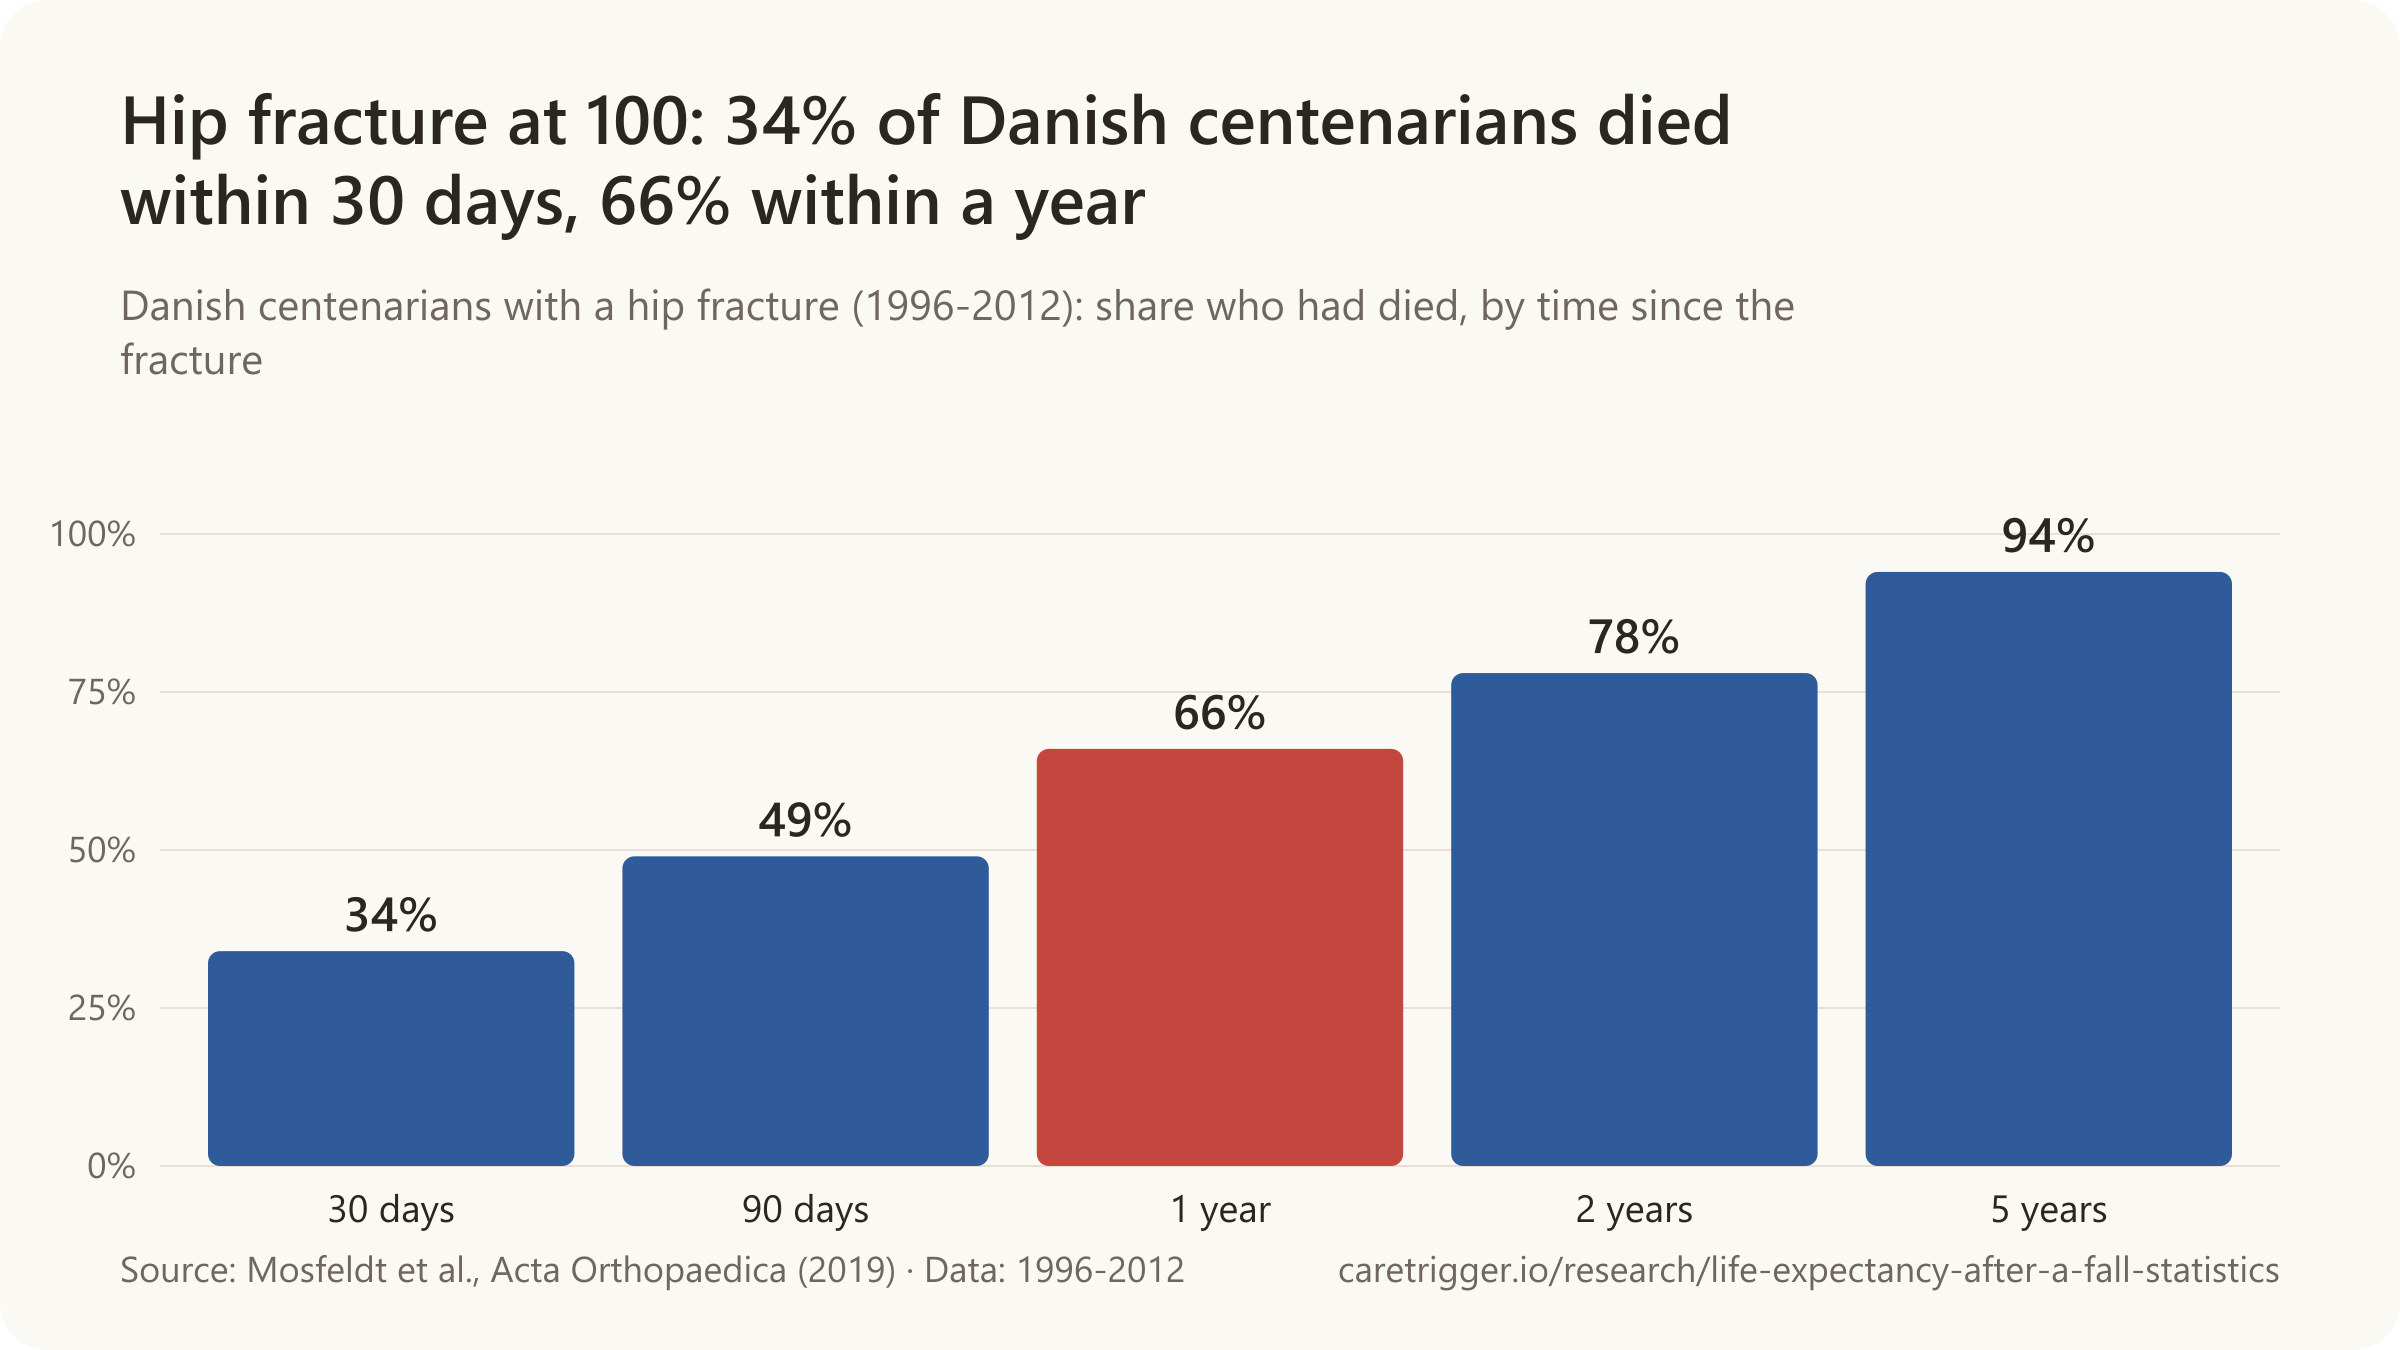
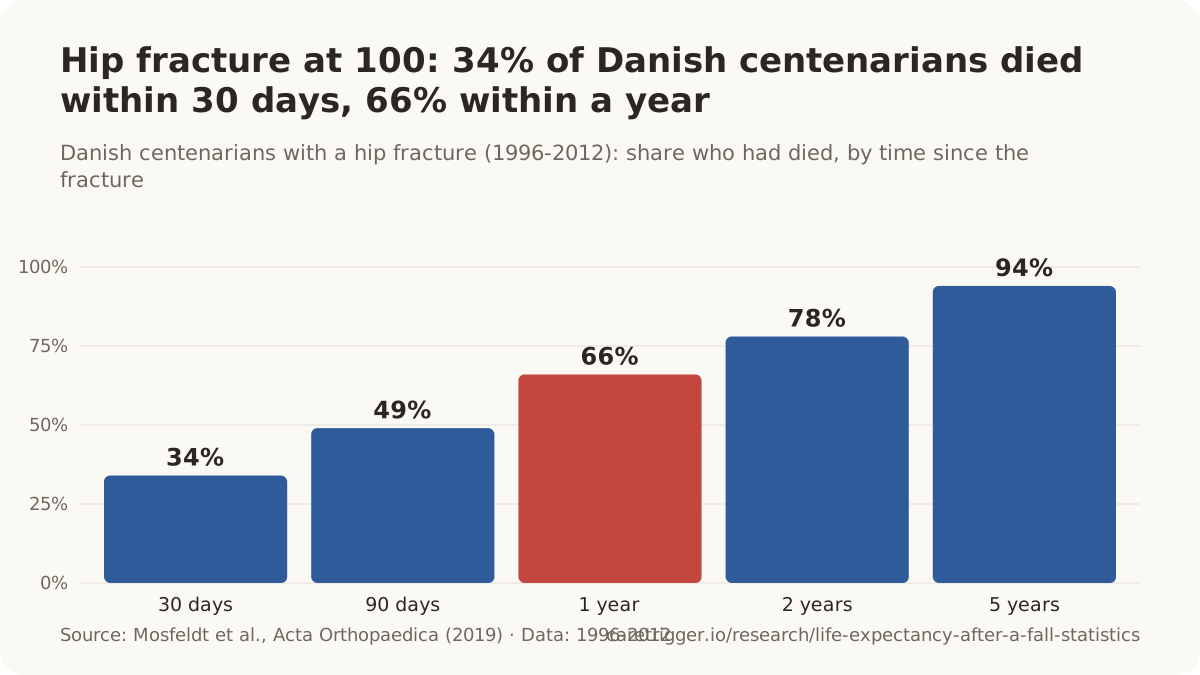
- In England and Wales, 12.6% of hip-fracture patients from nursing homes died within 30 days in 2025, against 4.71% from their own home.
- In Denmark, 52.8% of hip-fracture patients who had lived in a care home died within a year, against 18.2% from their own home (2023-2024).
- Across studies, 39% of people with dementia died within a year of hip-fracture surgery (2018).
- Across 23 studies, 53.8% of centenarians died within a year of a hip fracture (2023).
- Among frail Dutch nursing-home residents with a hip fracture, 83% of those not operated on died within 30 days, against 25% after surgery (2018-2020).
| Patients, place and years | Died within a year |
|---|---|
| Aged 100 and over, Denmark (1996-2012) | 66% |
| Aged 100 and over, Barcelona (small cohort) | 62.1% (in their 90s: 29.9%) |
| Aged 85 and over, northern Sweden (2000-2017) | 47.8% |
| Women veterans aged 90 and over, US (2000-2010) | 45.6% |
| Women aged 90, Germany (2012-2014) | 35.27% |
Sources: Wissenschaftliches Institut der AOK; Acta Orthopaedica; National Hip Fracture Database; Danish Multidisciplinary Hip Fracture Registry; Journal of Orthopaedic Surgery and Research; European Geriatric Medicine (2025, 2023); JAMA Surgery; Injury; Cureus
More statistics (58)
In Germany, 51.96% of men aged 90 died within a year of hip-fracture surgery, compared with 18.25% of all men the same age (WIdO, 2018).
The oldest patients, people living in care homes and people with dementia have the highest death rates after a hip fracture, and men more than women. Without surgery, most frail patients die within weeks; the decision to operate is made with them and their families, and these figures describe groups, not any one person.
Aged 90, 95 and 100 or more
- Pooled across 23 studies, 53.8% of centenarians died within a year of a hip fracture (6,970 patients) (Abelleyra Lastoria et al., European Geriatric Medicine, 2023).
- Derived from Bernstein et al. (Cureus, 2022): 45.6% of US women veterans (women aged 90 and over) died within one year of hip-fracture surgery (54.39% were alive at one year).
- 15% of Spanish centenarians hospitalised with a hip fracture died in hospital (4,261 patients, 2004-2020): 31.8% of those not operated on and 12.5% of those who had surgery (Piñeiro-Fernández et al., Archives of Osteoporosis, 2025).
- 15.44% of centenarians with a hip fracture died in hospital, compared with 3.58% of patients under 80, in German-speaking geriatric trauma centres (316 centenarians, 2016-2022) (Pass et al., Journal of Clinical Medicine, 2024).
- Patients older than 95 who survived hospital admission for a hip fracture lived 1.32 years afterwards (median; maximum 9.2 years), in a Barcelona hospital cohort of 175 (Barceló et al., Age and Ageing, 2024).
- Among patients over 95 with a hip fracture, men had 2.49 times the risk of death of women, and poorer walking ability before the fracture 2.29 times (Barcelona) (Barceló et al., Age and Ageing, 2024).
- Patients older than 95 lived 2.24 years on average after discharge from hospital for a hip fracture, and those who walked unaided again within six months survived longer (152 patients, Barcelona) (Barceló et al., Journal of Clinical Medicine, 2026).
- One-year mortality after hip-fracture surgery among people in their 90s was 14.7% in an Australian hospital and 36.0% in three Malaysian hospitals, while 30-day mortality was similar (8.6% vs 10.3%) (Saleh et al., BMC Geriatrics, 2026).
- Japanese hip-fracture patients aged 90 and over had 2.19 times the odds of dying in hospital of matched patients aged 65-89 (129,953 matched pairs, 2016-2022) (Mori et al., Journal of Bone and Mineral Metabolism, 2025).
- Centenarians with a hip fracture had twice the mortality of patients in their 90s: 62.1% vs 29.9% at one year and 41.4% vs 20.8% at three months (small Barcelona cohort) (Barceló et al., Injury, 2018).
- 34% of Danish centenarians with a hip fracture had died within 30 days, against 11% of hip-fracture patients aged 70-99 (1996-2012) (Mosfeldt et al., Acta Orthopaedica, 2019).
- 49% of Danish centenarians with a hip fracture had died within 90 days, against 19% of hip-fracture patients aged 70-99 (1996-2012) (Mosfeldt et al., Acta Orthopaedica, 2019).
- 66% of Danish centenarians with a hip fracture had died within one year, against 31% of hip-fracture patients aged 70-99 (1996-2012) (Mosfeldt et al., Acta Orthopaedica, 2019).
- 78% of Danish centenarians with a hip fracture had died within two years, against 42% of hip-fracture patients aged 70-99 (1996-2012) (Mosfeldt et al., Acta Orthopaedica, 2019).
- 94% of Danish centenarians with a hip fracture had died within five years, against 64% of hip-fracture patients aged 70-99 (1996-2012) (Mosfeldt et al., Acta Orthopaedica, 2019).
- Danish centenarians lived a median of 97 days after a hip fracture, against 1,029 days (about 2.8 years) for hip-fracture patients aged 70-99 (1996-2012) (Mosfeldt et al., Acta Orthopaedica, 2019).
- Over a mean follow-up of 1.85 years, 31.5% of Italian centenarians operated on for a hip fracture survived, against 48.1% of centenarians without a fracture, the excess being concentrated in the first three months (Mazzola et al., Journals of Gerontology A, 2016).
- 47.8% of people aged 85 and over who broke a hip died within a year (184 hip fractures in a representative cohort of 1,277 very old adults in northern Sweden, 2000-2017) (Olofsson et al., European Geriatric Medicine, 2025).
- Among people aged 85+ with a hip fracture, a subtrochanteric fracture (just below the hip joint) was associated with 4.40 times the risk of dying within a year (northern Sweden) (Olofsson et al., European Geriatric Medicine, 2025).
- Among people aged 85+ with a hip fracture, depressive disorders (without dementia) before the fracture were associated with 2.55 times the risk of dying within a year (northern Sweden) (Olofsson et al., European Geriatric Medicine, 2025).
- Among people aged 85+ with a hip fracture, a history of stroke was associated with 2.34 times the risk of dying within a year (northern Sweden) (Olofsson et al., European Geriatric Medicine, 2025).
- Among people aged 85+ with a hip fracture, a body mass index of 30 or more before the fracture was associated with about a quarter of the risk of dying within a year (HR 0.26) (northern Sweden) (Olofsson et al., European Geriatric Medicine, 2025).
- 55.4% of people aged 85+ living in residential care (31 people) died within a year of a hip fracture, against 44.5% (57) of those living at home (northern Sweden) (Olofsson et al., European Geriatric Medicine, 2025).
- 70.0% of people aged 85+ with a history of stroke died within a year of a hip fracture (northern Sweden) (Olofsson et al., European Geriatric Medicine, 2025).
- 57.4% of people aged 85+ with depressive disorders died within a year of a hip fracture (northern Sweden) (Olofsson et al., European Geriatric Medicine, 2025).
- Over 70% of people aged 85+ with a subtrochanteric hip fracture died within a year, against a 24% one-year mortality for subtrochanteric fractures at a mean age of 81 in the Swedish Fracture Register (Olofsson et al., European Geriatric Medicine, 2025).
Care homes and nursing homes
- 12.6% of hip-fracture patients aged 60 and over admitted from a nursing home in England and Wales died within 30 days in 2025 (National Hip Fracture Database, 2026).
- In Denmark, 52.8% of hip-fracture patients aged 65+ who lived in a care institution before the fracture died within one year, compared with 18.2% of those admitted from their own home (Danish Multidisciplinary Hip Fracture Registry, 2026).
- 25.0% of aged care residents (60 of 240) died within three months of a surgically treated hip fracture, and 62.1% died within a mean follow-up of 1.2 years (Australia) (Liu et al., Scientific Reports, 2021).
- 36.2% of US long-term nursing home residents (21,766 of 60,111) died within 180 days of a hip fracture (2005-2009) (Neuman et al., JAMA Internal Medicine, 2014).
- 53.5% of nursing home residents who could still move about before a hip fracture had died or become totally dependent in locomotion within 180 days (US, 2005-2009) (Neuman et al., JAMA Internal Medicine, 2014).
- Among US nursing home residents with a hip fracture, non-operative management was associated with about twice the risk of death compared with internal fixation (HR 2.08), and age over 90 with 2.17 times the risk compared with age 75 or below (Neuman et al., JAMA Internal Medicine, 2014).
- A hip fracture was associated with one-year mortality 17 percentage points higher among US nursing home residents and 15.8 points higher among people living in the community, compared with matched people without a fracture (Tajeu et al., Journals of Gerontology A, 2014).
- 4.71% of hip-fracture patients aged 60 and over admitted from their own home or sheltered housing in England and Wales died within 30 days in 2025 (National Hip Fracture Database, 2026).
- 10.53% of hip-fracture patients aged 60 and over admitted from a residential care home in England and Wales died within 30 days in 2025 (National Hip Fracture Database, 2026).
- In Denmark, 18.2% of hip-fracture patients aged 65+ who were admitted from their own home died within one year of their operation (Danish Multidisciplinary Hip Fracture Registry, 2026).
Dementia, delirium and frailty
- Pooled across studies, 39% of people with dementia died within one year of hip-fracture surgery (meta-analysis) (Bai et al., Journal of Orthopaedic Surgery and Research, 2018).
- 8.7% of New South Wales residents aged 65+ with dementia who were hospitalised for an injury (mostly falls) died within 30 days, versus 3.6% of those without dementia (Harvey et al., Injury, 2016; 2003-2012).
- Men had twice the odds of dying in hospital after a hip fracture (OR 2.0), patients aged 91+ four times (OR 4.1), and those with serious other illness (ASA 3-5) 4.2 times (Stoke-on-Trent, 2006-2013) (Chatterton et al., Bone & Joint Journal, 2015).
- Pooled across studies, 12% of people with dementia died within 30 days of hip-fracture surgery (meta-analysis) (Bai et al., Journal of Orthopaedic Surgery and Research, 2018).
- Pooled across studies, 32% of people with dementia died within six months of hip-fracture surgery (meta-analysis) (Bai et al., Journal of Orthopaedic Surgery and Research, 2018).
- Dementia was associated with 1.77 times the risk of death in the year after hip-fracture surgery (RR 1.57 at 30 days, 1.97 at six months) (meta-analysis) (Bai et al., Journal of Orthopaedic Surgery and Research, 2018).
- Among US older adults hospitalised with a hip fracture, predicted one-year mortality was 35.4% for those with dementia against 24% for those without, and 14.8% for people with dementia who had no fracture (Hunt et al., Journal of the American Geriatrics Society, 2025).
- Among US nursing home residents with advanced dementia and a hip fracture, 31.5% of those who had surgery and 53.8% of those managed without surgery died within six months (2008-2013) (Berry et al., JAMA Internal Medicine, 2018).
- Few nursing home residents with advanced dementia were walking six months after a hip fracture: 10.7% of survivors who had surgery and 4.8% of those who did not (Berry et al., JAMA Internal Medicine, 2018).
- Frail patients aged 75+ had a one-year mortality of 21.3% after hip-fracture surgery, against 4.4% for non-frail patients (adjusted HR 3.88) (Xi et al., BMC Geriatrics, 2025).
- Hip-fracture patients with delirium were three times as likely to die in hospital, and three times as likely to need to move into a care home, as those without (National Hip Fracture Database, 2026).
- In 2025, 11.4% of hip-fracture patients who screened positive for possible delirium on admission (4AT score 4 or more) died within 30 days, compared with 4.1% of those who screened negative (National Hip Fracture Database, 2026).
- In 2025, 4.1% of hip-fracture patients without signs of delirium on admission (4AT score 0 to 3) died within 30 days (National Hip Fracture Database, 2026).
- Hip-fracture patients aged 70+ who had both dementia and a depressive disorder had 4.67 times the odds of dying within 12 months, after adjustment for age, gender, comorbidity, walking ability and fracture type (Umeå, Sweden) (Olofsson et al., BMC Geriatrics, 2023).
- Hip-fracture patients aged 70+ with dementia (without depression) had 4.05 times the odds of dying within 12 months (Umeå, Sweden) (Olofsson et al., BMC Geriatrics, 2023).
- 41.3% of hip-fracture patients aged 70+ had dementia and 38.5% a depressive disorder at the time of the fracture (Umeå, Sweden) (Olofsson et al., BMC Geriatrics, 2023).
Without surgery
- Among frail nursing home residents aged 70+ with a hip fracture who chose their treatment with doctors and family, 83% of those managed without surgery and 25% of those operated on died within 30 days (Netherlands) (Loggers et al., JAMA Surgery, 2022).
- 57.1% of Dutch hip-fracture patients treated without surgery died within 30 days and 37.6% within 7 days; 3.2% of patients were treated this way (Dutch Hip Fracture Audit) (van Bremen et al., Journal of Orthopaedic Trauma, 2024).
Living alone
- Norwegian hip-fracture patients aged 50-79 who lived alone had higher mortality over 12.8 years than those living with a partner: HR 1.37 (95% CI 1.29-1.44) for men and 1.23 (1.18-1.28) for women, among 12,770 men and 22,067 women fractured 2002-2013 (Dahl et al., Journal of Bone and Mineral Research, 2021).
- Eight years after a hip fracture, relative survival (vs the general population) was 43% for men and 61% for women who lived alone, compared with 51% and 67% for those living with a partner (Dahl et al., 2021).
Other studies
- Among 1.19 million Japanese hip-fracture surgery patients aged 65+, men had 2.29 times the risk of death within a year of women, and patients aged 95+ 5.93 times that of patients aged 65-69 (2013-2021) (Nishimura et al., Archives of Osteoporosis, 2023).
Sources: Wissenschaftliches Institut der AOK; European Geriatric Medicine (2023, 2025); Cureus; Archives of Osteoporosis (2023, 2025); Journal of Clinical Medicine (2024, 2026); Age and Ageing; BMC Geriatrics (2023, 2025, 2026); Journal of Bone and Mineral Metabolism; Injury (2015, 2018); Acta Orthopaedica; The Journals of Gerontology, Series A (2014, 2016); National Hip Fracture Database (2026); Danish Multidisciplinary Hip Fracture Registry; Scientific Reports; JAMA Internal Medicine (2014, 2018); Journal of Orthopaedic Surgery and Research; The Bone & Joint Journal; Journal of the American Geriatrics Society; JAMA Surgery; Journal of Orthopaedic Trauma; Journal of Bone and Mineral Research
07 / Brain bleeds
What are the chances of surviving a brain bleed after a fall?
Of older adults found to have a clinically important brain bleed after a fall, 21% died within 90 days (CMAJ, 2023).

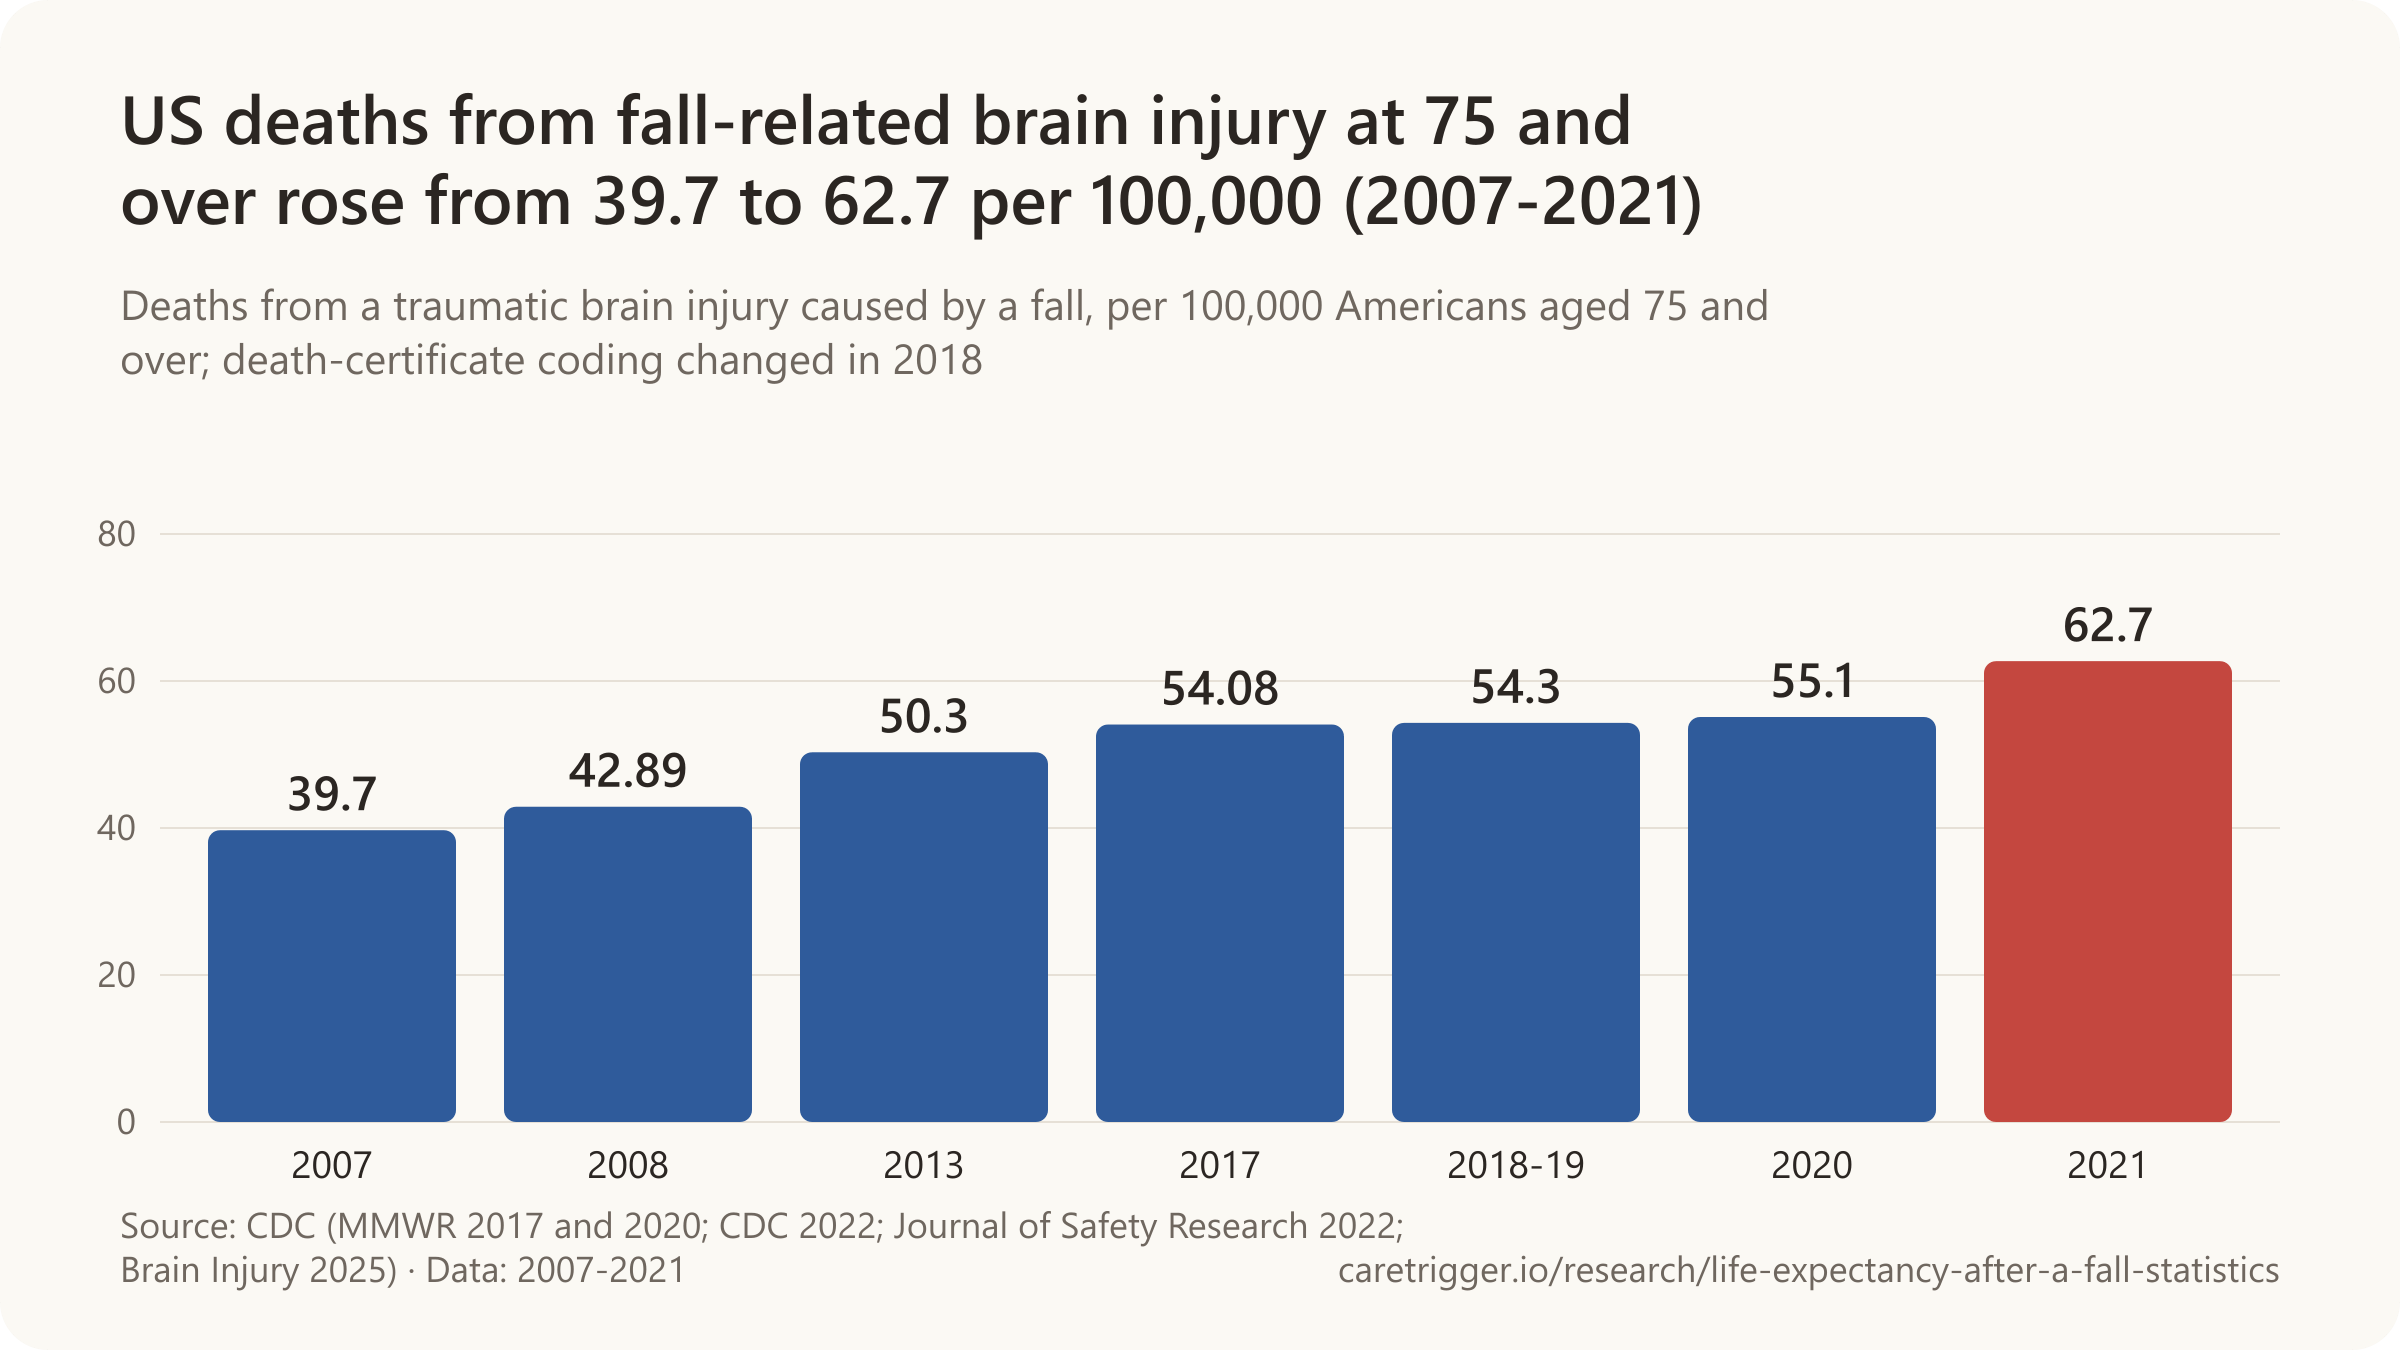
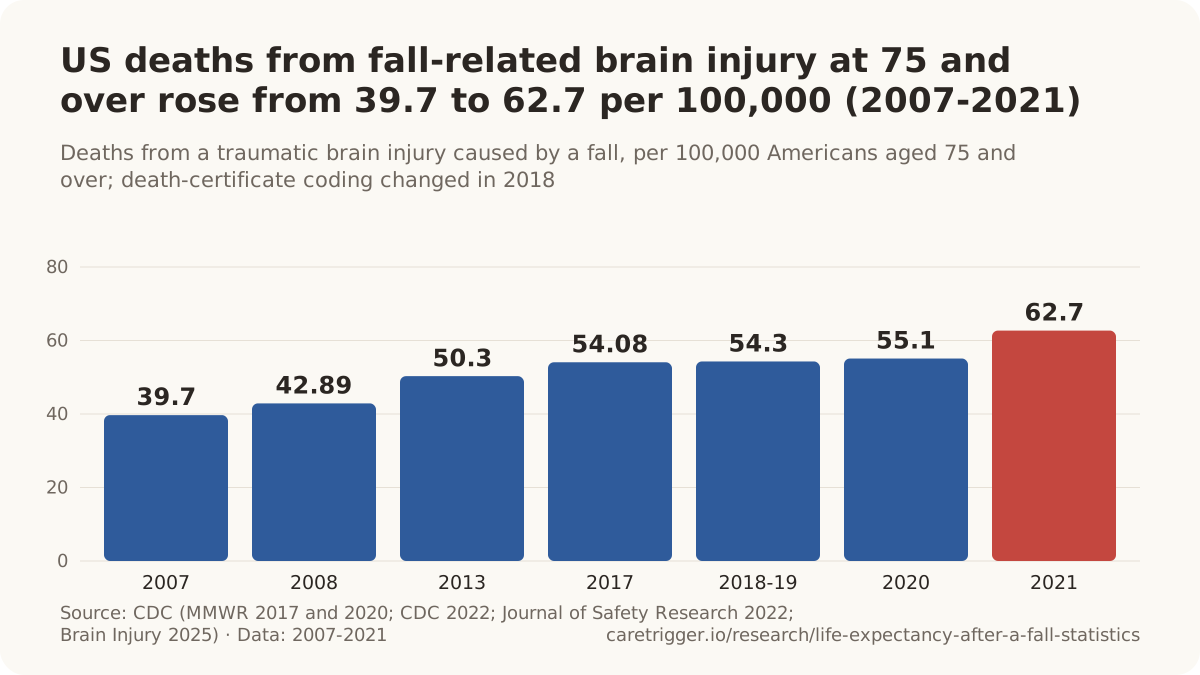
- Traumatic brain injury was involved in 50.3% of fall deaths among Americans 65 and older in 2005.
- Of adults 65 and older in hospital with a severe brain injury, 84% had died six months later (2007-2016).
- In a US population study, 32.9% of people with a chronic subdural haematoma died within a year (2019-2020).
- Of adults 65 and older seen in an emergency department after a fall, 3.2% had a clinically important brain bleed (2023).
| Severity | Died within a year |
|---|---|
| Mild traumatic brain injury (over 60) | 10.7% died |
| Moderate traumatic brain injury (over 60) | 42.5% died |
| Severe traumatic brain injury (over 60) | 79.3% died |
This section covers bleeds caused by an injury (subdural, epidural and other traumatic bleeds), not strokes.
Sources: CMAJ; CDC, MMWR Surveillance Summaries; CDC, Morbidity and Mortality Weekly Report; Centers for Disease Control and Prevention; Journal of Safety Research (2022, 2008); Brain Injury; American Journal of Respiratory and Critical Care Medicine; Stroke; NeuroRehabilitation
More statistics (196)
21% of older adults diagnosed with clinically important bleeding inside the skull after a fall died within 90 days (de Wit et al., CMAJ, 2023).
A bleed inside the skull after a fall is one of the main reasons falls kill older people, and the share of brain-injury deaths caused by falls rises with age. Most older fallers seen in an emergency department have no bleed; for those who do, the outlook depends on the size and type of the bleed, the person's age and health, and how quickly it is found.
Brain injury deaths and hospital stays in the US

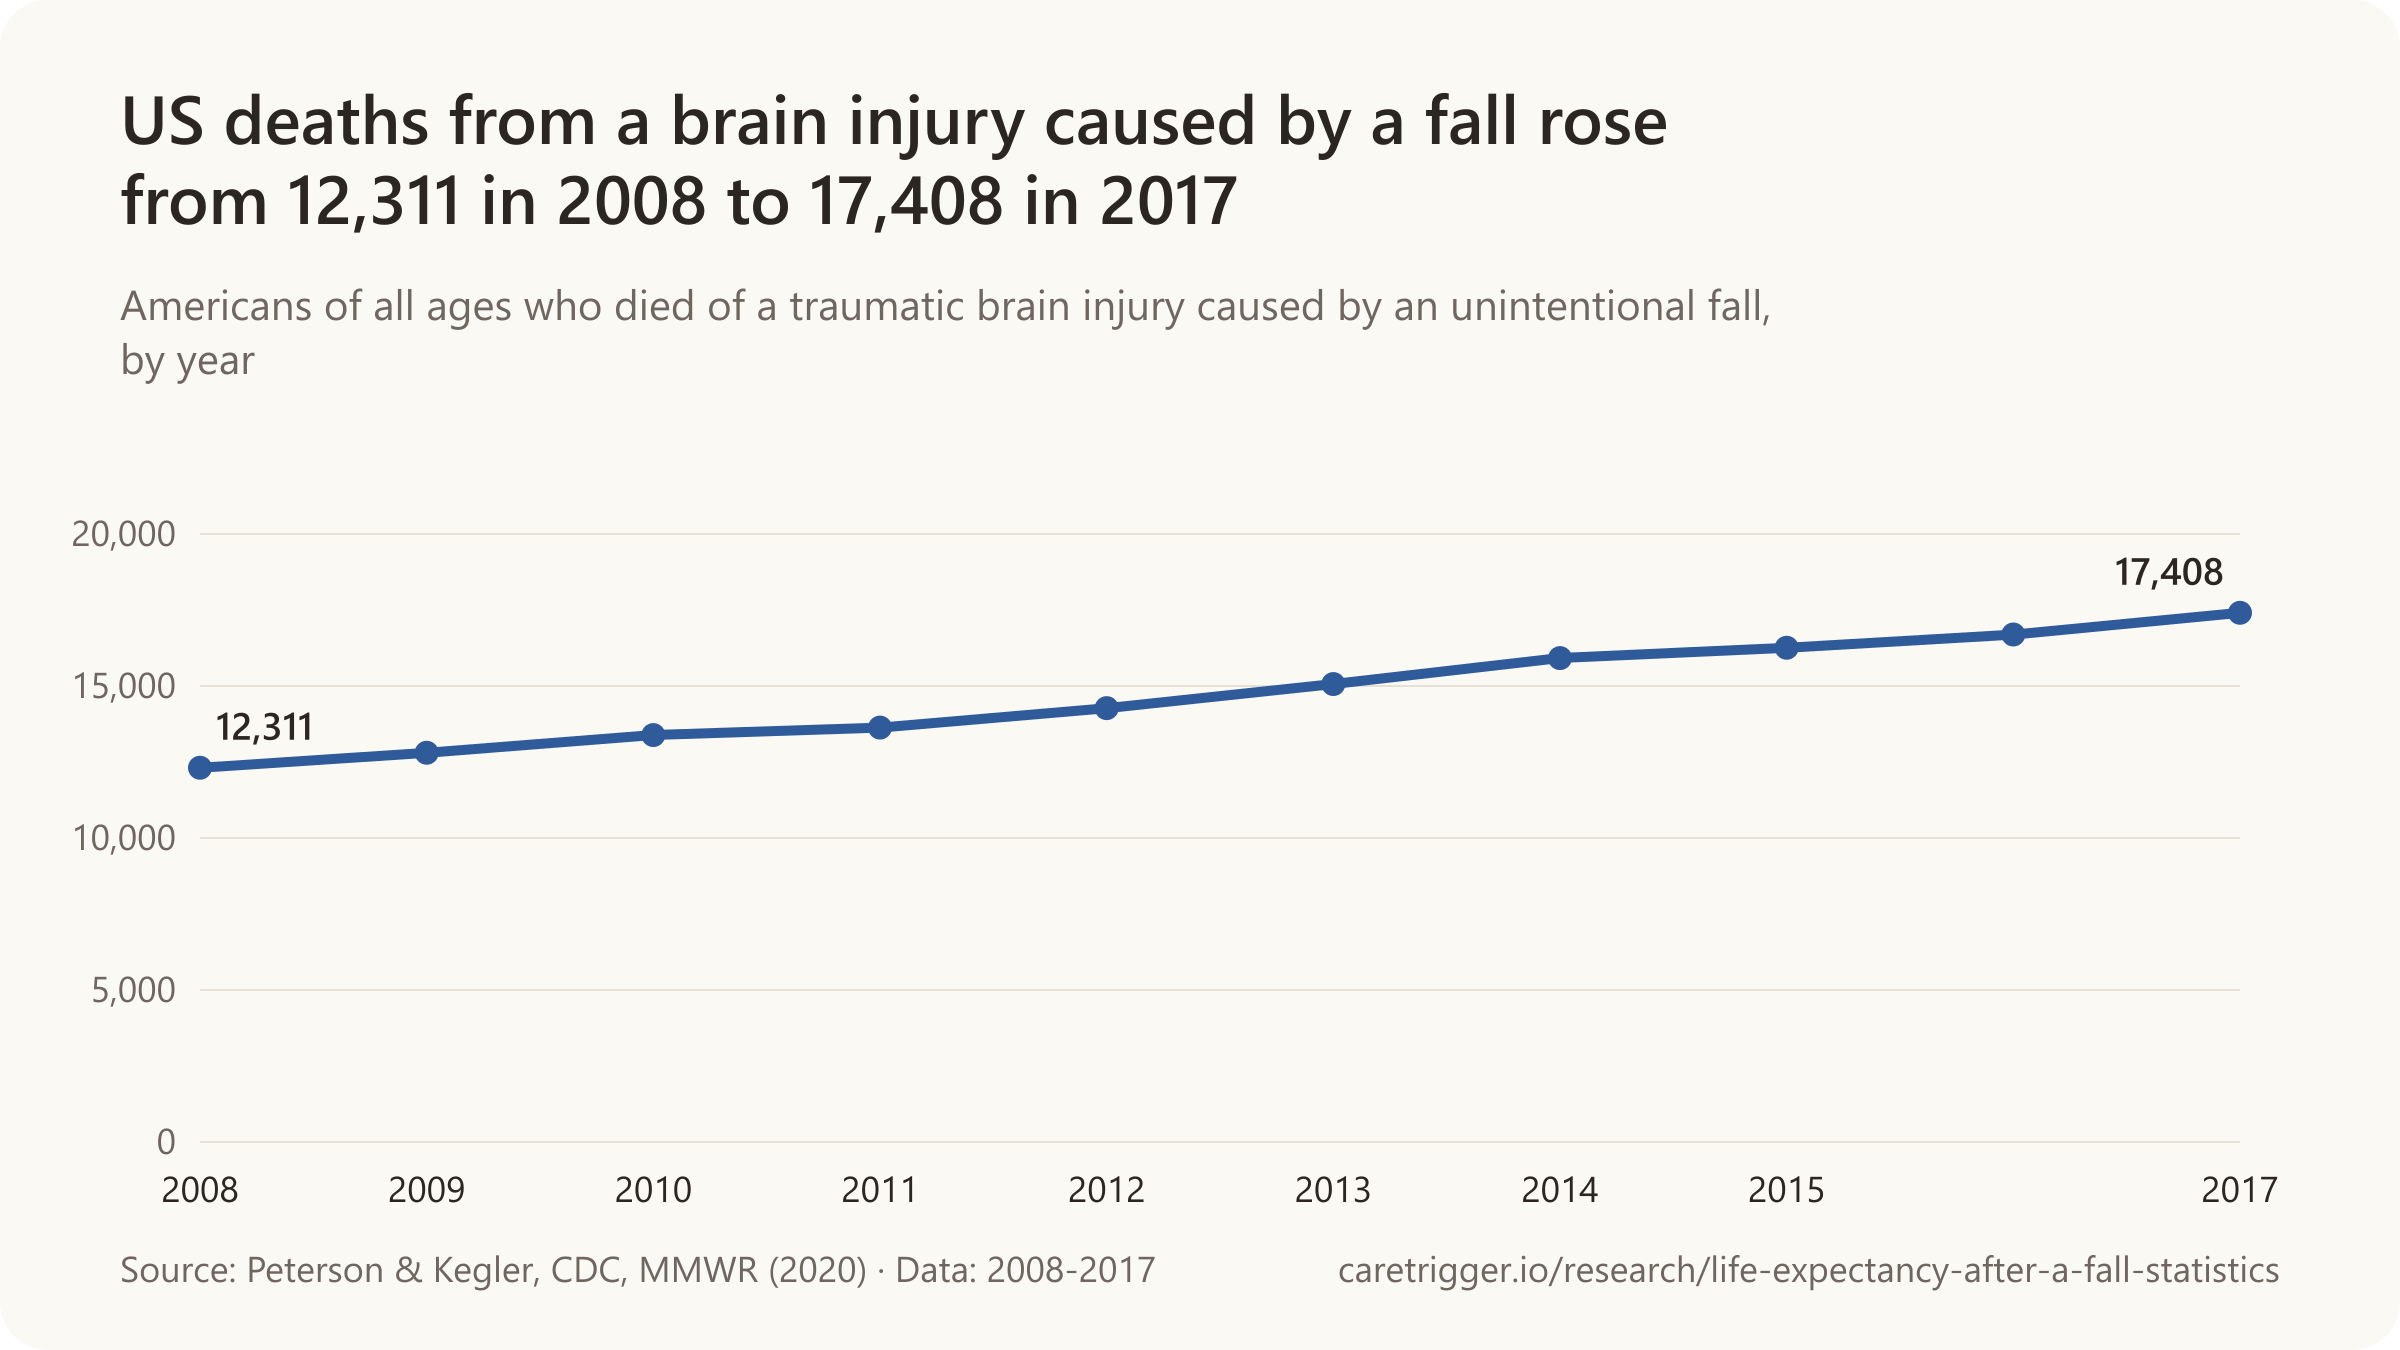
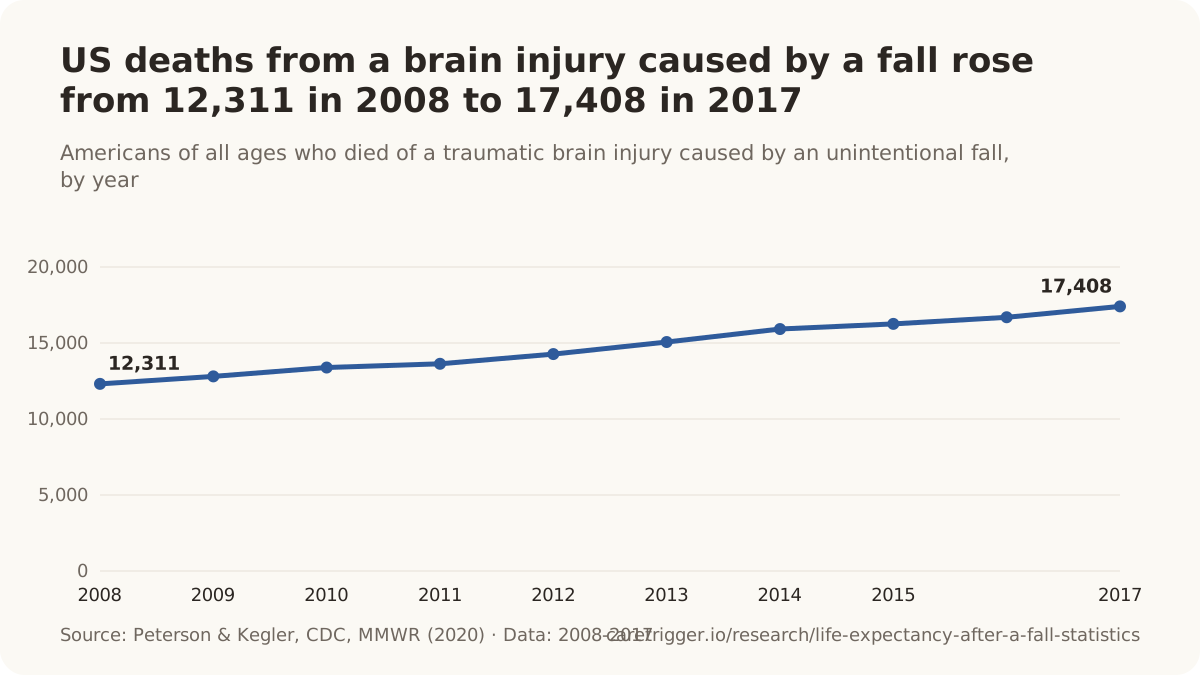
- Traumatic brain injury was involved in 50.3% of unintentional fall deaths among Americans aged 65+ in 2005 (7,946 fall-related TBI deaths) (Thomas et al., CDC, Journal of Safety Research, 2008).
- Unintentional falls caused 72.3% of traumatic brain injury deaths among Americans aged 75+ in 2021 (13,898 of 19,218), computed from CDC death data (Peterson, Thomas & Kegler, Brain Injury, 2025).
- In 2007, 39.7 per 100,000 Americans aged 75+ died of a traumatic brain injury caused by a fall (7,344 deaths) (CDC, MMWR Surveillance Summaries, 2017).
- In 2008, 42.89 per 100,000 Americans aged 75+ died of a traumatic brain injury caused by an unintentional fall (7,836 deaths) (Peterson & Kegler, CDC MMWR, 2020).
- In 2013, 50.3 per 100,000 Americans aged 75+ died of a traumatic brain injury caused by a fall (9,796 deaths) (CDC, MMWR Surveillance Summaries, 2017).
- In 2017, 54.08 per 100,000 Americans aged 75+ died of a traumatic brain injury caused by an unintentional fall (11,452 deaths) (Peterson & Kegler, CDC MMWR, 2020).
- In 2018 and 2019, an average of 12,076 Americans aged 75+ a year died of a traumatic brain injury caused by an unintentional fall, a rate of 54.3 per 100,000 (CDC, 2022).
- In 2020, 12,728 Americans aged 75+ died of a traumatic brain injury caused by an unintentional fall, a rate of 55.1 per 100,000 (Peterson, Zhou & Thomas, CDC, Journal of Safety Research, 2022).
- In 2021, 13,898 Americans aged 75+ died of a traumatic brain injury caused by an unintentional fall, a rate of 62.7 per 100,000 (Peterson, Thomas & Kegler, CDC, Brain Injury, 2025).
- The fall-related traumatic brain injury death rate among Americans aged 75+ was about 8 times the rate among those aged 55-74 (6.24 per 100,000) in 2017 (Peterson & Kegler, CDC MMWR, 2020).
- The fall-related traumatic brain injury death rate among Americans aged 75+ rose by an average of 2.6% a year from 2008 to 2017, one of the two fastest increases of any group (Peterson & Kegler, CDC MMWR, 2020).
- The number of Americans aged 75+ who died of a fall-related traumatic brain injury rose 46%, from 7,836 in 2008 to 11,452 in 2017 (computed from Peterson & Kegler, CDC MMWR, 2020).
- In 2007, 66.3 per 100,000 Americans aged 75+ died with a traumatic brain injury from any cause (12,251 deaths) (CDC, MMWR Surveillance Summaries, 2017).
- In 2013, 76.1 per 100,000 Americans aged 75+ died with a traumatic brain injury from any cause (14,806 deaths), the highest rate of any age group (CDC, MMWR Surveillance Summaries, 2017).
- In 2018, 16,591 Americans aged 75+ died with a traumatic brain injury from any cause, a rate of 75.7 per 100,000 (CDC, 2022).
- In 2019, 17,314 Americans aged 75+ died with a traumatic brain injury from any cause, a rate of 76.7 per 100,000 (CDC, 2022).
- In 2020, 17,755 Americans aged 75+ died with a traumatic brain injury from any cause, a rate of 76.8 per 100,000, the highest of any age group (Peterson, Zhou & Thomas, CDC, Journal of Safety Research, 2022).
- In 2021, 19,218 Americans aged 75+ died with a traumatic brain injury from any cause, a rate of 86.6 per 100,000 (Peterson, Thomas & Kegler, CDC, Brain Injury, 2025).
- Americans aged 75+ died of fall-related traumatic brain injuries at 54.3 per 100,000 a year in 2018 and 2019, over five times the rate of those aged 65-74 (9.5 per 100,000) (CDC, 2022).
- Unintentional falls accounted for 29.9% of all traumatic brain injury deaths in the United States in 2018 and 2019, at all ages (CDC, 2022).
- In 2007, 257.3 per 100,000 Americans aged 75+ were hospitalised with a traumatic brain injury caused by a fall (47,553 hospitalisations) (CDC, MMWR Surveillance Summaries, 2017).
- In 2013, 354.8 per 100,000 Americans aged 75+ were hospitalised with a traumatic brain injury caused by a fall (69,030 hospitalisations) (CDC, MMWR Surveillance Summaries, 2017).
- In 2018, 263.3 per 100,000 Americans aged 75+ were hospitalised and survived a traumatic brain injury caused by an unintentional fall, the highest rate of any age group (Peterson & Thomas, CDC MMWR, 2021).
- Unintentional falls caused 82.0% of nonfatal traumatic brain injury hospitalisations among Americans aged 75+ in 2018 (57,720 stays) (Peterson & Thomas, CDC MMWR, 2021).
- Unintentional falls caused 66.3% of nonfatal traumatic brain injury hospitalisations among Americans aged 65-74 in 2018 (21,280) (Peterson & Thomas, CDC MMWR, 2021).
- Unintentional falls caused 51.0% of nonfatal traumatic brain injury hospitalisations in the United States in 2018, at all ages (Peterson & Thomas, CDC MMWR, 2021).
- In 2018, 321.4 per 100,000 Americans aged 75+ were hospitalised for a nonfatal traumatic brain injury from any cause, the highest rate of any age group (Peterson & Thomas, CDC MMWR, 2021).
- Americans aged 75+ were hospitalised for a nonfatal traumatic brain injury at about 3 times the rate of those aged 65-74 (105.5 per 100,000) in 2018 (Peterson & Thomas, CDC MMWR, 2021).
- Emergency department visits for fall-related traumatic brain injury among Americans aged 75+ more than doubled, from 129,618 in 2007 to 282,912 in 2013 (from 701.5 to 1,453.9 per 100,000) (CDC, MMWR Surveillance Summaries, 2017).
- Fall-related traumatic brain injuries among Americans aged 75+ accounted for 17.9% of the national increase in TBI emergency department visits between 2007 and 2013 (CDC, MMWR Surveillance Summaries, 2017).
- People aged 75+ made up 31.4% of traumatic brain injury hospitalisations and 26.5% of TBI deaths in the United States in 2013, more than any other age group (CDC, MMWR Surveillance Summaries, 2017).
- Traumatic brain injury accounted for 8.0% of nonfatal fall-related hospitalisations among Americans aged 65+ in 2005 (an estimated 56,423 stays) (Thomas et al., CDC, Journal of Safety Research, 2008).
- Adults aged 65+ accounted for 38.4% of all traumatic brain injury deaths and 43.9% of all TBI hospitalisations in the United States in 2017 (Waltzman et al., CDC, JAMA Neurology, 2022).
Bleeds found after a fall in the emergency department
- 3.2% of adults aged 65+ who came to an emergency department after a fall from standing, a chair, a toilet or a bed (139 of 4,308) were diagnosed with clinically important bleeding inside the skull within 42 days (de Wit et al., CMAJ, 2023).
- 10% of adults aged 65+ with a 'mild' head injury (GCS 13-15) and an acute subdural haematoma died or were discharged to hospice, against 3% of those aged 18-64 (Orlando et al., Journal of Trauma and Acute Care Surgery, 2026).
- Only 51% of adults aged 65+ with a mild head injury and an acute subdural haematoma were discharged home, against 78% of those aged 18-64 (Orlando et al., Journal of Trauma and Acute Care Surgery, 2026).
- 10.6% of trauma patients over 70 admitted after a ground-level fall had an intracranial injury, against 8.7% of younger patients (Spaniolas et al., Journal of Trauma, 2010).
- About 5% of people aged 65+ who go to an emergency department after a fall have bleeding inside the skull (pooled incidence 5.2% within six weeks) (de Wit et al., Injury, 2020).
- Among older adults with a clinically important head bleed after a fall, 32% had a subdural bleed alone and 37% bleeding in more than one compartment; 6% needed neurosurgery (de Wit et al., CMAJ, 2023).
- 3.4% of older fallers taking an anticoagulant (38 of 1,119) and 3.7% of those taking an antiplatelet drug (58 of 1,567) had a clinically important head bleed, against 3.2% of all fallers, computed from de Wit et al. (CMAJ, 2023).
- 4.4% of adults aged 65+ with a mild head injury after a ground-level fall (72 of 1,620) had a significant bleed inside the skull, and 0.3% needed urgent neurosurgery (Dubucs et al., PLOS Medicine, 2026).
- 6.8% of adults aged 65+ seen in emergency departments with a head injury from a ground-level fall had a traumatic bleed inside the skull, and 8.0% of those with a bleed needed urgent neurosurgery (Dubucs et al., Annals of Emergency Medicine, 2026).
- Taking an anticoagulant before a ground-level fall was not associated with a higher chance of a head bleed in adults aged 65+ (OR 0.8) (Dubucs et al., Annals of Emergency Medicine, 2026).
- About 21% of trauma patients aged 65+ admitted after a ground-level fall had a traumatic brain injury, whether or not they took blood thinners (21.61% vs 21.25%), across 90 US hospitals (Fakhry et al., Journal of Trauma and Acute Care Surgery, 2021).
- 6.2% of patients aged 65+ with a moderate traumatic brain injury from a ground-level fall died before leaving hospital, and 6.5% had a complication, in the US trauma quality database (Forssten et al., Frontiers in Medicine, 2023).
Acute subdural haematoma
- Pooled across studies, 49.3% of patients aged 60+ operated for an acute subdural haematoma had died at follow-up (mean about 7 months), and 39.8% at hospital discharge (Manivannan et al., BMJ Open, 2021).
- 79.3% of patients aged 60+ operated for an acute subdural haematoma had died or were severely disabled at follow-up, in pooled data from eight studies (Manivannan et al., BMJ Open, 2021).
- 31% of patients aged 70+ admitted to neurosurgery with an acute subdural haematoma died in hospital, and 63% had a poor outcome (death, vegetative state or severe disability) at discharge (Trevisi et al., Neurosurgical Focus, 2020).
- 76.1% of adults aged 65+ with an acute subdural haematoma who arrived in deep coma (GCS 3-5) died, and only 4.0% made a good recovery, in Korea's national neurotrauma data bank (Eom et al., Journal of Neurotrauma, 2025).
- Among patients aged 75+ operated for an acute subdural haematoma in Helsinki, 42% of those independent before the injury died within a year, against 69% of those who were dependent (Raj et al., World Neurosurgery, 2016).
- 56% of patients aged 75+ taking antithrombotic medication died within a year of surgery for an acute subdural haematoma, against 30% of those not taking it (Raj et al., World Neurosurgery, 2016).
- 77% of patients aged 75+ who survived the first year after surgery for an acute subdural haematoma were still alive at the end of follow-up, a life expectancy comparable to their peers (Raj et al., World Neurosurgery, 2016).
- Patients aged 60+ with a mild head injury and a subdural haematoma from a ground-level fall died at a rate of 12.5% a year (Naylor et al., World Neurosurgery, 2022).
- Patients aged 60+ with a mild head injury and a traumatic subdural haematoma had a median survival of 4.6 years after the injury, in a Mayo Clinic series where most were hurt in ground-level falls (Naylor et al., World Neurosurgery, 2022).
- 56% of patients over 80 with a mild head injury and a subdural haematoma from a ground-level fall died during follow-up, against 18% of those injured another way (Naylor et al., World Neurosurgery, 2022).
- Older patients with an acute subdural haematoma from a fall had four times the adjusted odds of dying in hospital of younger adults with the same injury (AOR 4.0), in a Taiwanese trauma centre (Hsieh et al., IJERPH, 2018).
Chronic subdural haematoma
- 32.9% of people with a chronic subdural haematoma died within one year and 9.4% within 30 days, in a population-based US study (Robinson et al., Stroke, 2026).
- 32% of older patients diagnosed with a chronic subdural haematoma died within one year, and 26.3% within six months (Miranda et al., Journal of Neurosurgery, 2011).
- 16.7% of older patients with a chronic subdural haematoma (35 patients) died in hospital, and only 44 returned home (Miranda et al., Journal of Neurosurgery, 2011).
- After discharge, older patients with a chronic subdural haematoma had a median survival of 4.4 years, against 6 years expected for people of the same age (HR 1.94) (Miranda et al., Journal of Neurosurgery, 2011).
- Patients aged 85+ diagnosed with a chronic subdural haematoma had a median survival of 1.5 years, the shortest of any age group in the series (Dumont et al., World Neurosurgery, 2013).
- Patients aged 55+ diagnosed with a chronic subdural haematoma survived a median of about 4 years after diagnosis (Dumont et al., World Neurosurgery, 2013).
- Patients with a chronic subdural haematoma had 9% excess mortality at one year, 18% at five years, 27% at ten years and 48% at 20 years compared with the matched general population (Rauhala et al., Acta Neurochirurgica, 2020).
- Patients with a chronic subdural haematoma had 18% cumulative excess mortality 5 years after diagnosis compared with the matched general population (Rauhala et al., Acta Neurochirurgica, 2020).
- Patients with a chronic subdural haematoma had 27% cumulative excess mortality 10 years after diagnosis compared with the matched general population (Rauhala et al., Acta Neurochirurgica, 2020).
- Patients with a chronic subdural haematoma had 37% cumulative excess mortality 15 years after diagnosis compared with the matched general population (Rauhala et al., Acta Neurochirurgica, 2020).
- Patients with a chronic subdural haematoma had 48% cumulative excess mortality 20 years after diagnosis compared with the matched general population (Rauhala et al., Acta Neurochirurgica, 2020).
- Dementia was the most common cause of death among patients who had had a chronic subdural haematoma (21% of deaths), against 15% in matched controls (Rauhala et al., Acta Neurochirurgica, 2020).
- The 206 chronic subdural haematoma patients with no comorbidity had no excess mortality compared with the general population (Rauhala et al., Acta Neurochirurgica, 2020).
- 10 years after surgery for a chronic subdural haematoma, 55.5% of patients were alive, against 73.5% of age- and gender-matched Swiss people (Petutschnigg et al., JAMA Neurology, 2026).
- One year after surgery for a chronic subdural haematoma, 92.8% of patients were alive against 98.8% of matched controls, a standardised mortality ratio of 3.22 (Petutschnigg et al., JAMA Neurology, 2026).
- People operated for a chronic subdural haematoma had twice the risk of death of matched members of the general population over about ten years (HR 2.02) (Petutschnigg et al., JAMA Neurology, 2026).
- 64.3% of people with a chronic subdural haematoma had fallen from less than 3 feet (about 1 metre) beforehand, and 68% had a history of trauma (Robinson et al., Stroke, 2026).
- Men aged 85+ developed a chronic subdural haematoma at a rate of 354.8 per 100,000 a year, and women aged 85+ at 115.3 per 100,000 (Robinson et al., Stroke, 2026).
- An estimated 17.3 people per 100,000 in the United States develop a chronic subdural haematoma each year (Robinson et al., Stroke, 2026).
- 48.4% of deaths within 30 days of a chronic subdural haematoma were attributed to the bleed, while later deaths were mostly from neurodegenerative (27.2%) and cardiovascular (28.4%) disease (Robinson et al., Stroke, 2026).
- 26% of older people with dementia died within a year of surgery for a chronic subdural haematoma, against 16% of matched people with dementia who had no haematoma (Tommiska et al., Age and Ageing, 2021).
- 15% of adults operated for a chronic subdural haematoma in Finland died within a year, and 19% needed another operation (Tommiska et al., Journal of Neurosurgery, 2022).
- Patients with a chronic subdural haematoma had a 34% higher risk of death than the general population (HR 1.34), and more often died from falls (7.2% vs 3.7%) (Blaauw et al., Acta Neurochirurgica, 2022).
- Among patients with a chronic subdural haematoma, frequent falling (HR 1.3), being unable to live independently (HR 1.4) and being unable to perform daily self-care (HR 1.5) were each associated with a higher risk of death (Blaauw et al., Acta Neurochirurgica, 2022).
- Chronic subdural haematoma incidence among people aged 80+ nearly tripled in a Finnish region, from 46.9 to 129.5 per 100,000 a year between 1990 and 2015 (Rauhala et al., Journal of Neurosurgery, 2020).
- A ground-level fall was linked to the chronic subdural haematoma in 54% of patients aged 80+, against 31% of those under 60 (Rauhala et al., Journal of Neurosurgery, 2020).
- The share of chronic subdural haematoma patients taking anticoagulant or antiplatelet medication rose from 27% in 1990-1995 to 49% in 2011-2015 in a Finnish region (Rauhala et al., Journal of Neurosurgery, 2020).
- Across Finland, the age- and gender-adjusted rate of operations for chronic subdural haematoma among people aged 90+ rose 85% between 1997 and 2014 (IRR 1.85), against 24% at ages 60-69 (Tommiska et al., Journal of Neurosurgery, 2022).
- About 60,000 chronic subdural haematomas a year were projected to occur in the United States by 2030, making it the most common cranial neurosurgical condition among adults (Balser et al., Journal of Neurosurgery, 2015).
- Operations for chronic subdural haematoma in one English region were projected to rise 53% over 20 years, to 2040, because of population ageing (Stubbs et al., Acta Neurochirurgica, 2021).
- In Switzerland, people aged 80-89 were treated for a chronic subdural haematoma at a rate of 64.2 per 100,000 a year (El Rahal et al., Frontiers in Neurology, 2023).
- 28.4% of 63,358 patients treated for a chronic subdural haematoma in Japan had a poor functional outcome at discharge (modified Rankin score 3-6) (Toi et al., Journal of Neurosurgery, 2018).
- About 40% of patients aged 90+ treated for a chronic subdural haematoma in Japan could not be discharged home (Toi et al., Journal of Neurosurgery, 2018).
- 13.1% of chronic subdural haematomas recurred, in a national Japanese database of 63,358 patients (Toi et al., Journal of Neurosurgery, 2018).
- 9% of patients operated for a chronic subdural haematoma in the UK and Ireland needed repeat surgery for a recurrence within 60 days (Brennan et al., Journal of Neurosurgery, 2017).
- 22% of patients treated for a chronic subdural haematoma in UK and Irish neurosurgical units left with an unfavourable functional outcome (severe disability or death), and 2% died in the unit (Brennan et al., Journal of Neurosurgery, 2017).
- Chronic subdural haematoma incidence rises with age and may be up to three times higher among people over 80, in a systematic review of 18 studies from 12 countries (Dziho et al., Brain and Spine, 2025).
- 14% of patients operated for a chronic subdural haematoma in a national Finnish trial died within a median follow-up of 16.4 months (Tommiska et al., Acta Neurochirurgica, 2025).
- Among patients who died after surgery for a chronic subdural haematoma, the leading causes of death were circulatory disease (34%), accidents (16%) and dementia (15%) (Tommiska et al., Acta Neurochirurgica, 2025).
Severe brain injury in older age
- 84% of adults aged 65+ hospitalised with a severe traumatic brain injury had died six months later, and 79% died in hospital (Maiden et al., American Journal of Respiratory and Critical Care Medicine, 2020).
- Of adults aged 65+ with a severe traumatic brain injury who were admitted to intensive care, 73% had died at six months, 15% were dependent and 12% had regained functional independence (Maiden et al., American Journal of Respiratory and Critical Care Medicine, 2020).
- 97% of adults aged 65+ with a severe traumatic brain injury who were not admitted to intensive care had died at six months (Maiden et al., American Journal of Respiratory and Critical Care Medicine, 2020).
- Six months after a traumatic brain injury, 9% of patients aged 65+ with a mild injury and 60% with a moderate or severe injury had died, in the European CENTER-TBI study (van der Vlegel et al., Injury, 2022).
- 44% of patients aged 65+ with a mild traumatic brain injury, and 6% with a moderate or severe one, reported a full recovery six months later (van der Vlegel et al., Injury, 2022).
- 45% of patients aged 65+ with a traumatic brain injury in CENTER-TBI were admitted to intensive care, and nearly 30% received inpatient rehabilitation (van der Vlegel et al., Injury, 2022).
- 52% of patients over 55 with a severe closed traumatic brain injury died within six months, against 21% of those under 35 (Hukkelhoven et al., Journal of Neurosurgery, 2003).
- Each additional 10 years of age was associated with about 47% higher odds of death after a severe traumatic brain injury (OR 1.47) (Hukkelhoven et al., Journal of Neurosurgery, 2003).
- 60.7% of people aged 75+ with an isolated severe head injury died within 90 days and 28.2% died in hospital; falls caused 93.7% of these injuries (Bath et al., Australian Health Review, 2022).
- 36.4% of patients aged 60+ operated for a severe traumatic brain injury (98 of 269) died in hospital, in two Chinese neurosurgical centres (Shen et al., European Journal of Medical Research, 2023).
- 40% of patients with a traumatic brain injury in 56 European and Israeli hospitals (8,622 of 21,681) had been injured by a low-energy fall, typically from standing height (Lecky et al., PLOS Medicine, 2021).
- 6.3% of patients whose traumatic brain injury came from a low-energy fall died in hospital, similar to 7.0% after high-energy trauma such as road crashes (Lecky et al., PLOS Medicine, 2021).
- 44% of patients with a traumatic brain injury from a low-energy fall were taking anticoagulant or antiplatelet medication before the injury, against 13% of those hurt in high-energy trauma (Lecky et al., PLOS Medicine, 2021).
- Among patients admitted to intensive care, 22% of those with a brain injury from a low-energy fall died in hospital, against 16% after high-energy trauma (Lecky et al., PLOS Medicine, 2021).
- Among patients admitted to a hospital ward, those with a brain injury from a low-energy fall died at four times the rate of those hurt in high-energy trauma (4.2% vs 0.9%) (Lecky et al., PLOS Medicine, 2021).
- Patients with a brain injury from a low-energy fall were half as likely to receive critical care as those hurt in high-energy trauma (12% vs 24%) (Lecky et al., PLOS Medicine, 2021).
- Among adults over 60 with a severe traumatic brain injury, 79.3% died and 7.9% had a favourable outcome within a year, in pooled data from 11 studies (McIntyre et al., NeuroRehabilitation, 2013).
- Among adults over 60 with a moderate traumatic brain injury, 42.5% died and 32.2% had a favourable outcome within a year (McIntyre et al., NeuroRehabilitation, 2013).
- Among adults over 60 with a mild traumatic brain injury, 10.7% died and 80.5% had a favourable outcome within a year (McIntyre et al., NeuroRehabilitation, 2013).
- 24.0% of head-injured trauma patients over 64 died, against 12.8% of younger adults, in the New York State Trauma Registry (risk ratio 2.2) (Susman et al., Journal of Trauma, 2002).
- Among head-injured trauma patients who arrived with only a mildly reduced level of consciousness (GCS 13-15), those over 64 had 7.8 times the risk of death of younger adults (Susman et al., Journal of Trauma, 2002).
- 61.2% of Medicare beneficiaries aged 65+ hospitalised with a moderate to severe traumatic brain injury died within 30 days, a rate that did not change between 2005 and 2011 (Enumah et al., American Journal of Surgery, 2018).
- 58% of people aged 65+ with a severe traumatic brain injury from a fall of less than 3 metres died within two weeks, in 24 New York State trauma centres (Gerber et al., Journal of Trauma Management & Outcomes, 2009).
- Falls caused 61% of severe traumatic brain injuries among people aged 65+ treated at New York State trauma centres (Gerber et al., Journal of Trauma Management & Outcomes, 2009).
Older fallers on blood thinners
- 75% of patients aged 65+ with a fall-induced brain bleed who were taking warfarin had an unfavourable outcome at discharge, against 27% of those taking neither warfarin nor aspirin (Inamasu et al., Geriatrics & Gerontology International, 2012).
- 12.0% of emergency patients with blunt head trauma taking clopidogrel had a bleed inside the skull on the first CT, against 5.1% of those taking warfarin (Nishijima et al., Annals of Emergency Medicine, 2012).
- 0.6% of emergency patients with head trauma taking warfarin (4 of 687) developed a delayed brain bleed within two weeks after a normal first CT (Nishijima et al., Annals of Emergency Medicine, 2012).
- 0.60% of anticoagulated patients (vitamin K antagonists) with a mild head injury and a normal first CT had a bleed on a second scan 24 hours later, and 0.13% needed neurosurgery or died (Chauny et al., Journal of Emergency Medicine, 2016).
- 2.43% of head-injured patients on direct oral anticoagulants and 2.31% on warfarin had a delayed brain bleed after a normal first CT, in studies where most patients had fallen from standing height (Puzio et al., Journal of the American College of Surgeons, 2021).
- 0.36% of head-injured patients on anticoagulants (11 of 3,051) died from complications of a delayed brain bleed after a normal first CT (Puzio et al., Journal of the American College of Surgeons, 2021).
- 2.0% of anticoagulated head trauma patients had a delayed bleed on a repeat CT within 24 hours of a normal first scan; 0.1% needed neurosurgery and 0.1% died (Pessôa et al., World Neurosurgery, 2024).
- Patients on warfarin-type anticoagulants who suffered blunt head trauma had about twice the odds of dying as similar patients not on them (OR 2.008), in a meta-analysis of 11 studies (Batchelor & Grayson, British Journal of Neurosurgery, 2012).
- 55.6% of patients aged 65+ admitted with a traumatic brain injury were taking antiplatelet or anticoagulant medication; neither drug type alone was associated with higher 30-day mortality, but the combination was (Rønning et al., Frontiers in Neurology, 2021).
Other countries
- Falls from less than 2 metres caused 39.1% of major trauma in England and Wales in 2013, the most common cause, ahead of road traffic collisions (Kehoe et al., Emergency Medicine Journal, 2015).
- People over 75 made up 26.9% of major trauma patients in England and Wales in 2013, a threefold increase in their share since 1990 (Kehoe et al., Emergency Medicine Journal, 2015).
- People aged 80 to 90 formed the largest group of patients with a traumatic brain injury in England and Wales, more than one in five of all cases, with falls under 2 metres the main cause in older age (Lawrence et al., BMJ Open, 2016).
- 30% of patients aged 85+ admitted with a traumatic brain injury to a UK major trauma centre died, against 19% at 75-84 and 17% at 65-74 (Hawley et al., Emergency Medicine Journal, 2017).
- 17% of patients aged 65-74 admitted with a traumatic brain injury to a UK major trauma centre died (Hawley et al., Emergency Medicine Journal, 2017).
- 19% of patients aged 75-84 admitted with a traumatic brain injury to a UK major trauma centre died (Hawley et al., Emergency Medicine Journal, 2017).
- 78% of patients aged 65+ admitted with a traumatic brain injury survived, and 57% left hospital with a good outcome not needing a care package (Hawley et al., Emergency Medicine Journal, 2017).
- Falls caused 85% of traumatic brain injuries among patients aged 65+ admitted to a UK major trauma centre, mostly falls at home (Hawley et al., Emergency Medicine Journal, 2017).
- Patients seriously injured by falls from under 2 metres in England and Wales had a median age of 79.4, and 74.2% were over 65 (127,334 patients, 2017-2019) (Tonkins, Bouamra & Lecky, Emergency Medicine Journal, 2023).
- 19% of patients aged 65+ admitted to a Norwegian trauma centre with a traumatic brain injury seen on CT died within 30 days (151 of 832) (Rønning et al., Frontiers in Neurology, 2021).
- Hospitalisations for traumatic brain injury among people aged 65+ in New South Wales rose 7.2% a year, from 65.3 to 151.8 per 100,000, between 1998 and 2011 (Harvey & Close, Injury, 2012).
- Falls caused 82.9% of traumatic brain injury hospitalisations among people aged 65+ in New South Wales, mostly falls on the same level at home (Harvey & Close, Injury, 2012).
- 13% of hospitalisations for traumatic brain injury among people aged 65+ in New South Wales ended in death, most after a traumatic subdural haemorrhage (Harvey & Close, Injury, 2012).
- Traumatic subdural haemorrhage was the most common type of brain injury among people aged 65+ hospitalised in New South Wales (42.9%), ahead of concussion (24.1%) (Harvey & Close, Injury, 2012).
- Just under one third of traumatic brain injury hospitalisations among people aged 65+ in New South Wales were of people aged 85+ (Harvey & Close, Injury, 2012).
- In Canada, the rate of hospitalisation for fall-related traumatic brain injury among adults aged 65+ rose 29% between 2006 and 2011, the largest increase of any group (Fu et al., Journal of Trauma and Acute Care Surgery, 2015).
- The age-adjusted rate of hospital-treated fall-related brain injuries among Finnish women aged 80+ rose from 167.9 to 800.4 per 100,000 between 1970 and 2017, an increase of 377% (Kannus et al., Archives of Gerontology and Geriatrics, 2020).
- The age-adjusted rate of hospital-treated fall-related brain injuries among Finnish men aged 80+ rose from 176.8 to 927.3 per 100,000 between 1970 and 2017, an increase of 424% (Kannus et al., Archives of Gerontology and Geriatrics, 2020).
- If trends continue, fall-related brain injuries among Finns aged 80+ were projected to reach about 4,811 a year by 2030, 1.8 times the 2,613 treated in 2017 (Kannus et al., Archives of Gerontology and Geriatrics, 2020).
- 10% of major trauma patients aged 16-59 in England and Wales (711 of 7,143) had died within 30 days, in TARN's 2014 cohort (TARN, Major Trauma in Older People, 2017).
- 12.6% of major trauma patients aged 60-69 in England and Wales (221 of 1,754) had died within 30 days, in TARN's 2014 cohort (TARN, Major Trauma in Older People, 2017).
- 18.4% of major trauma patients aged 70-79 in England and Wales (368 of 1,997) had died within 30 days, in TARN's 2014 cohort (TARN, Major Trauma in Older People, 2017).
- 24.8% of major trauma patients aged 80-89 in England and Wales (665 of 2,684) had died within 30 days, in TARN's 2014 cohort (TARN, Major Trauma in Older People, 2017).
- 27.1% of major trauma patients aged 90+ in England and Wales (275 of 1,014) had died within 30 days, in TARN's 2014 cohort (TARN, Major Trauma in Older People, 2017).
- 10.9% of major trauma patients aged 16-59 in England and Wales (779 deaths) had died within 12 months, in TARN's 2014 cohort (TARN, Major Trauma in Older People, 2017).
- 15.2% of major trauma patients aged 60-69 in England and Wales (267 deaths) had died within 12 months, in TARN's 2014 cohort (TARN, Major Trauma in Older People, 2017).
- 25.3% of major trauma patients aged 70-79 in England and Wales (505 deaths) had died within 12 months, in TARN's 2014 cohort (TARN, Major Trauma in Older People, 2017).
- 36.9% of major trauma patients aged 80-89 in England and Wales (991 deaths) had died within 12 months, in TARN's 2014 cohort (TARN, Major Trauma in Older People, 2017).
- 44.8% of major trauma patients aged 90+ in England and Wales (454 deaths) had died within 12 months, in TARN's 2014 cohort (TARN, Major Trauma in Older People, 2017).
- A severe head injury was present in 63.4% of major trauma patients aged 16-59 who died (451 deaths) in England and Wales, in TARN's 2014 cohort (TARN, Major Trauma in Older People, 2017).
- A severe head injury was present in 76% of major trauma patients aged 60-69 who died (168 deaths) in England and Wales, in TARN's 2014 cohort (TARN, Major Trauma in Older People, 2017).
- A severe head injury was present in 82.2% of major trauma patients aged 70-79 who died (304 deaths) in England and Wales, in TARN's 2014 cohort (TARN, Major Trauma in Older People, 2017).
- A severe head injury was present in 82.9% of major trauma patients aged 80-89 who died (551 deaths) in England and Wales, in TARN's 2014 cohort (TARN, Major Trauma in Older People, 2017).
- A severe head injury was present in 85% of major trauma patients aged 90+ who died (233 deaths) in England and Wales, in TARN's 2014 cohort (TARN, Major Trauma in Older People, 2017).
- Adults aged 60+ now account for more than 50% of severely injured patients in England and Wales' national trauma database (TARN, Major Trauma in Older People, 2017).
- Only 15.6% of patients aged 90+ with a serious brain injury first admitted to a local trauma unit were transferred to a major trauma centre, against 65% of those aged 16-59 (TARN, Major Trauma in Older People, 2017).
- 85% of major trauma among people aged 90+ in England and Wales happened indoors, against 20% at ages 16-59 (TARN, Major Trauma in Older People, 2017).
- The age-adjusted rate of hospital admission for fall-related head injury among people aged 65+ in the Netherlands more than doubled, from 53.1 per 100,000 in 1986 to 119.1 in 2008 (Hartholt et al., Journal of Neurotrauma, 2011).
- Since 2001 the rate of hospital admission for fall-related head injury among older Dutch people rose by 11.6% a year, against 1.2% a year in 1986-2000 (Hartholt et al., Journal of Neurotrauma, 2011).
- 16% of adults aged 65+ hospitalised with a traumatic brain injury in Canada died in hospital between 2006 and 2011, and 18% were discharged to long-term care (Fu et al., PLOS ONE, 2017).
- The rate of hospital admission for fall-related traumatic brain injury among Canadians aged 65+ rose 7% a year, from 138.6 to 179.2 per 100,000 between 2006 and 2011 (Fu et al., PLOS ONE, 2017).
- Head injuries caused 46% of deaths from ground-level falls among people aged 65+ reported to the Seattle-King County Medical Examiner in 2007 (109 of 237 deaths) (Chisholm & Harruff, American Journal of Forensic Medicine and Pathology, 2010).
- A subdural haematoma was found in 86% of older people who died of a head injury after a ground-level fall (Chisholm & Harruff, American Journal of Forensic Medicine and Pathology, 2010).
- 48% of older people who died of a head injury after a ground-level fall had been treated with anticoagulants, mostly warfarin, against 16% of those who died of other fall injuries (Chisholm & Harruff, American Journal of Forensic Medicine and Pathology, 2010).
- The share of Oklahomans aged 65+ with a traumatic brain injury who died fell from 32% in 1992 to 18% in 2003 (Fletcher, Khalid & Mallonee, Brain Injury, 2007).
- Half of traumatic brain injury deaths among Austrians aged 65+ between 1980 and 2012 were caused by falls, 22% by traffic accidents and 17% by suicide (Brazinova et al., Age and Ageing, 2015).
Recovery after a brain injury
- Adults aged 55+ treated for a traumatic brain injury had a 26% higher risk of developing dementia over 5-7 years than those treated for other injuries such as fractures (fully adjusted HR 1.26) (Gardner et al., JAMA Neurology, 2014).
- 8.4% of adults aged 55+ treated for a traumatic brain injury developed dementia within 5-7 years, against 5.9% of those treated for other injuries (Gardner et al., JAMA Neurology, 2014).
- Even a mild traumatic brain injury at age 65-74 was associated with a 25% higher risk of later dementia compared with other injuries (HR 1.25) (Gardner et al., JAMA Neurology, 2014).
- 65.2% of older patients had an unfavourable functional outcome after a traumatic brain injury, and 28.5% were admitted to a nursing home, in a meta-analysis of 25 studies (Gavrila Laic et al., Brain and Spine, 2021).
- 28.5% of older patients were admitted to a nursing home after a traumatic brain injury, in pooled data from a meta-analysis (Gavrila Laic et al., Brain and Spine, 2021).
- Fewer than half of adults aged 65+ regained full functional independence within six months of a mild traumatic brain injury, and up to 66% still had limits on activity and participation, in a review of 18 studies (Tan et al., European Geriatric Medicine, 2026).
- About 24% of adults aged 65+ had at least mild depression after a mild traumatic brain injury, and 9% moderate-to-severe anxiety (Tan et al., European Geriatric Medicine, 2026).
- 71.6% of Medicare patients aged 65+ treated in inpatient rehabilitation after a traumatic brain injury went home to the community in 2018, up from 67.8% in 2013 (Deutsch et al., Archives of Physical Medicine and Rehabilitation, 2024).
- More than three quarters of Medicare patients aged 65+ admitted to inpatient rehabilitation after a traumatic brain injury had a history of recent falls, and more than one third already used a walker (Deutsch et al., Archives of Physical Medicine and Rehabilitation, 2024).
- The number of Medicare patients aged 65+ treated in inpatient rehabilitation for a traumatic brain injury rose 28.2%, from 14,657 in 2013 to 18,791 in 2018 (Deutsch et al., Archives of Physical Medicine and Rehabilitation, 2024).
Bleeds from an injury are not strokes. Figures for strokes, such as the 26.7% five-year survival quoted on care websites for "a brain bleed after a fall", describe bleeds that start inside the brain without an injury, and are left off this page. The "15% mortality for fall-related brain bleeds" in some papers restates two older studies (16% in-hospital death among Canadians 65 and older admitted with a brain injury, and an 18% case fatality in Oklahoma); both are here with their populations. One source table is inconsistent: the England and Wales trauma audit gives 63.6% dead at six months and 44.8% at twelve months for patients aged 90 and over, which cannot both be right, so neither is charted.
Sources: CMAJ; CDC, Morbidity and Mortality Weekly Report (2020, 2021); Journal of Safety Research (2008, 2022); Brain Injury (2007, 2025); CDC, MMWR Surveillance Summaries; Centers for Disease Control and Prevention; JAMA Neurology (2014, 2022, 2026); Journal of Trauma and Acute Care Surgery (2015, 2021, 2026); Journal of Trauma (2002, 2010); Injury (2012, 2019, 2022); PLOS Medicine (2021, 2026); Annals of Emergency Medicine (2012, 2025); Frontiers in Medicine; BMJ Open (2016, 2021); Neurosurgical Focus; Journal of Neurotrauma (2011, 2025); World Neurosurgery (2012-2024); International Journal of Environmental Research and Public Health; Stroke; Journal of Neurosurgery (2003-2021); Acta Neurochirurgica (2020-2025); Age and Ageing (2014, 2021); Frontiers in Neurology (2021, 2023); Brain and Spine (2021, 2025); American Journal of Respiratory and Critical Care Medicine; Australian Health Review; European Journal of Medical Research; NeuroRehabilitation; American Journal of Surgery; Journal of Trauma Management & Outcomes; Geriatrics & Gerontology International; Journal of Emergency Medicine; Journal of the American College of Surgeons; British Journal of Neurosurgery; Emergency Medicine Journal (2015, 2017, 2023); Archives of Gerontology and Geriatrics; Trauma Audit and Research Network, University of Manchester; PLOS ONE; American Journal of Forensic Medicine and Pathology; European Geriatric Medicine; Archives of Physical Medicine and Rehabilitation
08 / Pelvis
What is the life expectancy after a fractured pelvis?
Of people 60 and older with a fragility fracture of the pelvis, 17% died within a year and 46% within five years (Injury, 2025).

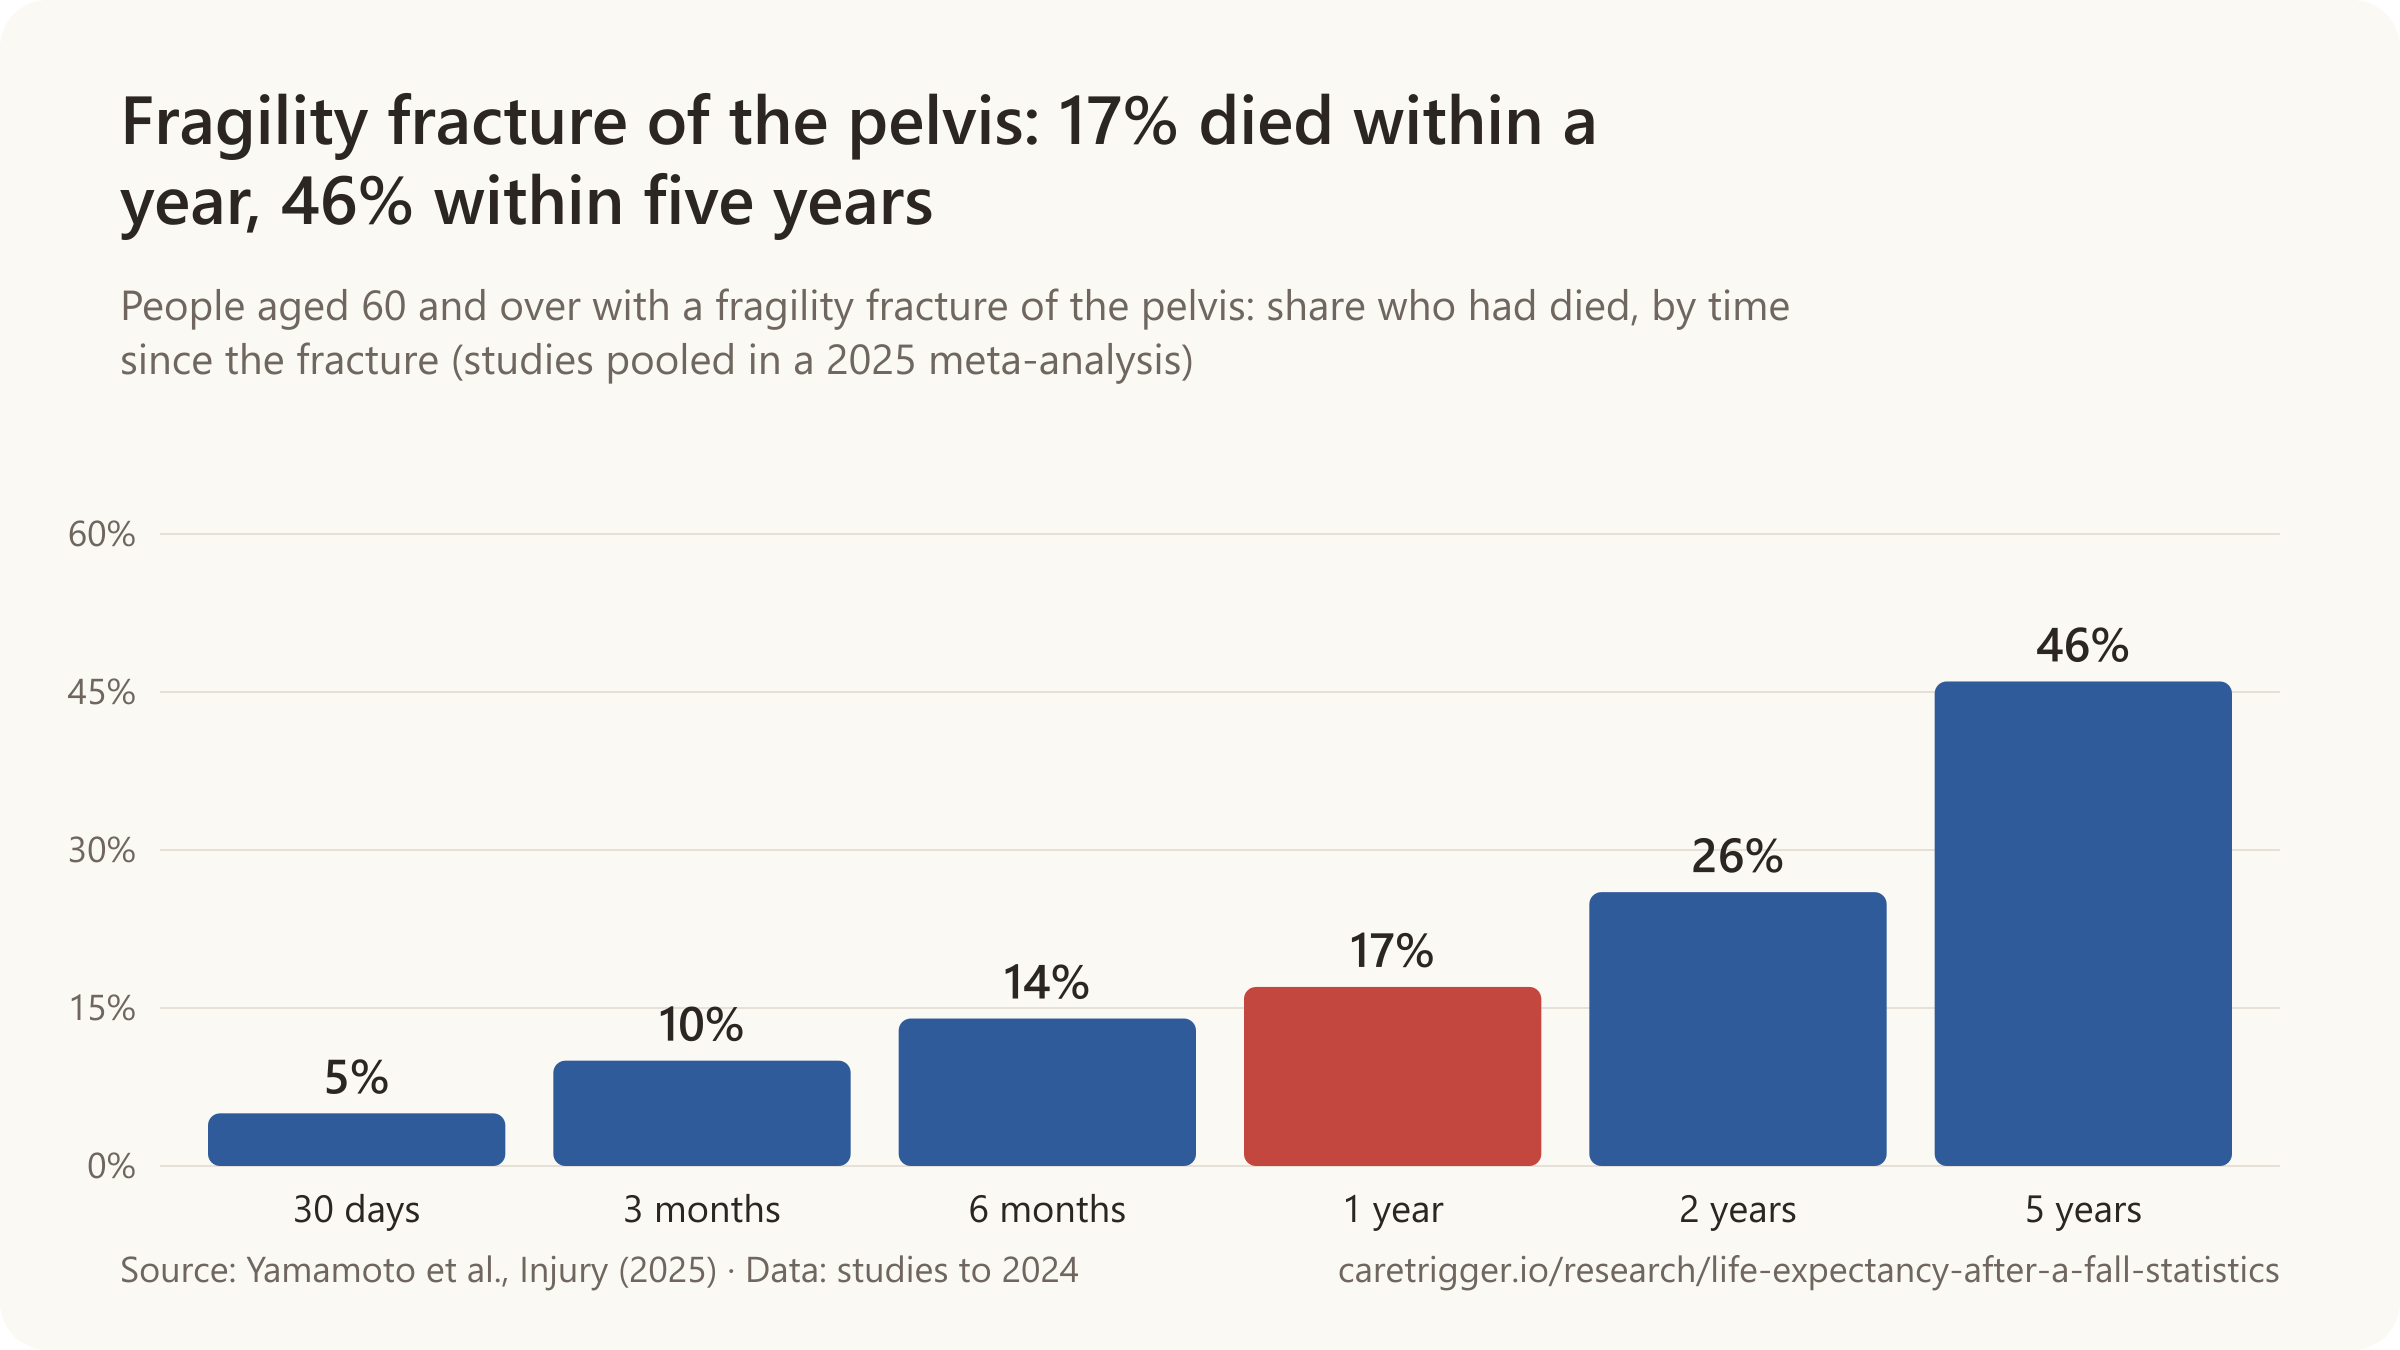
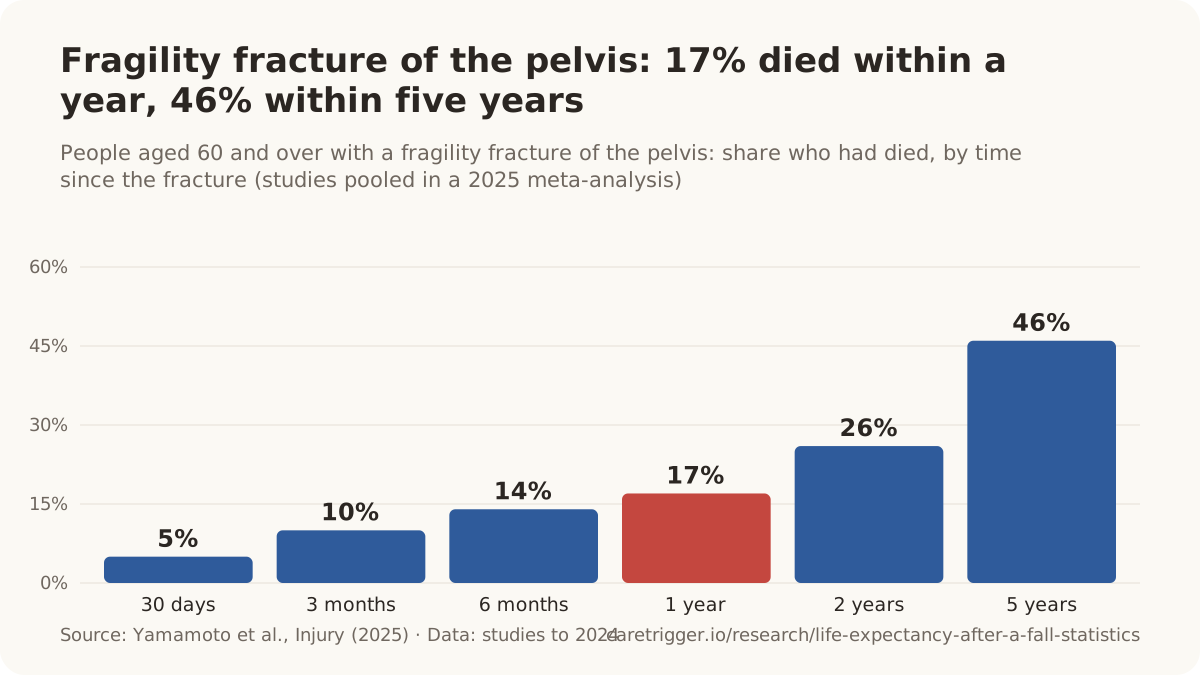
- In Sweden, 21% of adults 50 and older died within a year of a pelvic fracture, against 25% after a hip fracture (2001-2016).
- In Germany, 21% of people 60 and older died within a year of a first pelvic fracture, against 11% of same-age people without one (2008-2010).
- A pelvic fracture at 80 cost Danish men an estimated 3.1 years of life (2023).
- Of people over 60 with a low-energy pubic ramus fracture, 58.1% died within five years, against 31.3% expected (2000-2005).
- Only 38.1% of older patients with a fragility fracture of the pelvis walked as well as before a year later (2012-2019).
| Fracture and patients | Died within a year |
|---|---|
| Fragility fracture of the pelvis (22 studies pooled) | 15.5% |
| Low-energy pelvic ring fracture, 70 and older, no surgery | 20.9% |
| Low-energy pelvic ring fracture, 65 and older | 20.4% |
| Low-energy pelvic ring fracture, 60 and older, no surgery | 16.9% |
| Pelvic ring injury, 65 and older, admitted | 27% |
| Pelvic ring fracture, 65 and older, no surgery | 25.1% |
A fragility fracture of the pelvis is a break of the pelvic ring (often the pubic rami) from a fall from standing height. Pelvic fractures in road crashes are a different injury, with different numbers.
Sources: Injury; Acta Orthopaedica; Journal of Bone and Mineral Research; eLife; Canadian Journal of Surgery; European Journal of Trauma and Emergency Surgery; EFORT Open Reviews; BMC Geriatrics (2022, 2019); Archives of Osteoporosis; PLOS ONE; Cureus
More statistics (78)
17% of patients aged 60 and over with a fragility fracture of the pelvis died within a year, pooled across studies in a 2025 meta-analysis (Yamamoto et al., Injury, 2025).
Pelvic fractures from simple falls are becoming more common as populations age, and in older people they are about as dangerous as hip fractures: most are treated without surgery, but many patients do not walk as well again, and mortality over the following years is high.
Deaths after a fragility fracture of the pelvis
- 21% of Swedish adults aged 50 and over died within a year of a pelvic fracture (2001-2016), against 25% after a hip fracture (Lundin et al., Acta Orthopaedica, 2021).
- 21% of people aged 60 and over died within a year of a first pelvic fracture, against 11% of people of the same age and gender without one, in German health-insurance data for 2008-2010 (Andrich et al., Journal of Bone and Mineral Research, 2017).
- In the first four weeks after a pelvic fracture, people aged 60 and over had 3.9 times the risk of dying of matched people without a fracture; by weeks 49 to 52 the hazard ratio had fallen to 1.4 (Andrich et al., Journal of Bone and Mineral Research, 2017).
- Excess mortality after a pelvic fracture in people aged 60 and over lasted about eight months, even after adjustment for other illnesses, in German insurance data (Andrich et al., Journal of Bone and Mineral Research, 2017).
- In the first four weeks after a pelvic fracture, the adjusted risk of death was 3.8 times that of matched controls for men and 2.8 times for women aged 60 and over (Andrich et al., Journal of Bone and Mineral Research, 2017).
- 7.3% of patients aged 70 and over with a non-operatively treated low-energy pelvic ring fracture died within 30 days, and 11.4% within 90 days (Reito et al., BMC Geriatrics, 2019).
- 20.9% of patients aged 70 and over with a non-operatively treated low-energy pelvic ring fracture died within a year (Reito et al., BMC Geriatrics, 2019).
- Women aged 70 and over with a pelvic ring fracture had 8.5 times the 90-day mortality risk of the same-age general population, and men 11.0 times (Reito et al., BMC Geriatrics, 2019).
- Older patients with a pelvic ring fracture died at the same rate as same-age patients operated for a femoral neck (hip) fracture: the 90-day hazard ratio was 0.62 for women and 0.67 for men, neither significant (Reito et al., BMC Geriatrics, 2019).
- Over up to seven years, women aged 70 and over with a pelvic ring fracture had 2.62 times the mortality risk of the same-age general population, and men 3.46 times (Reito et al., BMC Geriatrics, 2019).
- 12.8% of patients aged 70 and over with a pelvic ring fracture were readmitted to hospital within 30 days (Reito et al., BMC Geriatrics, 2019).
- 20% of patients aged 65 and over admitted with a pelvic ring injury died within 30 days, 27% within a year and 41% within three years (Banierink et al., PLOS ONE, 2019).
- 27% of patients aged 65 and over admitted with a pelvic ring injury died within a year (Banierink et al., PLOS ONE, 2019).
- 41% of patients aged 65 and over admitted with a pelvic ring injury had died within three years (Banierink et al., PLOS ONE, 2019).
- In-hospital mortality after a pelvic ring fracture in patients aged 60 and over fell from 9.3% to 3.8% between 1991 and 2013 in the German Pelvic Trauma Registry (Rollmann et al., Geriatrics & Gerontology International, 2019).
- Women living in nursing homes had 1.83 times the risk of dying in the first month after a pelvic fracture compared with matched residents without one; for men the hazard ratio was 2.95 (Rapp et al., Osteoporosis International, 2010).
- 62.1% of patients aged 60 and over with a fragility fracture of the pelvis had died five years later, in a prospective German cohort (Lenz et al., European Journal of Trauma and Emergency Surgery, 2025).
- 25.1% of patients aged 65 and over treated without surgery for a pelvic ring fracture died within a year, and 13.4% within three months (Pekas et al., Cureus, 2026).
- Patients aged 65 and over with a nonoperatively managed pelvic ring fracture had three times the one-year mortality expected for people of the same age and gender (standardised mortality ratio 3.12) (Pekas et al., Cureus, 2026).
- 16.1% of trauma patients aged 60 and over with a pelvic or acetabular fracture died within 30 days, against 12.5% of those without one, in Sweden's national trauma registry 2022-2024 (Enocson et al., Archives of Orthopaedic and Trauma Surgery, 2026).
- A pelvic or acetabular fracture was associated with 1.28 times the odds of dying within 30 days in trauma patients aged 60 and over, after adjustment for injury severity, fitness and head injury (Enocson et al., Archives of Orthopaedic and Trauma Surgery, 2026).
- 34.0% of trauma patients aged 60 and over with a pelvic injury were discharged directly home, against 55.8% of those without one (Enocson et al., Archives of Orthopaedic and Trauma Surgery, 2026).
- 20.4% of patients aged 65 and over with a low-energy pelvic ring fracture died within a year, against 14% of those with a low-energy acetabular fracture (Desmet et al., Archives of Osteoporosis, 2024).
- 5.3% of patients aged 65 and over admitted with a pelvic fracture died in hospital in the Netherlands (2008-2012), against 4.8% of younger patients who were far more severely injured (Verbeek et al., European Journal of Orthopaedic Surgery & Traumatology, 2018).
- Age 65 and over was the strongest predictor of in-hospital death after a pelvic fracture in the Netherlands, with 6.59 times the odds of younger patients (Verbeek et al., European Journal of Orthopaedic Surgery & Traumatology, 2018).
- 18.6% of patients aged 65 and over with a high-energy pelvic fracture died in hospital, three times the rate of matched younger patients (5.7%), but only 5.3% of those discharged died within the next year (Keil et al., Journal of Orthopaedic Trauma, 2018).
- 12.3% of trauma patients aged 55 and over with a pelvic fracture died, against 2.3% of younger patients with similar injury severity; age was the only predictor of death (O'Brien et al., Surgery, 2002).
- 16.9% of patients aged 60 and over (mean age 83.7) treated without surgery for a low-energy pelvic ring fracture died within a year, though only 0.7% died in hospital (Ramser et al., BMC Geriatrics, 2022).
- 5% of patients aged 60 and over with a fragility fracture of the pelvis died within 30 days, pooled across studies (Yamamoto et al., Injury, 2025).
- 10% of patients aged 60 and over with a fragility fracture of the pelvis died within three months, pooled across studies (Yamamoto et al., Injury, 2025).
- 14% of patients aged 60 and over with a fragility fracture of the pelvis died within six months, pooled across studies (Yamamoto et al., Injury, 2025).
- 26% of patients aged 60 and over with a fragility fracture of the pelvis died within two years, pooled across studies (Yamamoto et al., Injury, 2025).
- 46% of patients aged 60 and over with a fragility fracture of the pelvis died within five years, pooled across studies in a 2025 meta-analysis (Yamamoto et al., Injury, 2025).
- 15.5% of patients with a fragility fracture of the pelvis died within a year, pooled across 22 studies of 3,265 patients (Tran et al., EFORT Open Reviews, 2025).
- One-year mortality after a fragility fracture of the pelvis was highest for FFP type III, at 17.0%, and lowest for type IV, at 7.5%, pooled across 22 studies (Tran et al., EFORT Open Reviews, 2025).
- In-hospital mortality after a pelvic ring fracture in the United States fell from 4.2% to 2.8% between 1990 and 2007, while incidence rose from 27.24 to 34.30 per 100,000 (Buller et al., Geriatric Orthopaedic Surgery & Rehabilitation, 2016).
- 30-day in-hospital survival after an isolated pelvic fracture in Japan rose from 77% (2004-2008) to 86% (2009-2013) and 91% (2014-2018) (Otake et al., Journal of Nippon Medical School, 2022).
- One-year mortality after a pelvic or acetabular fracture in South Koreans aged 50 and over fell from 7.29% in 2006 to 4.59% in 2022, while annual cases tripled from 11,607 to 35,691 (Yoon et al., Archives of Osteoporosis, 2025).
- Trauma patients aged 80 and over with a pelvic fracture had 4.7 times the odds of dying of adults aged 18-65, and those aged 65-79 had 1.81 times the odds (Matityahu et al., Journal of Osteoporosis, 2012).
- 18.0% of adults aged 66+ (1,298 of 7,209) died within a year of a fragility fracture of the pelvis in Ontario (2011-2015), against 5.3% in the whole matched group without a fracture (Brown et al., BMC Musculoskeletal Disorders, 2021).
Pubic ramus fractures
- 58.1% of patients over 60 with an isolated low-energy pubic ramus (pelvic) fracture died within five years, against an expected 31.3% for people of the same age and gender; one-year mortality was 16.3% vs 6.6% (Hamilton et al., Canadian Journal of Surgery, 2019).
- 36% of older patients with a low-energy pubic ramus fracture permanently needed more walking aids afterwards, and 20% a permanently higher level of everyday care (Hamilton et al., Canadian Journal of Surgery, 2019).
- 14.3% of patients aged 65 and over admitted to geriatric care with a pelvic insufficiency (fragility) fracture died within a year (Taillandier et al., Joint Bone Spine, 2003).
- At hospital discharge, 50% of older patients with a pelvic insufficiency fracture had not regained their former self-sufficiency and 25% had to move into an institution (Taillandier et al., Joint Bone Spine, 2003).
- 45.6% of patients with a pubic ramus (pelvic) fracture were alive five years later and 86.7% after one year, a worse survival than people of the same age (Hill et al., Journal of Bone and Joint Surgery, 2001).
- Patients with a pubic ramus fracture survived better than hip fracture patients in the first year, but had higher mortality later, and by five years survival in the two groups did not differ (Hill et al., Journal of Bone and Joint Surgery, 2001).
- 25.6 per 100,000 people over 60 had a pubic ramus fracture each year in Edinburgh, women 4.2 times as often as men (Hill et al., Journal of Bone and Joint Surgery, 2001).
- 93.8% of patients over 60 admitted with an isolated pubic ramus (pelvic) fracture had died within 10 years, 64.4% within five years and 24.7% within one year, significantly more than matched controls (van Dijk et al., Injury, 2010).
- 33% of patients over 60 admitted with an isolated pubic ramus fracture went into a nursing home temporarily or permanently because they could not move about independently (van Dijk et al., Injury, 2010).
Years of life lost
- Danish men who had a pelvic fracture at age 80 lost an estimated 3.1 years of life on average compared with men of the same age and comorbidity without a fracture (a 'skeletal age' of 83.1) (Tran et al., eLife, 2023).
- Danish men who had a pelvic fracture at age 70 lost an estimated 4.3 years of life on average compared with men of the same age and comorbidity without a fracture (a 'skeletal age' of 74.3) (Tran et al., eLife, 2023).
- Danish men who had a pelvic fracture at age 90 lost an estimated 2.0 years of life on average compared with men of the same age and comorbidity without a fracture (a 'skeletal age' of 92) (Tran et al., eLife, 2023).
- Danish women who had a pelvic fracture at age 70 lost an estimated 3.5 years of life on average compared with women of the same age and comorbidity without a fracture (a 'skeletal age' of 73.5) (Tran et al., eLife, 2023).
- Danish women who had a pelvic fracture at age 80 lost an estimated 2.6 years of life on average compared with women of the same age and comorbidity without a fracture (a 'skeletal age' of 82.6) (Tran et al., eLife, 2023).
- Danish women who had a pelvic fracture at age 90 lost an estimated 1.7 years of life on average compared with women of the same age and comorbidity without a fracture (a 'skeletal age' of 91.7) (Tran et al., eLife, 2023).
Acetabular fractures
- 25.0% of patients aged 60 and over with a low-energy fragility fracture of the acetabulum (hip socket) died within a year, and 35.8% within two years (Wollmerstädt et al., BMC Geriatrics, 2020).
- 56.3% of patients aged 60 and over with a fragility fracture of the acetabulum had died after a mean follow-up of 68 months (Wollmerstädt et al., BMC Geriatrics, 2020).
- 18% of matched older patients operated for an acetabular fracture died within a year, half the rate after surgery for a proximal femoral (hip) fracture (36%) (Stetzelberger et al., Journal of Bone and Joint Surgery, 2021).
- Patients aged 60 and over operated for an acetabular fracture had 1.89 times the adjusted odds of dying within 30 days of matched hip fracture patients (crude 6.6% vs 4.6%) (Khoshbin et al., Journal of Orthopaedic Trauma, 2020).
- 8.1% of patients aged 60 and over with an isolated acetabular fracture died within a year (2.3% within 30 days) (Bible et al., Journal of Orthopaedic Trauma, 2014).
- 16% of patients aged 60 and over with an acetabular fracture died within a year, in a study of 454 patients at three US trauma centres (Gary et al., Journal of Orthopaedic Trauma, 2015).
- 14% of patients aged 65 and over with a low-energy acetabular fracture died within a year (Desmet et al., Archives of Osteoporosis, 2024).
How common pelvic fractures are
- 22.4 per 10,000 people aged 60 and over had a first pelvic fracture each year in Germany (2008-2011), counting outpatient-treated fractures, with women at 2.38 times the risk of men (Andrich et al., PLOS ONE, 2015).
- 57.9 per 100,000 people aged 65 and over were admitted with a pelvic fracture each year in the Netherlands (2008-2012), against 6.4 per 100,000 younger people (Verbeek et al., European Journal of Orthopaedic Surgery & Traumatology, 2018).
- The incidence of pelvic and acetabular fractures in Swedish adults rose from 64 to 80 per 100,000 person-years between 2001 and 2016 (Lundin et al., Injury, 2021).
- Only 2.0% of Swedish adults with a pelvic fracture were treated surgically, against 15% of those with an acetabular fracture (Lundin et al., Injury, 2021).
- Hospitalisations for a pelvic fracture in Finnish adults rose from 34 to 56 per 100,000 person-years between 1997 and 2014, mostly low-energy fragility fractures in older women (Rinne et al., Acta Orthopaedica, 2020).
- The incidence of pelvic fractures in people aged 65 and over in Edinburgh rose from 7.9 to 13.1 per 100,000 over 15 years; 84% were fragility fractures of the pubic rami (Clement and Court-Brown, European Journal of Orthopaedic Surgery & Traumatology, 2014).
- The incidence of pelvic and acetabular fractures in Belgium rose from 15.8 per 100,000 people a year in 1988 to 37.6 in 2018, mostly in older adults (Herteleer et al., Bone, 2021).
- Pelvic and acetabular fractures in South Koreans aged 50 and over rose from 11,607 in 2006 to 35,691 in 2022, with the steepest increase at ages 80-89 (Yoon et al., Archives of Osteoporosis, 2025).
- Between 2001 and 2016 the incidence of pelvic fractures in Swedish adults rose by 25% (64 to 80 per 100,000) while hip fracture incidence fell by 18% (280 to 229 per 100,000) (Lundin et al., Acta Orthopaedica, 2021).
- The annual number of pelvic fractures in Swedish adults rose by 42%, from 4,472 to 6,333, between 2001 and 2016, the only one of four pelvic and femur fracture types to rise sharply (Lundin et al., Acta Orthopaedica, 2021).
High-energy pelvic injuries
- 37% of trauma patients over 60 with a pelvic fracture died, against 8% of younger patients, although the older patients had less severe injuries (Chong et al., Iowa Orthopaedic Journal, 1997).
- Of trauma patients who died with a pelvic fracture, about one-third died directly from the pelvic injury, one-third from its complications and one-third from other causes (Chong et al., Iowa Orthopaedic Journal, 1997).
Other studies
- Men had 3.18 times the odds of women of dying within a year of a low-energy pelvic ring fracture at age 65 and over, after adjustment (Desmet et al., Archives of Osteoporosis, 2024).
- Only 38.1% of older patients with a fragility fracture of the pelvis followed for a year regained their pre-injury walking ability, and 39.8% their standing ability (Yoshida et al., European Journal of Trauma and Emergency Surgery, 2021).
- 6.7% of Japanese patients with a fragility fracture of the pelvis (mean age 82.5) who could be followed for a year had died by then (Yoshida et al., European Journal of Trauma and Emergency Surgery, 2021).
Sources: Injury (2010, 2021, 2025); Acta Orthopaedica (2020, 2021); Journal of Bone and Mineral Research; BMC Geriatrics (2019, 2020, 2022); PLOS ONE (2015, 2019); Geriatrics & Gerontology International; Osteoporosis International; European Journal of Trauma and Emergency Surgery (2020, 2025); Cureus; Archives of Orthopaedic and Trauma Surgery; Archives of Osteoporosis (2024, 2025); European Journal of Orthopaedic Surgery & Traumatology (2014, 2017); Journal of Orthopaedic Trauma (2014-2020); Surgery; EFORT Open Reviews; Geriatric Orthopaedic Surgery & Rehabilitation; Journal of Nippon Medical School; Journal of Osteoporosis; BMC Musculoskeletal Disorders; Canadian Journal of Surgery; Joint Bone Spine; Journal of Bone and Joint Surgery (2001, 2021); eLife; Bone; Iowa Orthopaedic Journal
09 / Femur
What percentage of femur breaks are fatal?
In Sweden, 21% of people 65 and older died within a year of a femoral shaft or distal femur fracture (Acta Orthopaedica, 2021).

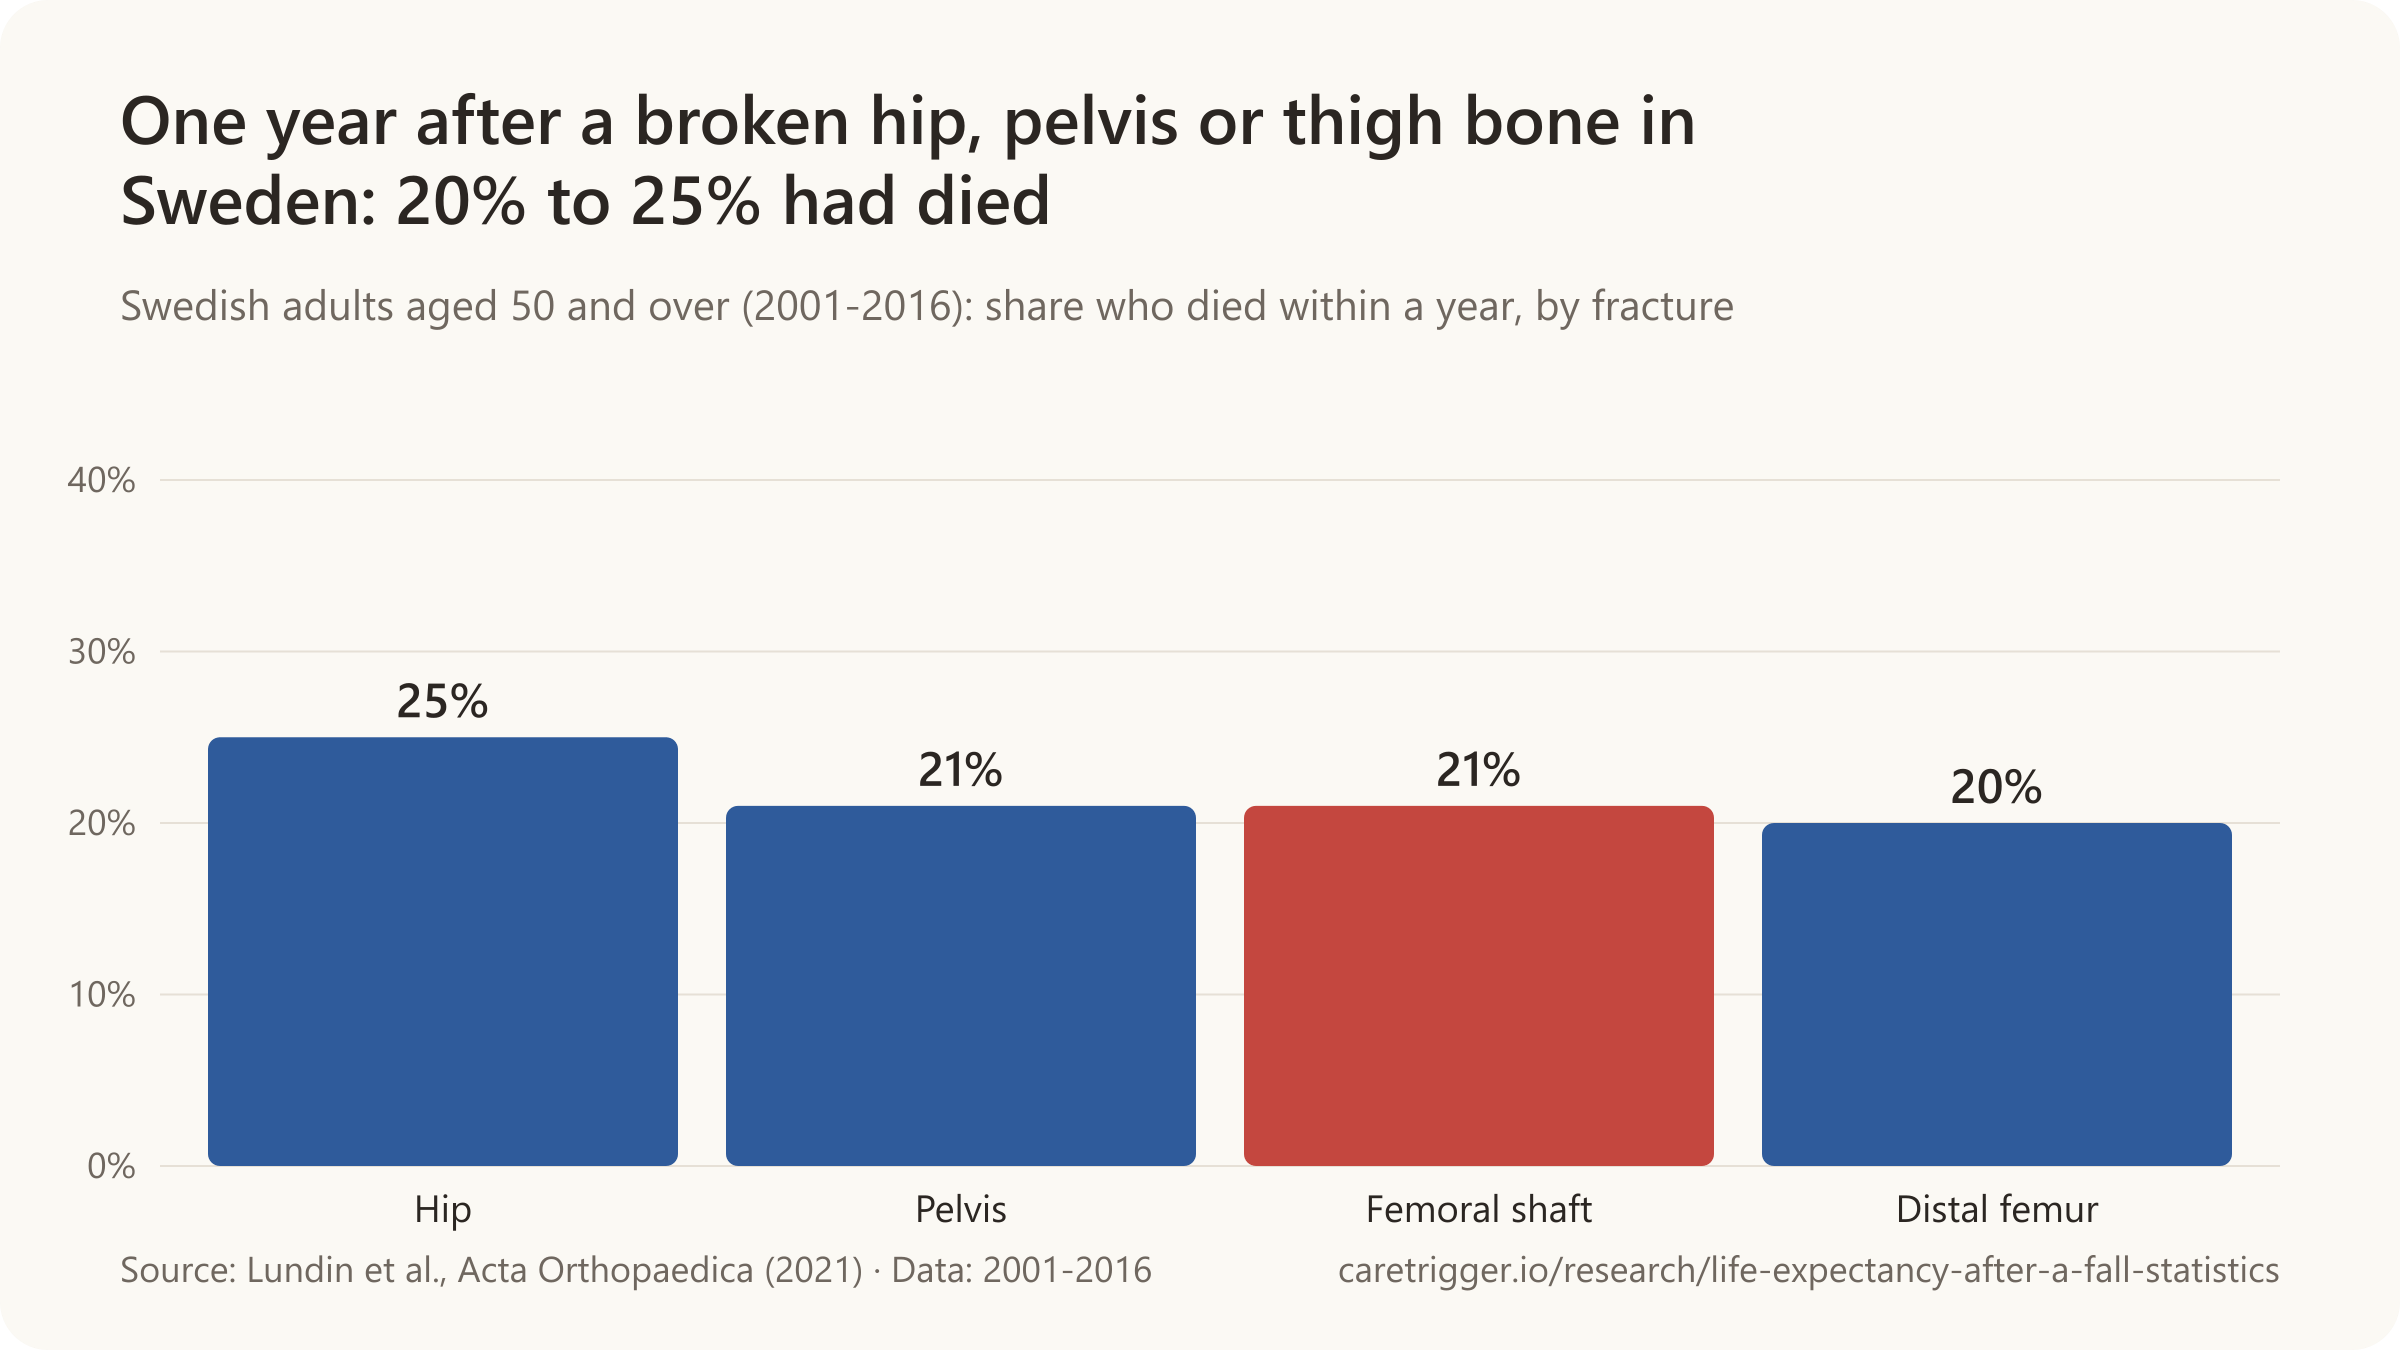
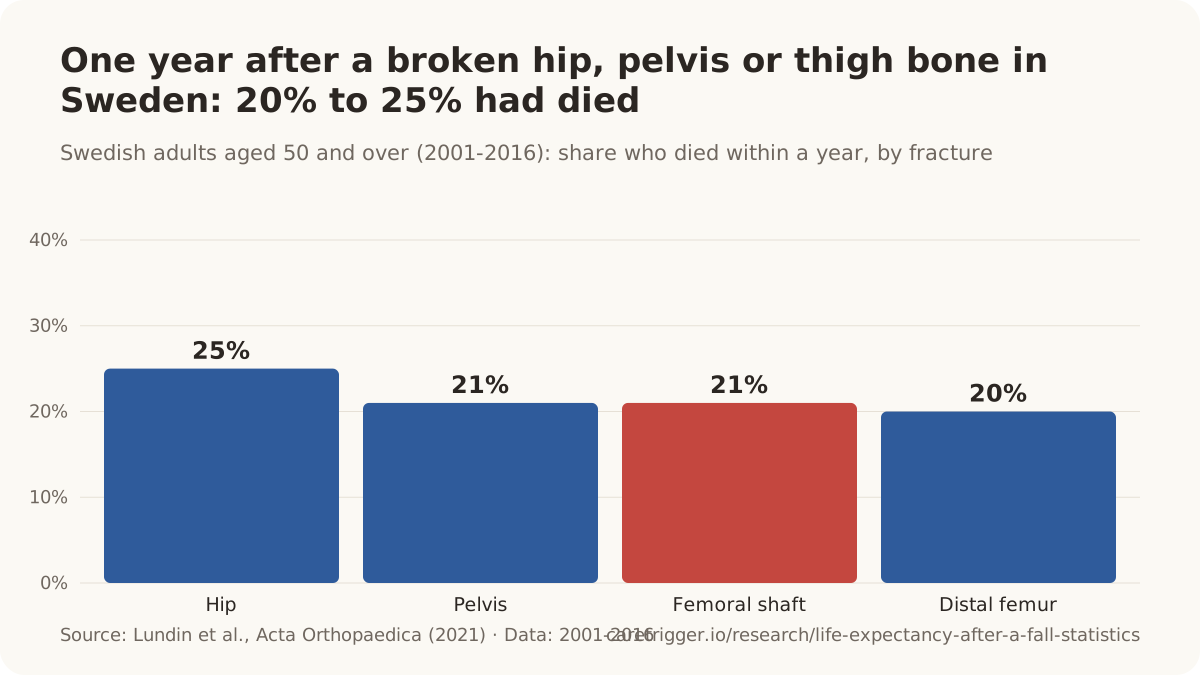
- Across ten studies, 26.1% of older patients with a distal femur fracture died within a year (2024).
- In Denmark, 29% of people 65 and older died within a year of an operated thigh-bone fracture, hip fractures included (1998-2017).
- Of US Medicare patients with a femoral shaft fracture, 58.5% died within five years (2009-2019).
- In a small Colombian study, median survival after surgery for a distal femur fracture at 65 and older was 3.2 years (2014-2020).
- 93% of thigh-bone fractures in Swedes 65 and older came from a fall on level ground (2011-2014).
| Patients and place | Died within a year |
|---|---|
| Distal femur, 60 and older, Sweden | 21% |
| Distal femur, over 60, operated (US) | 25% |
| Distal femur, over 60, operated (US) | 25% |
| Distal femur, over 60 (Denmark) | 35% |
| Distal femur, 70 and older, Victoria (Australia) | 29.8% |
| Distal femur, mean age 76, operated (US) | 13.4% |
| Distal femur, 65 and older, first fracture (US database) | 9.4% |
The femur is the thigh bone. A break at its top, the femoral neck, is a hip fracture; this section is about breaks below it, in the shaft and just above the knee (distal femur).
Sources: Acta Orthopaedica (2022, 2021, 2020); Journal of Clinical Orthopaedics and Trauma; Injury (2026, 2025, 2023, 2016); International Orthopaedics (2024, 2019); Clinical Orthopaedics and Related Research; Journal of Orthopaedic Trauma (2023, 2018)
More statistics (55)
21% of Swedish patients aged 65 and over died within a year of a femoral shaft fracture, and 21% after a distal femur fracture, against 26% after a hip (proximal femur) fracture (Wolf et al., Acta Orthopaedica, 2021).
Breaks of the thigh bone below the hip are less common than hip fractures but, in older people, nearly as dangerous: most come from a fall on level ground, and one-year mortality is close to that after a hip fracture. Fractures around a hip or knee replacement (periprosthetic fractures) are a growing share.
Compared with a hip fracture
- 29% of people aged 65+ in Denmark died within a year of an operated femoral fracture (thigh bone, including the hip) (1998-2017) (Larsen et al., Injury, 2025).
- 93% of femoral fractures in Swedes aged 65 and over were caused by a fall on the same level (Wolf et al., Acta Orthopaedica, 2021).
- One-year mortality after a native distal femur fracture (23%) matched that after a hip fracture in age- and gender-matched patients (22%) (Streubel et al., Clinical Orthopaedics and Related Research, 2011).
- 16.2% of patients aged 65 and over operated for a distal femur fracture died within 30 days, twice the rate after a proximal femoral (hip) fracture (7.7%); at one year the gap (35.6% vs 27.4%) was not significant (Briz et al., Geriatric Orthopaedic Surgery & Rehabilitation, 2026).
- 8.3% of Swedish patients aged 65 and over died within 30 days of a femoral shaft fracture, 6.3% after a distal femur fracture and 7.5% after a hip fracture (Wolf et al., Acta Orthopaedica, 2021).
- Older patients with a femur fracture below the hip had a 90-day risk of death similar to hip fracture patients after adjustment (relative risk 1.1 for distal and 0.97 for shaft fractures) (Wolf et al., Acta Orthopaedica, 2021).
- 25% of Swedish adults aged 50 and over died within a year of a hip fracture (2001-2016), the highest of the four pelvic and femur fracture types compared (Lundin et al., Acta Orthopaedica, 2021).
- 21% of Swedish adults aged 50 and over died within a year of a femoral shaft fracture, and 20% after a distal femur fracture (2001-2016) (Lundin et al., Acta Orthopaedica, 2021).
- 20% of Swedish adults aged 50 and over died within a year of a distal femur fracture (2001-2016) (Lundin et al., Acta Orthopaedica, 2021).
- Among Swedish men aged 50 and over, one-year mortality was 32% after a hip fracture, 25% after a pelvic fracture, 23% after a femoral shaft fracture and 16% after a distal femur fracture (Lundin et al., Acta Orthopaedica, 2021).
- Among Swedish women aged 50 and over, one-year mortality was 20% after a pelvic fracture, 22% after a hip fracture, 21% after a femoral shaft fracture and 21% after a distal femur fracture (Lundin et al., Acta Orthopaedica, 2021).
- 10% of people aged 65+ in Denmark died within 30 days of an operated femoral fracture (thigh bone, including the hip) (1998-2017) (Larsen et al., Injury, 2025).
- Thirty-day mortality after an operated femoral fracture was similar, 8% to 11%, wherever the break was along the thigh bone, from the hip to the knee (people aged 65+, Denmark, 1998-2017) (Larsen et al., Injury, 2025).
- 15% of men aged 65+ in Denmark died within 30 days of an operated femoral fracture (thigh bone, including the hip) (1998-2017) (Larsen et al., Injury, 2025).
- 37% of men aged 65+ in Denmark died within a year of an operated femoral fracture (thigh bone, including the hip) (1998-2017) (Larsen et al., Injury, 2025).
- 8.2% of women aged 65+ in Denmark died within 30 days of an operated femoral fracture (thigh bone, including the hip) (1998-2017) (Larsen et al., Injury, 2025).
- 26% of women aged 65+ in Denmark died within a year of an operated femoral fracture (thigh bone, including the hip) (1998-2017) (Larsen et al., Injury, 2025).
Distal femur (above the knee)
- 26.1% of older patients with a native distal femur fracture died within a year, pooled across ten studies in the first meta-analysis on the question (Chuluunbaatar et al., Journal of Clinical Orthopaedics and Trauma, 2024).
- The median survival of patients aged 65 and over (mean 83.6) after surgery for a distal femur fracture was 3.2 years, and 27% were alive at five years, in a small Colombian cohort (Delgadillo et al., International Orthopaedics, 2024).
- 25% of patients over 60 operated for a low-energy distal femur fracture died within a year, 18% within six months and 6% within 30 days (Streubel et al., Clinical Orthopaedics and Related Research, 2011).
- Older patients whose distal femur fracture was operated more than four days after admission had higher six-month and one-year mortality than those operated within two days (Streubel et al., Clinical Orthopaedics and Related Research, 2011).
- 13.4% of older patients (mean age 76) operated for a distal femur fracture died within a year; mortality was higher when surgery came more than two days after injury (Myers et al., Journal of Orthopaedic Trauma, 2018).
- 35% of patients over 60 with a non-periprosthetic distal femur fracture died within a year (8% within 30 days, 26% within six months), against 3% of younger patients (Larsen et al., International Orthopaedics, 2020).
- Men were 2.6 times as likely as women to die within a year of a distal femur fracture, and patients treated without surgery 2.8 times as likely as those operated (Larsen et al., International Orthopaedics, 2020).
- 25% of patients over 60 operated for a low-energy distal femur fracture (44 of 176) had died a year later, and 82% were discharged to a skilled nursing facility (Moloney et al., Injury, 2016).
- 82% of patients over 60 operated for a low-energy distal femur fracture were discharged to a skilled nursing facility, after an average stay of 10 days (Moloney et al., Injury, 2016).
- 8.14% of older patients with a native distal femur fracture died within 30 days, pooled across eight studies (Chuluunbaatar et al., Journal of Clinical Orthopaedics and Trauma, 2024).
- 19.5% of older patients with a native distal femur fracture died within six months, pooled across studies (Chuluunbaatar et al., Journal of Clinical Orthopaedics and Trauma, 2024).
- Published one-year mortality after a distal femur fracture ranges from 10% to 38%, depending on age, injury energy and whether the fracture is around an implant (Chuluunbaatar et al., Journal of Clinical Orthopaedics and Trauma, 2024).
- 21% of Swedish patients aged 60 and over with a distal femur fracture died within a year and 11% within 90 days; 75% of the fractures came from a simple fall (Hernefalk et al., Acta Orthopaedica, 2022).
- 75% of distal femur fractures in Swedes aged 60 and over were caused by a simple fall (Hernefalk et al., Acta Orthopaedica, 2022).
- Patients aged 60 and over whose distal femur fracture was around a knee replacement had a lower risk of death than those with a native fracture (HR 0.82) (Hernefalk et al., Acta Orthopaedica, 2022).
- 2.94% of patients over 60 who had surgery for a distal femur fracture died in hospital (5 of 170) in a Taiwanese cohort (Cheng et al., SICOT-J, 2023).
- 34% of patients aged 65 and over died within a year of surgery for a distal femur fracture (8.6% within 30 days, 23% within six months) (Delgadillo et al., International Orthopaedics, 2024).
- 29.8% of adults aged 70 and over with a distal femur fracture died within 12 months, with no difference between native and periprosthetic fractures, in Australia's Victorian trauma registry (Mather et al., Journal of Orthopaedic Trauma, 2023).
- 9.4% of US patients aged 65+ died within a year of a first distal femur fracture (thigh bone above the knee), 2.71 times the rate in matched people without a fracture (TriNetX, 2004-2024) (Ghafarian et al., Injury, 2026).
Femoral shaft
- 58.5% of US Medicare patients with a femoral shaft fracture died within five years (2009-2019) (Walter et al., Injury, 2023).
- 40.8 per 100,000 US Medicare beneficiaries had a femoral shaft fracture in 2019, 12.07% fewer than in 2009 (Walter et al., Injury, 2023).
- 18.2% of patients aged 60 to 90 operated for an isolated femoral shaft fracture, mostly from low-energy falls, had died by a mean follow-up of 24 weeks; two-thirds had at least one complication (Lutnick et al., American Journal of Surgery, 2026).
- Two-thirds of older patients operated for an isolated femoral shaft fracture had at least one complication, and 23.2% needed another operation (Lutnick et al., American Journal of Surgery, 2026).
- 2.1% of patients aged 65 and over operated for a femoral shaft fracture died in hospital, and 33.9% were discharged home, in Japan's national inpatient database (2014-2023) (Gondo et al., European Journal of Trauma and Emergency Surgery, 2026).
- 33.9% of patients aged 65 and over operated for a femoral shaft fracture in Japan were discharged home (Gondo et al., European Journal of Trauma and Emergency Surgery, 2026).
- 50% of femoral shaft fractures in Sweden (1998-2004) were caused by falls on the same level, with the median age of women patients 79 (Weiss et al., Injury, 2009).
- 20.2% of adults aged 66+ (530 of 2,618) died within a year of a fragility fracture of the femur (other than the hip) in Ontario (2011-2015), against 5.3% in the whole matched group without a fracture (Brown et al., BMC Musculoskeletal Disorders, 2021).
Around a hip or knee replacement
- 11% of patients operated for a periprosthetic femoral fracture died within a year, against 16.5% of matched hip fracture patients and 2.9% of matched joint replacement patients (Bhattacharyya et al., Journal of Bone and Joint Surgery, 2007).
- For periprosthetic femoral fractures, a delay of more than two days from admission to surgery was associated with higher one-year mortality (Bhattacharyya et al., Journal of Bone and Joint Surgery, 2007).
- 13.4% of patients with a periprosthetic femoral fracture after hip replacement died within a year, and 3.3% within 30 days, pooled across 35 cohort studies of 4,841 patients (Lamb et al., Journal of Arthroplasty, 2022).
- 3.3% of patients with a periprosthetic femoral fracture after hip replacement died within 30 days, similar to a broken hip (Lamb et al., Journal of Arthroplasty, 2022).
Years of life lost
- Danish men who had a femur (thigh bone, non-hip) fracture at age 70 lost an estimated 4.7 years of life on average compared with men of the same age and comorbidity without a fracture (a 'skeletal age' of 74.7) (Tran et al., eLife, 2023).
- Danish men who had a femur (thigh bone, non-hip) fracture at age 80 lost an estimated 3.3 years of life on average compared with men of the same age and comorbidity without a fracture (a 'skeletal age' of 83.3) (Tran et al., eLife, 2023).
- Danish men who had a femur (thigh bone, non-hip) fracture at age 90 lost an estimated 2.1 years of life on average compared with men of the same age and comorbidity without a fracture (a 'skeletal age' of 92.1) (Tran et al., eLife, 2023).
- Danish women who had a femur (thigh bone, non-hip) fracture at age 70 lost an estimated 4.2 years of life on average compared with women of the same age and comorbidity without a fracture (a 'skeletal age' of 74.2) (Tran et al., eLife, 2023).
- Danish women who had a femur (thigh bone, non-hip) fracture at age 80 lost an estimated 3.2 years of life on average compared with women of the same age and comorbidity without a fracture (a 'skeletal age' of 83.2) (Tran et al., eLife, 2023).
- Danish women who had a femur (thigh bone, non-hip) fracture at age 90 lost an estimated 2.0 years of life on average compared with women of the same age and comorbidity without a fracture (a 'skeletal age' of 92) (Tran et al., eLife, 2023).
A number we will not publish. "A broken femur has a 30% death rate" circulates in a video title without a source. The nearest primary figure is Denmark's 29% one-year mortality after an operated thigh-bone fracture, and that count includes hip fractures; below the hip, one-year mortality was 20% to 21% in Sweden.
Sources: Acta Orthopaedica (2020, 2021, 2022); Injury (2009-2026); Clinical Orthopaedics and Related Research; Geriatric Orthopaedic Surgery & Rehabilitation; Journal of Clinical Orthopaedics and Trauma; International Orthopaedics (2019, 2024); Journal of Orthopaedic Trauma (2018, 2023); SICOT-J; American Journal of Surgery; European Journal of Trauma and Emergency Surgery; BMC Musculoskeletal Disorders; Journal of Bone and Joint Surgery; Journal of Arthroplasty; eLife
10 / Spine
What is the life expectancy after a spinal compression fracture?
Of US Medicare patients with a new spinal compression fracture, 30.9% were alive five years later (Journal of Bone and Joint Surgery, 1997-2004).

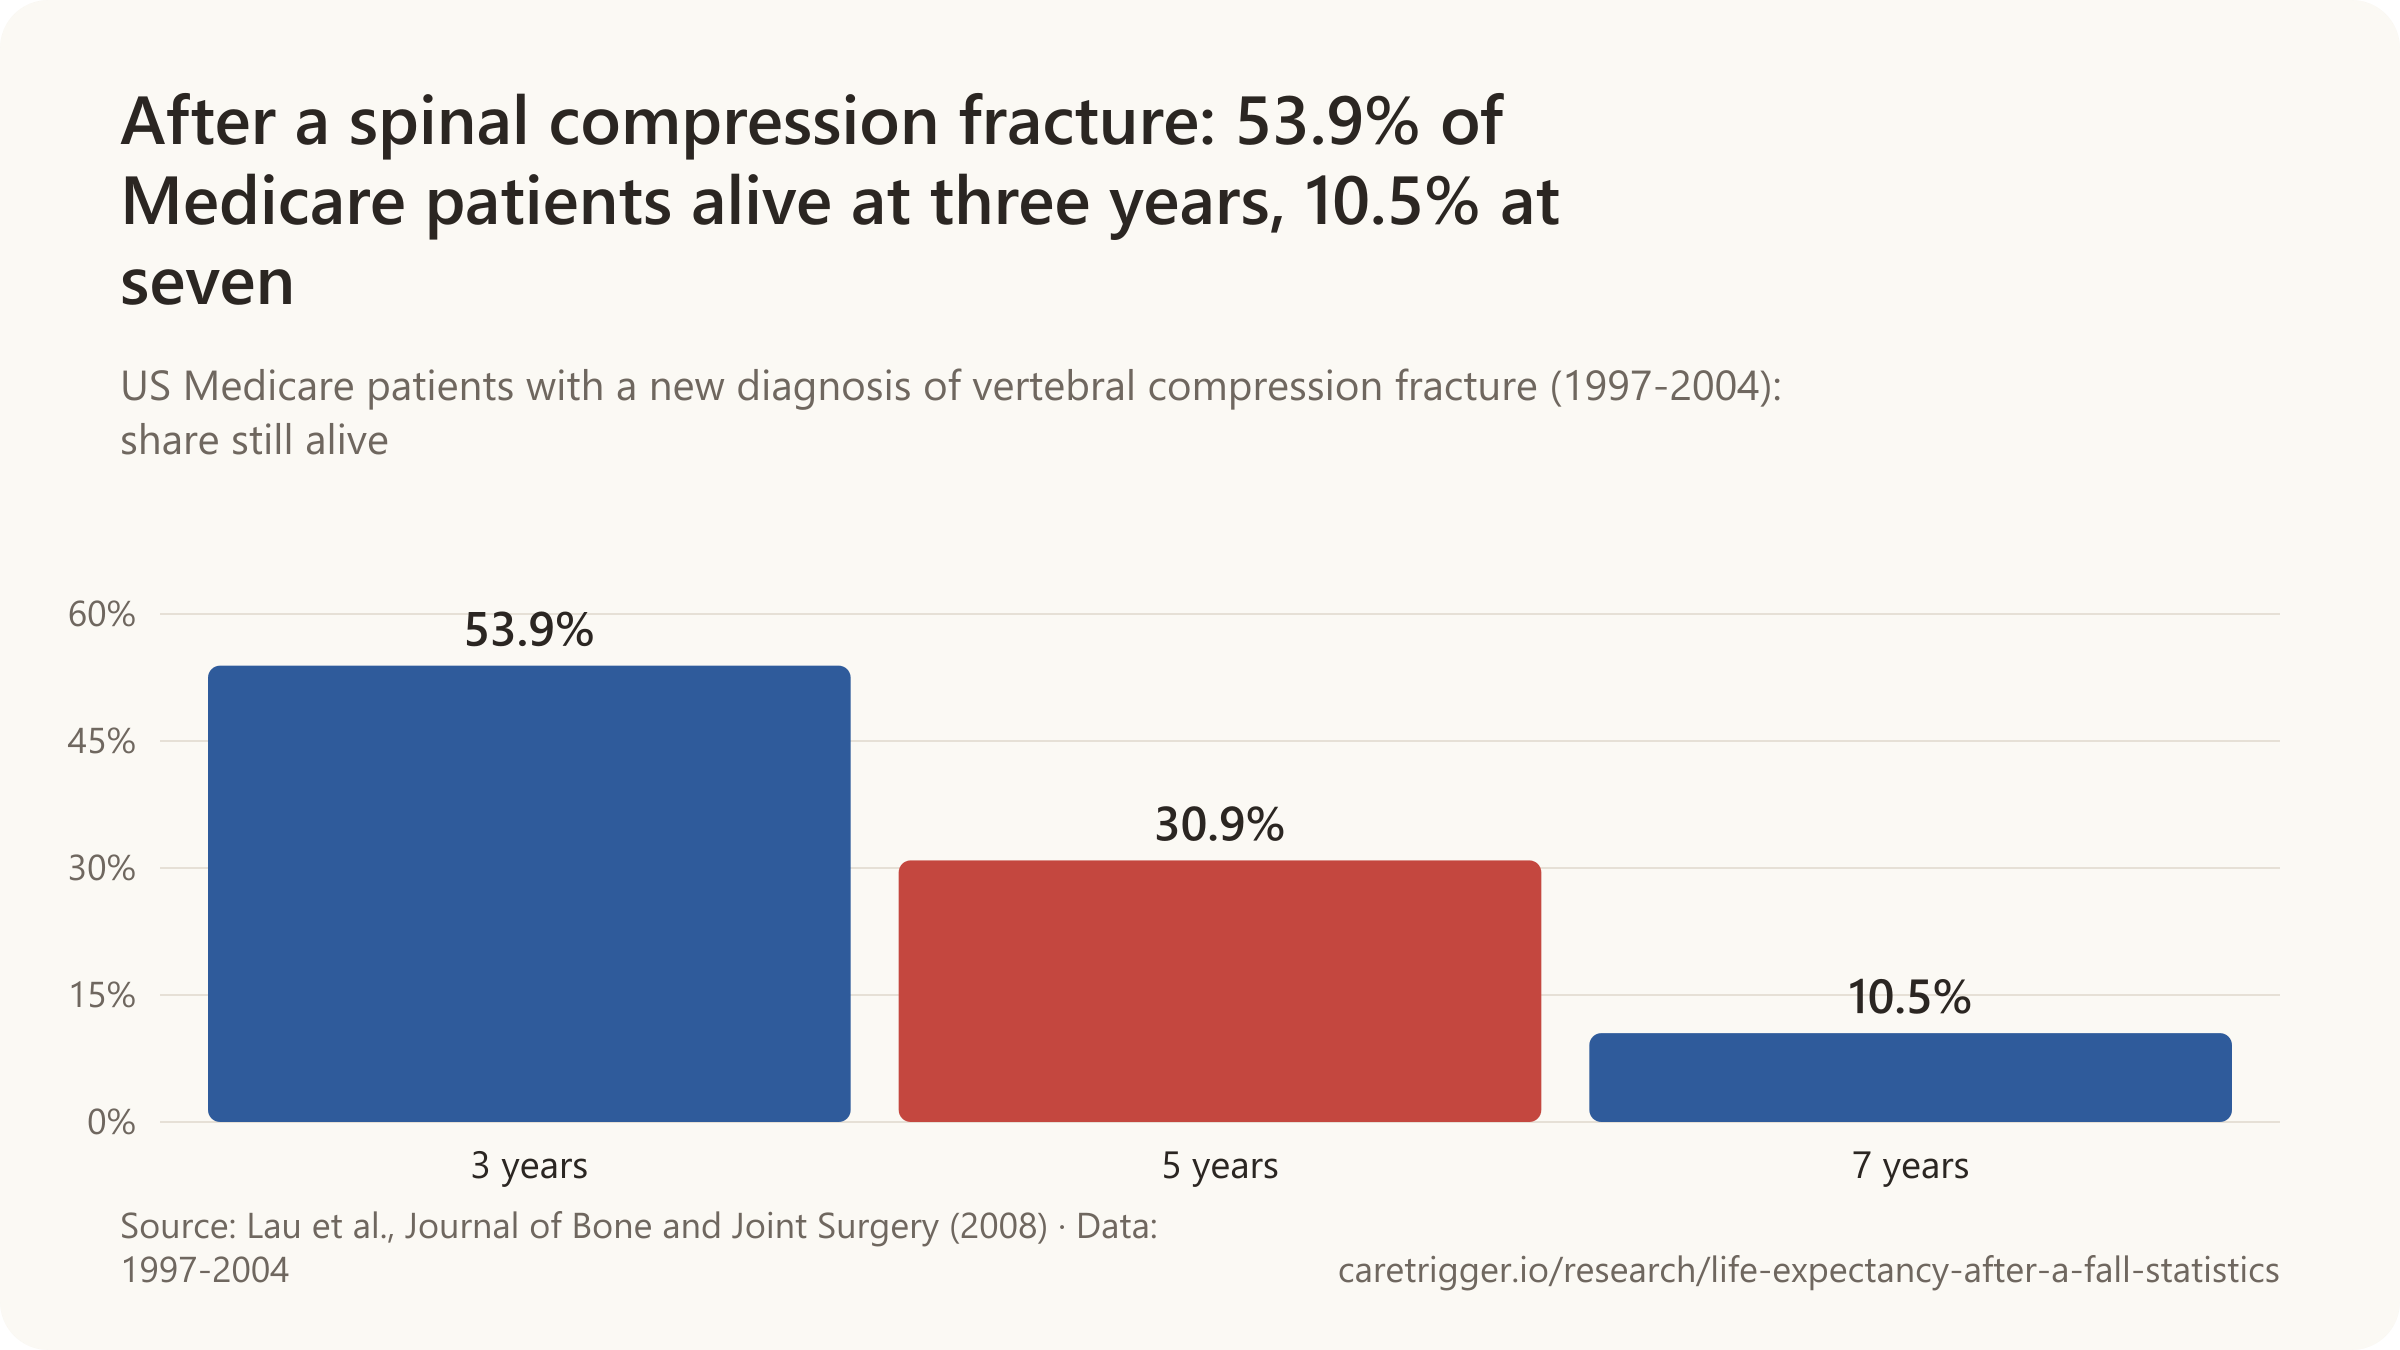
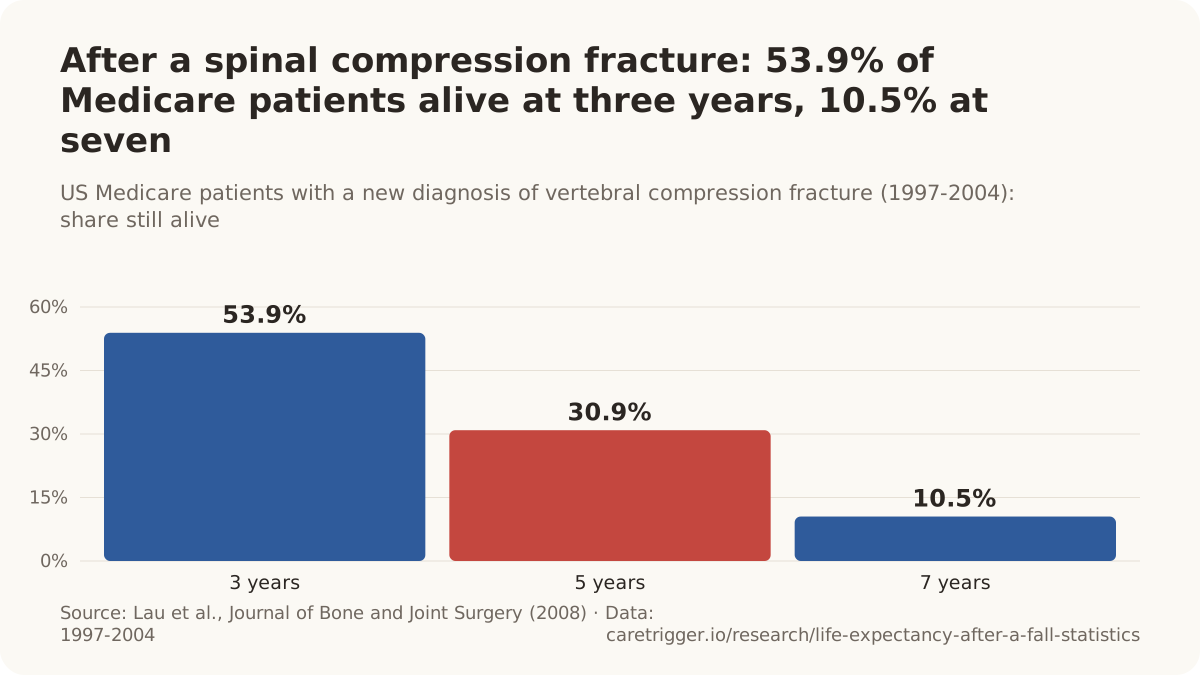
- US Medicare patients with a spinal compression fracture died at about twice the rate of matched people without one (1997-2004).
- Women 65 and older with a spine fracture on X-ray had a 1.23 times higher death rate over eight years (1999).
- Of patients over 65 with a spinal compression fracture, 86.6% were alive a year later and 59.4% after five years (2017-2020).
- A spine fracture at 80 cost Danish men an estimated 2.7 years of life (2023).
| Fracture and patients | Died within a year |
|---|---|
| Cervical spine (neck) fracture, 65 and older | 28% |
| Cervical spine fracture without spinal cord injury, Medicare | 31.1% |
| Odontoid (C2) fracture, 65 and older | 34.1% |
A "broken neck" can mean a fracture of the cervical spine or of the femoral neck (a hip fracture); the table is about the spine.
Sources: Journal of Bone and Joint Surgery (2010, 2008); Archives of Internal Medicine; Aging Clinical and Experimental Research; eLife; World Neurosurgery; Bone & Joint Journal
More statistics (38)
30.9% of US Medicare patients were alive five years after a new diagnosis of vertebral compression fracture (Lau et al., Journal of Bone and Joint Surgery, 2008).
Spinal compression fractures are the most common fragility fracture, and many are never diagnosed. People who have them die sooner than people who do not, but much of the gap reflects the poorer health that made the spine fragile in the first place. Fractures of the neck vertebrae after a fall are rarer and more often fatal.
Compression fractures
- US Medicare patients with a vertebral compression fracture died at about twice the rate of matched people without one, with a greater excess in men (Lau et al., Journal of Bone and Joint Surgery, 2008).
- Women aged 65 and over with one or more vertebral (spine) fractures on X-ray had a 1.23 times higher age-adjusted death rate than women without them, over eight years (Kado et al., Archives of Internal Medicine, 1999).
- 86.6% of patients over 65 with a vertebral compression fracture were alive a year later and 59.4% after five years; infection was the leading cause of death (Gutiérrez-González et al., Aging Clinical and Experimental Research, 2023).
- In the first years after a low-trauma vertebral fracture, Australian women aged 60 and over died at 1.66 times the rate of the local population and men at 2.38 times (Center et al., The Lancet, 1999).
- Australian women aged 60 and over died at 1.82 times the expected rate after a low-trauma vertebral fracture and men at 2.12 times (Bliuc et al., JAMA, 2009).
- One year after a fragility fracture of the spine, excess mortality in Danes aged 50 and over was 10% (Tran et al., Journal of Clinical Endocrinology & Metabolism, 2018).
- Deaths rose with the number of vertebral fractures, from 19 per 1,000 woman-years in older women with none to 44 per 1,000 in those with five or more (Kado et al., Archives of Internal Medicine, 1999).
- Older women with vertebral fractures had 2.1 times the risk of dying from lung disease and 1.4 times the risk of dying from cancer (Kado et al., Archives of Internal Medicine, 1999).
- Only about one-third of vertebral fractures are clinically diagnosed (Kado et al., Archives of Internal Medicine, 1999).
- Women aged 65 and over with a new vertebral fracture had a 32% higher age-adjusted risk of death than women without one (Kado et al., Osteoporosis International, 2003).
- After adjustment for weight loss, physical frailty and other predictors, a new vertebral fracture was no longer independently associated with death in older women (relative hazard 1.06) (Kado et al., Osteoporosis International, 2003).
- Women aged 55-81 who had a clinical vertebral fracture had 8.64 times the age-adjusted risk of death of women without a fracture, more than after a hip fracture (6.68) (Cauley et al., Osteoporosis International, 2000).
- 53.9% of US Medicare patients were alive three years after a new diagnosis of vertebral compression fracture, 30.9% after five years and 10.5% after seven years (Lau et al., Journal of Bone and Joint Surgery, 2008).
- 10.5% of US Medicare patients were alive seven years after a new diagnosis of vertebral compression fracture (Lau et al., Journal of Bone and Joint Surgery, 2008).
- Canadian women aged 50 and over who had a vertebral fracture had 3.7 times the adjusted risk of death in the first year, and 3.2 times in the second (Ioannidis et al., CMAJ, 2009).
- One-year mortality after a vertebral fracture in South Koreans aged 50 and over was 6.2% in 2021, little changed from 6.5% in 2006, and about twice as high in men as in women (Lee et al., Archives of Osteoporosis, 2025).
- Patients with a first osteoporotic vertebral compression fracture had 1.22 times the risk of death of age- and gender-matched people, after adjustment for other illnesses, in Korean national data on 291,203 patients (Son et al., PLOS ONE, 2023).
- Korean patients aged 65 and over with a vertebral compression fracture died at 1.59 times the rate of the general population, against 2.87 times for younger patients (Kim et al., Pain Physician, 2023).
- 59.4% of patients over 65 with a vertebral compression fracture were alive five years later (Gutiérrez-González et al., Aging Clinical and Experimental Research, 2023).
- Patients hospitalised with a vertebral compression fracture had filled 16.41 chronic-medication prescriptions in the three months before, against 11.52 for matched controls; after accounting for this, the fracture made no significant difference to survival (Zohar et al., Geriatric Orthopaedic Surgery & Rehabilitation, 2023).
Years of life lost
- Danish men who had a vertebral (spine) fracture at age 80 lost an estimated 2.7 years of life on average compared with men of the same age and comorbidity without a fracture (a 'skeletal age' of 82.7) (Tran et al., eLife, 2023).
- Danish men who had a vertebral (spine) fracture at age 70 lost an estimated 3.7 years of life on average compared with men of the same age and comorbidity without a fracture (a 'skeletal age' of 73.7) (Tran et al., eLife, 2023).
- Danish men who had a vertebral (spine) fracture at age 90 lost an estimated 1.7 years of life on average compared with men of the same age and comorbidity without a fracture (a 'skeletal age' of 91.7) (Tran et al., eLife, 2023).
- Danish women who had a vertebral (spine) fracture at age 70 lost an estimated 3.5 years of life on average compared with women of the same age and comorbidity without a fracture (a 'skeletal age' of 73.5) (Tran et al., eLife, 2023).
- Danish women who had a vertebral (spine) fracture at age 80 lost an estimated 2.6 years of life on average compared with women of the same age and comorbidity without a fracture (a 'skeletal age' of 82.6) (Tran et al., eLife, 2023).
- Danish women who had a vertebral (spine) fracture at age 90 lost an estimated 1.7 years of life on average compared with women of the same age and comorbidity without a fracture (a 'skeletal age' of 91.7) (Tran et al., eLife, 2023).
Neck (cervical spine) fractures
- 28% of patients aged 65 and over with a cervical spine (neck) fracture died within a year and 19% within three months (Harris et al., Journal of Bone and Joint Surgery, 2010).
- 31.1% of US Medicare patients over 65 with a cervical spine fracture without spinal cord injury died within a year, against 36.5% of those with a spinal cord injury (Zeitouni et al., World Neurosurgery, 2020).
- 34.1% of patients aged 65 and over (mean 83.7) with a fracture of the odontoid process (C2 neck vertebra) died within a year and 14.6% within 30 days (Shafafy et al., Bone & Joint Journal, 2019).
- 5.9% of US patients aged 65-90 treated without surgery for an odontoid (C2) fracture died in hospital, against 3.6% of those operated (Alluri et al., Spine, 2021).
Five-year survival in Ontario
- 19.7% of men aged 86 and over were still alive five years after a clinical spine (vertebral) fracture in Ontario (fractures in 2011-2015) (Vincent et al., JBMR Plus, 2024).
- 66.0% of men aged 86 and over were still alive one year after a clinical spine (vertebral) fracture in Ontario (fractures in 2011-2015) (Vincent et al., JBMR Plus, 2024).
- Men aged 86 and over had a five-year survival after a clinical spine (vertebral) fracture of 35.5% of that of matched men without a fracture (relative survival ratio) (Ontario, 2011-2015) (Vincent et al., JBMR Plus, 2024).
- Men aged 66 to 85 had a five-year survival after a clinical spine (vertebral) fracture of 53.2% to 69.4% of that of matched men without a fracture, depending on age (relative survival ratio) (Ontario, 2011-2015) (Vincent et al., JBMR Plus, 2024).
- Women aged 86 and over had a five-year survival after a clinical spine (vertebral) fracture of 58.7% of that of matched women without a fracture, against 35.5% for men of the same age (Ontario, 2011-2015) (Vincent et al., JBMR Plus, 2024).
Other studies
- 17.9% of adults aged 66+ (1,183 of 6,595) died within a year of a fragility fracture of the spine (clinical vertebral) in Ontario (2011-2015), against 5.3% in the whole matched group without a fracture (Brown et al., BMC Musculoskeletal Disorders, 2021).
A number we will not publish. "Vertebral fractures carry a one-year mortality of 28%, similar to hip fractures" appears in a 2025 review without a source. National figures are far lower: 6.2% in South Korea, and 86.6% of patients over 65 were alive a year later in a Spanish hospital cohort.
Sources: Journal of Bone and Joint Surgery (2008, 2010); Archives of Internal Medicine; Aging Clinical and Experimental Research; The Lancet; JAMA; Journal of Clinical Endocrinology & Metabolism; Osteoporosis International (2000, 2003); CMAJ; Archives of Osteoporosis; PLOS ONE; Pain Physician; Geriatric Orthopaedic Surgery & Rehabilitation; eLife; World Neurosurgery; Bone & Joint Journal; Spine; JBMR Plus; BMC Musculoskeletal Disorders
11 / Ribs and other bones
How dangerous are broken ribs, wrists and other fractures for older adults?
In Ontario, 14.4% of adults 66 and older died within a year of a fragility fracture, against 5.3% without one (BMC Musculoskeletal Disorders, 2011-2015).

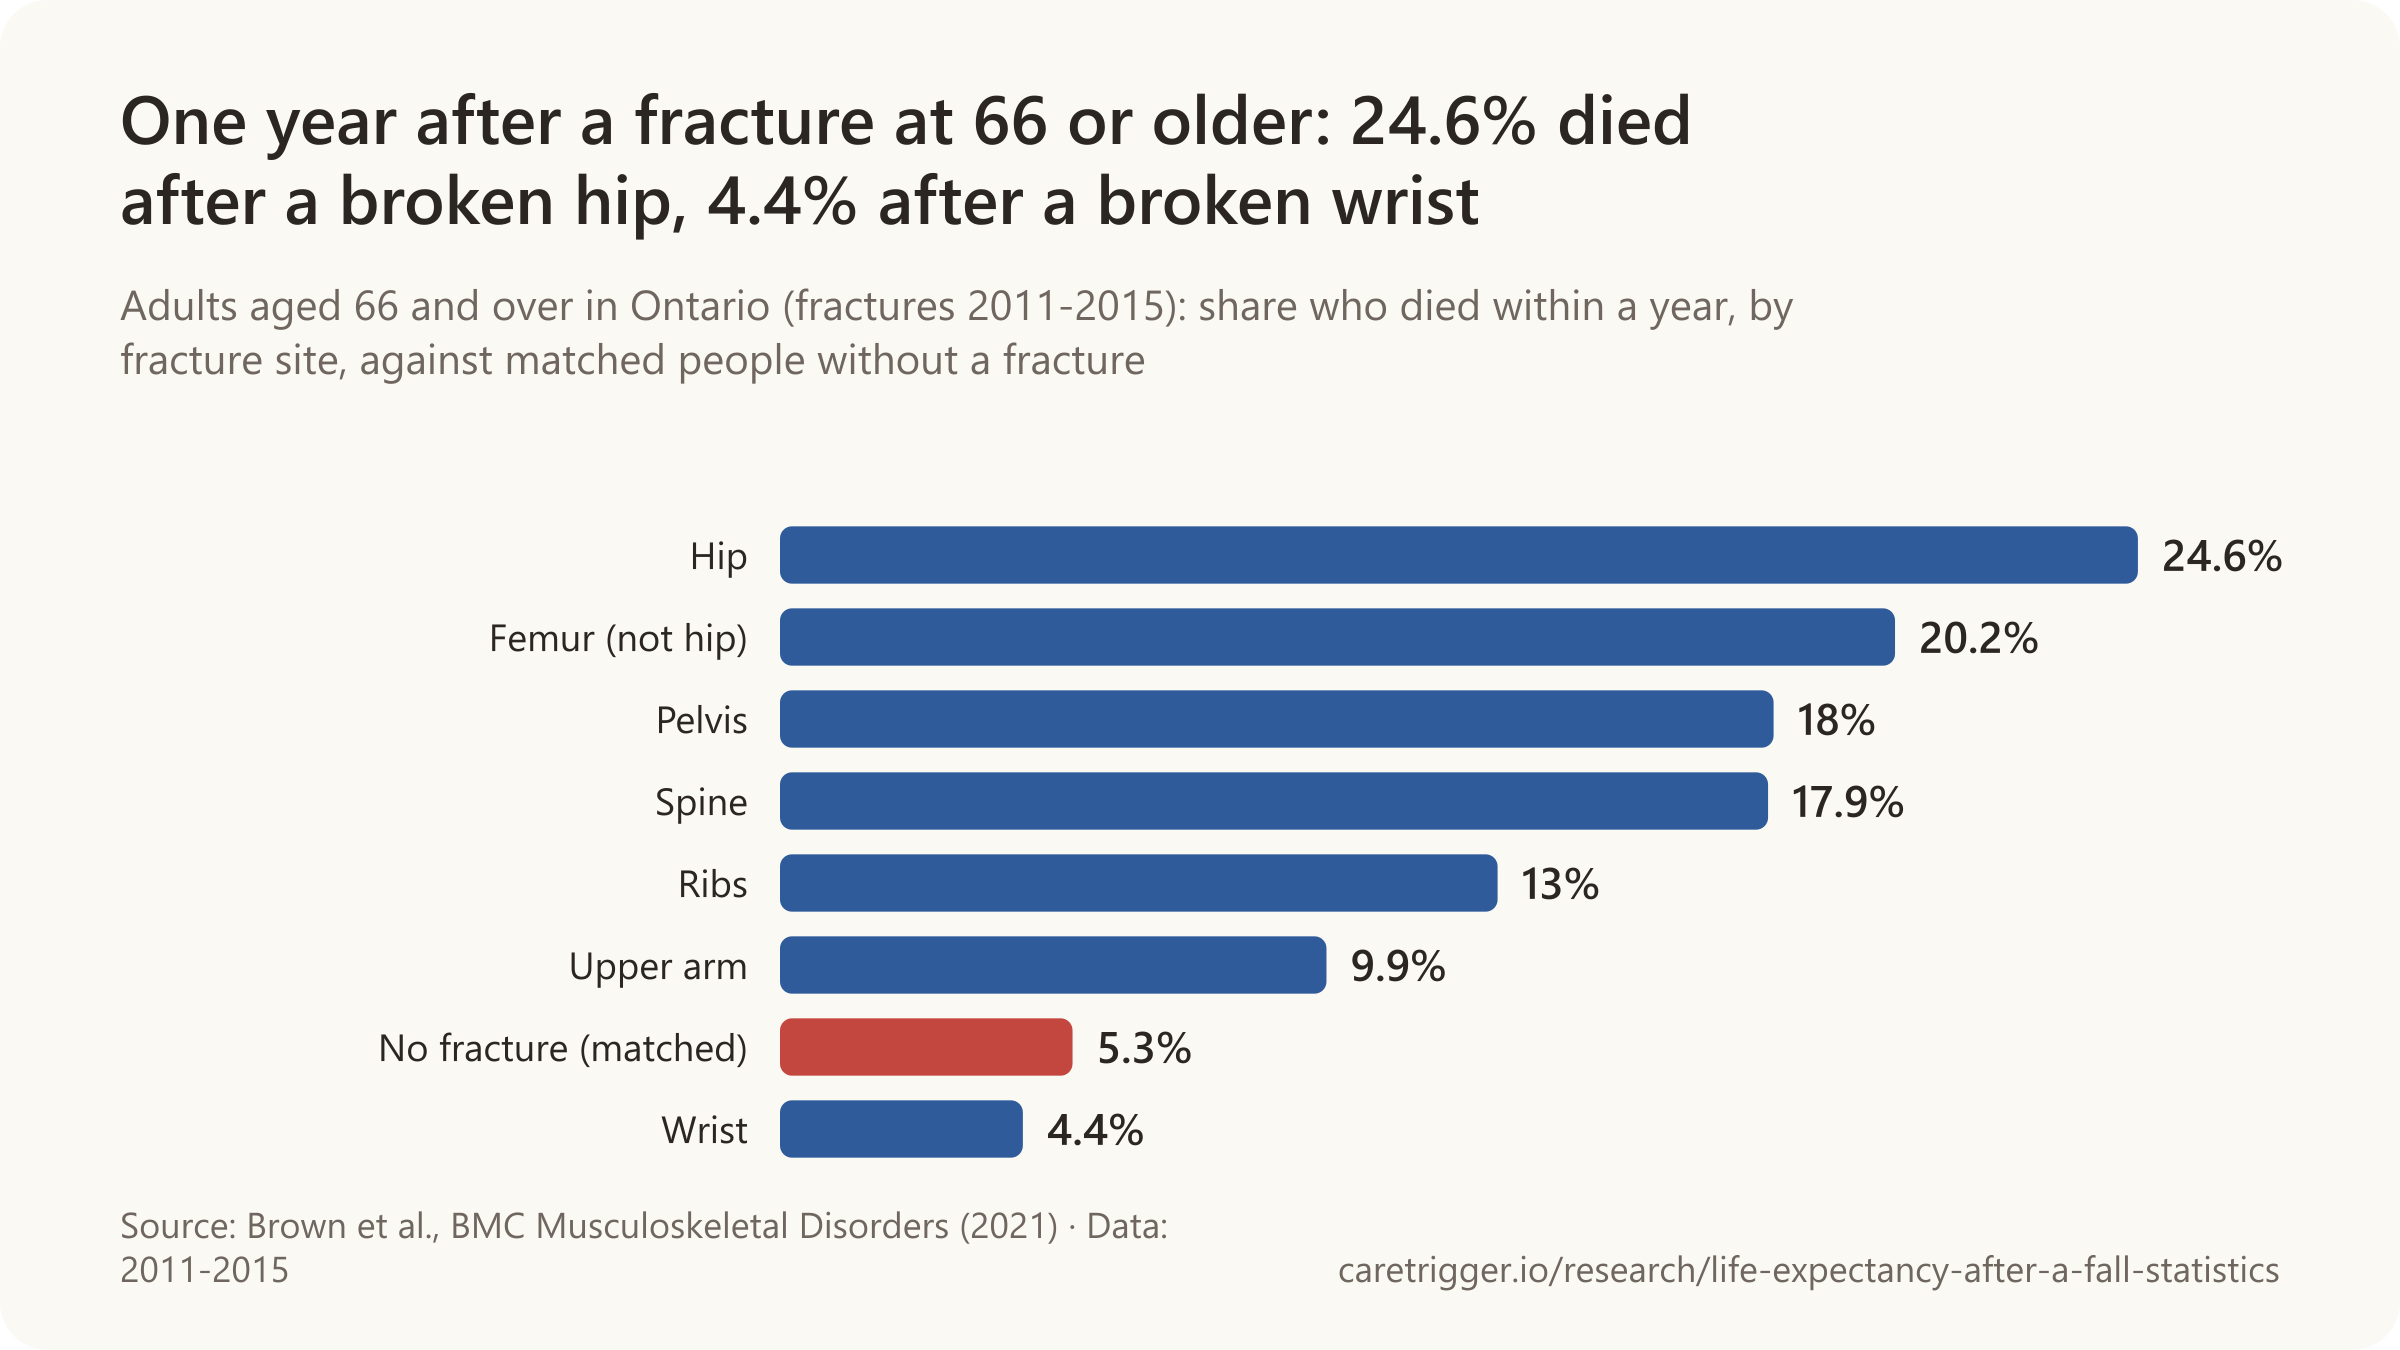
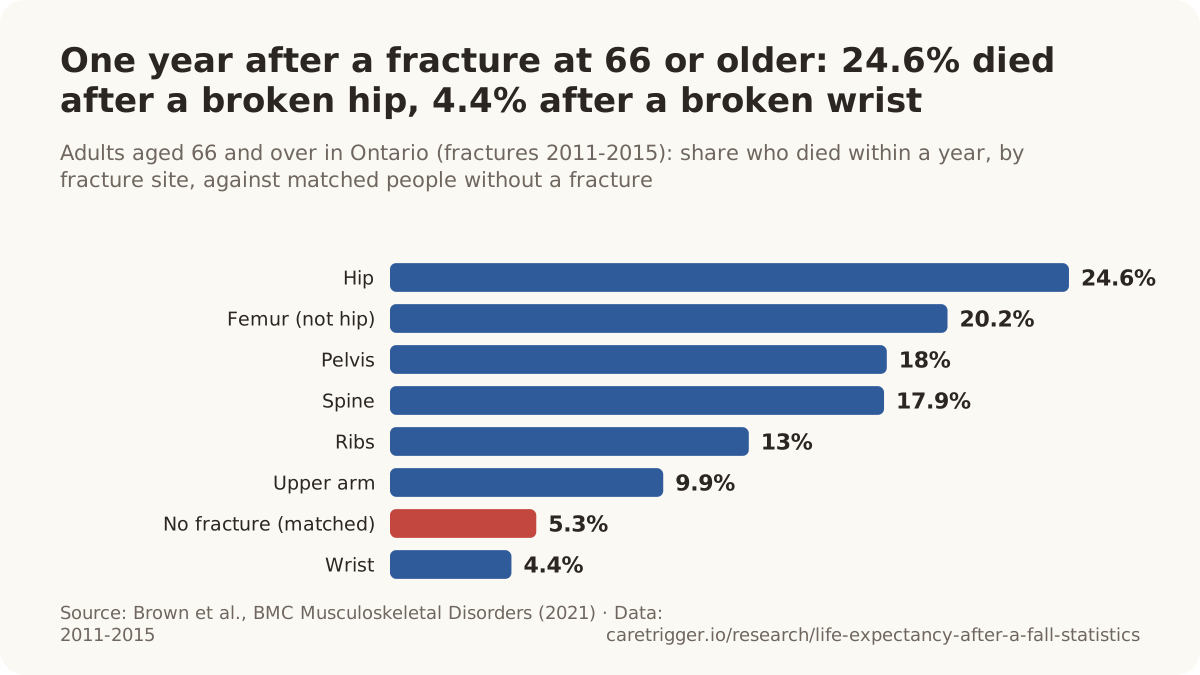
- For people 65 and older, each additional broken rib raised the odds of death by 19% (2000).
- Of patients 65 and older with more than six broken ribs, 20.6% died, against 7.0% with six or fewer (2026).
- 10% of US women 65 and older on Medicare broke another bone within a year of a fracture, 31% within five years (2010-2014).
- 9% of Danish hip-fracture patients had a second hip fracture within a year and 20% within five years (1977-2001).
- Across 17 studies, 10% of people 65 and older with a shoulder (proximal humerus) fracture died within a year (2026).
| Fracture and gender | Years of life lost |
|---|---|
| Hip fracture at 80, men | 3.6 years |
| Hip fracture at 80, women | 3.1 years |
| Upper-arm fracture at 80, men | 2.7 years |
| Upper-arm fracture at 80, women | 1.6 years |
| Rib fracture at 80, men | 1.6 years |
| Rib fracture at 80, women | 1.7 years |
Sources: BMC Musculoskeletal Disorders; Journal of Trauma; Journal of Surgical Research; Osteoporosis International (2026, 2018); Journal of Bone and Mineral Research; eLife
More statistics (133)
14.4% of adults aged 66+ (14,612 of 101,773) died within a year of a fragility fracture at any site in Ontario (2011-2015), against 5.3% in the whole matched group without a fracture (Brown et al., BMC Musculoskeletal Disorders, 2021).
Any fracture after a fall in later life raises the risk of dying in the following years, but by very different amounts: a broken hip, thigh bone, pelvis or spine most, broken ribs and an upper arm less, a broken wrist hardly at all. A first fracture is also the strongest warning of a second, and the risk is highest in the first year.
All fracture sites compared
- Australian men aged 60 and over died at 2.22 times the expected rate after a major non-hip, non-spine fracture (such as pelvis or upper arm), and 1.45 times after a minor fracture (Center et al., The Lancet, 1999).
- Australian women aged 60 and over died at 1.65 times the expected rate after other major low-trauma fractures and men at 1.70 times (Bliuc et al., JAMA, 2009).
- Even minor low-trauma fractures were followed by higher mortality in Australians aged 60 and over (SMR 1.42 for women, 1.33 for men), mainly in those older than 75 (Bliuc et al., JAMA, 2009).
- Raised mortality after a low-trauma fracture in people aged 60 and over lasted five years for all fracture types and up to 10 years after a hip fracture (Bliuc et al., JAMA, 2009).
- In the five years after a low-trauma fracture, excess deaths above those expected ranged from 2.7 to 22.3 per 100 person-years in men and from 1.3 to 13.2 in women, depending on the fracture type (Bliuc et al., JAMA, 2009).
- A second fracture was associated with a further rise in the risk of death: hazard ratio 1.91 for women and 2.99 for men aged 60 and over (Bliuc et al., JAMA, 2009).
- One year after a fragility fracture of the femur or pelvis, excess mortality in Danes aged 50 and over was 20% to 25% above that of the general population (Tran et al., Journal of Clinical Endocrinology & Metabolism, 2018).
- One year after a fragility fracture of the upper arm, ribs or collarbone, excess mortality in Danes aged 50 and over was 5% to 10% (Tran et al., Journal of Clinical Endocrinology & Metabolism, 2018).
- One year after a fragility fracture of the lower leg, excess mortality in Danes aged 50 and over was 3% (Tran et al., Journal of Clinical Endocrinology & Metabolism, 2018).
- One year after a hip fracture, excess mortality in Danes aged 50 and over was 33% for men and 20% for women, the highest of any fracture (Tran et al., Journal of Clinical Endocrinology & Metabolism, 2018).
- Excess mortality was still present about five years after femur, other proximal and lower-leg fractures, and up to 10 years after hip fractures, in Danes aged 50 and over (Tran et al., Journal of Clinical Endocrinology & Metabolism, 2018).
- Most excess deaths after a fragility fracture occurred within the first year, after which excess mortality gradually declined (Tran et al., Journal of Clinical Endocrinology & Metabolism, 2018).
- A low-trauma fracture was associated with between one and seven years of life lost in Danish adults aged 50 and over, more in men than women and most after a hip fracture (Tran et al., eLife, 2023).
- Danish men with any low-trauma fracture had 1.46 times the risk of death of men of the same age and comorbidity without one, and women 1.28 times (Tran et al., eLife, 2023).
- For the same age and comorbidities, Danish men and women with a hip or femur fracture had almost twice the risk of death of people without a fracture (Tran et al., eLife, 2023).
- Women aged 55-81 had 2.15 times the age-adjusted risk of dying after any clinical fracture, but no increase after a forearm (wrist) fracture (Cauley et al., Osteoporosis International, 2000).
- 9.4% of women aged 66+ died within a year of a fragility fracture somewhere other than the hip (such as the wrist, arm, ribs, pelvis or spine) in Ontario (2011-2015), against 5.1% of matched women without a fracture (Brown et al., BMC Musculoskeletal Disorders, 2021).
- 14.4% of men aged 66+ died within a year of a fragility fracture somewhere other than the hip in Ontario (2011-2015), against 6.0% of matched men without a fracture (Brown et al., BMC Musculoskeletal Disorders, 2021).
- 20.9% of women aged 66+ died within three years of a fragility fracture somewhere other than the hip in Ontario (2011-2015), against 14.8% of matched women without a fracture (Brown et al., BMC Musculoskeletal Disorders, 2021).
- 29.6% of men aged 66+ died within three years of a fragility fracture somewhere other than the hip in Ontario (2011-2015), against 17.8% of matched men without a fracture (Brown et al., BMC Musculoskeletal Disorders, 2021).
- 12.5% of women aged 66+ died within a year of a fragility fracture at any site in Ontario (2011-2015), against 5.1% of matched women without a fracture (Brown et al., BMC Musculoskeletal Disorders, 2021).
- 19.5% of men aged 66+ died within a year of a fragility fracture at any site in Ontario (2011-2015), against 6.0% of matched men without a fracture (Brown et al., BMC Musculoskeletal Disorders, 2021).
- Women aged 66+ had 2.47 times the risk of dying within a year after a fragility fracture compared with matched women without a fracture (Ontario, 2011-2015) (Brown et al., BMC Musculoskeletal Disorders, 2021).
- Men aged 66+ had 3.22 times the risk of dying within a year after a fragility fracture compared with matched men without a fracture (Ontario, 2011-2015) (Brown et al., BMC Musculoskeletal Disorders, 2021).
- 18.4% of adults aged 66+ (608 of 3,299) died within a year of fragility fractures of several bones at once in Ontario (2011-2015), against 5.3% in the whole matched group without a fracture (Brown et al., BMC Musculoskeletal Disorders, 2021).
- 13.6% of adults aged 66+ (325 of 2,383) died within a year of a fragility fracture of the collarbone or breastbone in Ontario (2011-2015), against 5.3% in the whole matched group without a fracture (Brown et al., BMC Musculoskeletal Disorders, 2021).
- 13.0% of adults aged 66+ (1,327 of 10,247) died within a year of a fragility fracture of the ribs in Ontario (2011-2015), against 5.3% in the whole matched group without a fracture (Brown et al., BMC Musculoskeletal Disorders, 2021).
- 9.9% of adults aged 66+ (1,159 of 11,756) died within a year of a fragility fracture of the upper arm (humerus) in Ontario (2011-2015), against 5.3% in the whole matched group without a fracture (Brown et al., BMC Musculoskeletal Disorders, 2021).
- 6.0% of adults aged 66+ (264 of 4,377) died within a year of a fragility fracture of the forearm (radius/ulna, not wrist) in Ontario (2011-2015), against 5.3% in the whole matched group without a fracture (Brown et al., BMC Musculoskeletal Disorders, 2021).
- 5.8% of adults aged 66+ (575 of 9,859) died within a year of a fragility fracture of the lower leg or knee in Ontario (2011-2015), against 5.3% in the whole matched group without a fracture (Brown et al., BMC Musculoskeletal Disorders, 2021).
- 4.4% of adults aged 66+ (718 of 16,467) died within a year of a fragility fracture of the wrist in Ontario (2011-2015), against 5.3% in the whole matched group without a fracture (Brown et al., BMC Musculoskeletal Disorders, 2021).
- 5.3% of matched people aged 66+ without a fracture died within a year, about the same as after a wrist (4.4%), forearm (6.0%) or lower-leg (5.8%) fracture (Ontario, 2011-2015) (Brown et al., BMC Musculoskeletal Disorders, 2021).
- 3.5% of women aged 66 to 70 died within a year of a fragility fracture at any site in Ontario (2011-2015), against 1.0% of matched women of the same age without a fracture (Brown et al., BMC Musculoskeletal Disorders, 2021).
- 6.9% of men aged 66 to 70 died within a year of a fragility fracture at any site in Ontario (2011-2015), against 1.4% of matched men of the same age without a fracture (Brown et al., BMC Musculoskeletal Disorders, 2021).
- 5.2% of women aged 71 to 75 died within a year of a fragility fracture at any site in Ontario (2011-2015), against 1.7% of matched women of the same age without a fracture (Brown et al., BMC Musculoskeletal Disorders, 2021).
- 10.7% of men aged 71 to 75 died within a year of a fragility fracture at any site in Ontario (2011-2015), against 2.9% of matched men of the same age without a fracture (Brown et al., BMC Musculoskeletal Disorders, 2021).
- 7.8% of women aged 76 to 80 died within a year of a fragility fracture at any site in Ontario (2011-2015), against 2.9% of matched women of the same age without a fracture (Brown et al., BMC Musculoskeletal Disorders, 2021).
- 16.5% of men aged 76 to 80 died within a year of a fragility fracture at any site in Ontario (2011-2015), against 4.2% of matched men of the same age without a fracture (Brown et al., BMC Musculoskeletal Disorders, 2021).
- 11.6% of women aged 81 to 85 died within a year of a fragility fracture at any site in Ontario (2011-2015), against 4.8% of matched women of the same age without a fracture (Brown et al., BMC Musculoskeletal Disorders, 2021).
- 21.9% of men aged 81 to 85 died within a year of a fragility fracture at any site in Ontario (2011-2015), against 7.3% of matched men of the same age without a fracture (Brown et al., BMC Musculoskeletal Disorders, 2021).
- 23.6% of women aged 86 and over died within a year of a fragility fracture at any site in Ontario (2011-2015), against 10.0% of matched women of the same age without a fracture (Brown et al., BMC Musculoskeletal Disorders, 2021).
- 34.6% of men aged 86 and over died within a year of a fragility fracture at any site in Ontario (2011-2015), against 11.8% of matched men of the same age without a fracture (Brown et al., BMC Musculoskeletal Disorders, 2021).
- 45.8% of women aged 86 and over died within three years of a fragility fracture at any site in Ontario (2011-2015), against 27.7% of matched women of the same age without a fracture (Brown et al., BMC Musculoskeletal Disorders, 2021).
- 59.8% of men aged 86 and over died within three years of a fragility fracture at any site in Ontario (2011-2015), against 32.4% of matched men of the same age without a fracture (Brown et al., BMC Musculoskeletal Disorders, 2021).
- 58.5% of adults aged 66+ were alive five years after a fragility fracture at any site in Ontario (fractures in 2011-2015), against 75.2% of matched people without a fracture (Brown et al., BMC Musculoskeletal Disorders, 2021).
- 85.6% of adults aged 66+ were alive one year after a fragility fracture at any site in Ontario (fractures in 2011-2015), against 94.7% of matched people without a fracture (Brown et al., BMC Musculoskeletal Disorders, 2021).
- 17.6% of adults aged 66+ (17,958) had a second fragility fracture within up to six years of a first one (median follow-up 3.3 years) in Ontario (Brown et al., BMC Musculoskeletal Disorders, 2021).
- 4.9% of adults aged 66+ with a fragility fracture (4,956) went on to break a hip within up to six years (median follow-up 3.3 years) in Ontario (Brown et al., BMC Musculoskeletal Disorders, 2021).
- Depending on fracture site and gender, 32.3% to 78.6% of adults aged 66+ were alive five years after a fragility fracture in Ontario (fractures in 2011-2015) (Vincent et al., JBMR Plus, 2024).
- Even after a wrist, forearm or lower-leg fracture, women aged 86 and over had a five-year survival of 75.9% of that of matched women without a fracture (relative survival ratio) (Ontario, 2011-2015) (Vincent et al., JBMR Plus, 2024).
- Even after a wrist, forearm or lower-leg fracture, men aged 86 and over had a five-year survival of 69.5% of that of matched men without a fracture (relative survival ratio) (Ontario, 2011-2015) (Vincent et al., JBMR Plus, 2024).
- 2% of people aged 65+ in Denmark died within 30 days of an operated tibia (shin bone) fracture (1998-2017) (Larsen et al., Injury, 2025).
- 8% of people aged 65+ in Denmark died within a year of an operated tibia (shin bone) fracture (1998-2017) (Larsen et al., Injury, 2025).
- 1% of people aged 65+ in Denmark died within 30 days of an operated foot or ankle fracture (1998-2017) (Larsen et al., Injury, 2025).
- 6% of people aged 65+ in Denmark died within a year of an operated foot or ankle fracture (1998-2017) (Larsen et al., Injury, 2025).
- 5.6% to 7.1% of US patients aged 65+ died within a year of a first fracture of the upper arm (proximal or distal humerus) or shin (proximal or distal tibia), 1.63 to 1.97 times the rate in matched people without a fracture (Ghafarian et al., Injury, 2026).
- 2.77% of matched US adults aged 65+ without a fracture died within a year, the comparison rate for every fracture type (TriNetX, 2004-2024) (Ghafarian et al., Injury, 2026).
Years of life lost by fracture site
- Danish men who had a rib fracture at age 70 lost an estimated 2.2 years of life on average compared with men of the same age and comorbidity without a fracture (a 'skeletal age' of 72.2) (Tran et al., eLife, 2023).
- Danish men who had an upper-arm (humerus) fracture at age 70 lost an estimated 3.8 years of life on average compared with men of the same age and comorbidity without a fracture (a 'skeletal age' of 73.8) (Tran et al., eLife, 2023).
- Danish men who had a hip fracture at age 70 lost an estimated 5.0 years of life on average compared with men of the same age and comorbidity without a fracture (a 'skeletal age' of 75) (Tran et al., eLife, 2023).
- Danish men who had a rib fracture at age 80 lost an estimated 1.6 years of life on average compared with men of the same age and comorbidity without a fracture (a 'skeletal age' of 81.6) (Tran et al., eLife, 2023).
- Danish men who had an upper-arm (humerus) fracture at age 80 lost an estimated 2.7 years of life on average compared with men of the same age and comorbidity without a fracture (a 'skeletal age' of 82.7) (Tran et al., eLife, 2023).
- Danish men who had a hip fracture at age 80 lost an estimated 3.6 years of life on average compared with men of the same age and comorbidity without a fracture (a 'skeletal age' of 83.6) (Tran et al., eLife, 2023).
- Danish men who had a rib fracture at age 90 lost an estimated 1.1 years of life on average compared with men of the same age and comorbidity without a fracture (a 'skeletal age' of 91.1) (Tran et al., eLife, 2023).
- Danish men who had an upper-arm (humerus) fracture at age 90 lost an estimated 1.8 years of life on average compared with men of the same age and comorbidity without a fracture (a 'skeletal age' of 91.8) (Tran et al., eLife, 2023).
- Danish men who had a hip fracture at age 90 lost an estimated 2.2 years of life on average compared with men of the same age and comorbidity without a fracture (a 'skeletal age' of 92.2) (Tran et al., eLife, 2023).
- Danish women who had a rib fracture at age 70 lost an estimated 2.2 years of life on average compared with women of the same age and comorbidity without a fracture (a 'skeletal age' of 72.2) (Tran et al., eLife, 2023).
- Danish women who had an upper-arm (humerus) fracture at age 70 lost an estimated 2.1 years of life on average compared with women of the same age and comorbidity without a fracture (a 'skeletal age' of 72.1) (Tran et al., eLife, 2023).
- Danish women who had a hip fracture at age 70 lost an estimated 4.2 years of life on average compared with women of the same age and comorbidity without a fracture (a 'skeletal age' of 74.2) (Tran et al., eLife, 2023).
- Danish women who had a rib fracture at age 80 lost an estimated 1.7 years of life on average compared with women of the same age and comorbidity without a fracture (a 'skeletal age' of 81.7) (Tran et al., eLife, 2023).
- Danish women who had an upper-arm (humerus) fracture at age 80 lost an estimated 1.6 years of life on average compared with women of the same age and comorbidity without a fracture (a 'skeletal age' of 81.6) (Tran et al., eLife, 2023).
- Danish women who had a hip fracture at age 80 lost an estimated 3.1 years of life on average compared with women of the same age and comorbidity without a fracture (a 'skeletal age' of 83.1) (Tran et al., eLife, 2023).
- Danish women who had a rib fracture at age 90 lost an estimated 1.1 years of life on average compared with women of the same age and comorbidity without a fracture (a 'skeletal age' of 91.1) (Tran et al., eLife, 2023).
- Danish women who had an upper-arm (humerus) fracture at age 90 lost an estimated 1.0 years of life on average compared with women of the same age and comorbidity without a fracture (a 'skeletal age' of 91) (Tran et al., eLife, 2023).
- Danish women who had a hip fracture at age 90 lost an estimated 2.0 years of life on average compared with women of the same age and comorbidity without a fracture (a 'skeletal age' of 92) (Tran et al., eLife, 2023).
Broken ribs
- For each additional broken rib in patients aged 65 and over, the odds of death rose by 19% (odds ratio 1.19 per rib) (Bulger et al., Journal of Trauma, 2000).
- 20.6% of patients aged 65 and over with more than six broken ribs died, against 7.0% of those with six or fewer, in a 2026 study using CT diagnosis (Velez et al., Journal of Surgical Research, 2026).
- 22% of trauma patients aged 65 and over with rib fractures died, twice the rate of younger patients with similar injuries (10%) (Bulger et al., Journal of Trauma, 2000).
- 31% of trauma patients aged 65 and over with rib fractures developed pneumonia, against 17% of younger patients (Bulger et al., Journal of Trauma, 2000).
- For each additional broken rib, the odds of pneumonia rose (odds ratio 1.16 per rib) in a study of trauma patients aged 65 and over (Bulger et al., Journal of Trauma, 2000).
- Trauma patients aged 65 and over with rib fractures stayed in hospital 15.4 days on average, against 10.7 days for younger patients (Bulger et al., Journal of Trauma, 2000).
- 19.5% of trauma patients aged 65 and over admitted with rib fractures died, against 9.3% of younger patients, although the older patients were less severely injured (Bergeron et al., Journal of Trauma, 2003).
- Trauma patients aged 65 and over with rib fractures had five times the odds of dying of younger patients, after adjustment for injury severity, other illnesses and multiple rib fractures (Bergeron et al., Journal of Trauma, 2003).
- 20.1% of trauma patients aged 65 and over with more than one rib fracture died, against 11.4% of younger patients, in 13 years of Pennsylvania trauma-centre data (Stawicki et al., Journal of the American Geriatrics Society, 2004).
- Patients aged 65 and over with blunt chest wall trauma had nearly twice the odds of dying (OR 1.98), as did patients with three or more rib fractures (OR 2.02), pooled across 29 studies (Battle et al., Injury, 2012).
- Pneumonia after blunt chest wall trauma was associated with 5.24 times the odds of death, pooled across studies (Battle et al., Injury, 2012).
- Age 65 and over (OR 2.11), three or more rib fractures (OR 1.96) and pre-existing disease (OR 2.86) remained the main predictors of death after blunt chest wall trauma in an updated review of 73 studies (Battle et al., Emergency Medicine Journal, 2023).
- Among 67,695 US trauma patients aged 65 and over with rib fractures, eight or more broken ribs were associated with 1.51 times the odds of death and seven or more with 1.32 times the odds of pneumonia (Shulzhenko et al., Surgery, 2017).
- 36% of patients aged 65 and over admitted with isolated rib fractures developed lung complications, and 7.8% died of them (Barnea et al., Canadian Journal of Surgery, 2002).
- Men aged 60 and over who had a low-trauma rib fracture had 7.8 times the risk of dying in the following year compared with men without one, and women 4.9 times (Mai et al., Bone, 2018).
- 4.8 per 1,000 people aged 60 and over had a low-trauma rib fracture each year, and after one the rate of further fractures was 10.2 per 100 person-years (Mai et al., Bone, 2018).
- 10% of older patients (median age 76) admitted with rib fractures died in hospital and 10% developed pneumonia, in a Dutch regional trauma registry (Van Vledder et al., European Journal of Trauma and Emergency Surgery, 2019).
- Falls caused 58% of rib fractures in patients aged 65 and over admitted to a US trauma centre without other significant injuries; 4% died (Shi et al., Trauma Surgery & Acute Care Open, 2017).
- 9% of patients aged 65 and over admitted to a level 1 trauma centre with rib fractures died, lower than the historical figures from the 1990s (Velez et al., Journal of Surgical Research, 2026).
- In older patients with rib fractures, the odds of death rose 5.6% with every additional year of age, and doubled with fractures on both sides or a bruised lung (Velez et al., Journal of Surgical Research, 2026).
- 1.9% of US trauma patients aged 65 and over with isolated rib fractures died in hospital, and 0.8% developed pneumonia (Bowman et al., JAMA Network Open, 2020).
- 2.8% of frail patients aged 65 and over with an isolated rib fracture died in hospital, against 1.2% of non-frail patients (Mohseni et al., Trauma Surgery & Acute Care Open, 2024).
Upper arm and wrist
- 10% of patients aged 65 and over with a proximal humerus (shoulder) fracture died within a year, pooled across 17 studies of 414,379 fractures (O'Dwyer et al., Osteoporosis International, 2026).
- 36.1% of patients aged 65 and over with a proximal humerus (shoulder) fracture died within five years, and 1.74% within 30 days or in hospital (O'Dwyer et al., Osteoporosis International, 2026).
- Danish men aged 60-69 died at 16.32 times the rate of matched men in the first 30 days after a shoulder (proximal humerus) fracture, and women at 7.82 times (Østergaard et al., Osteoporosis International, 2025).
- 11.6% of Danish patients aged 65 and over with a proximal humerus (shoulder) fracture died within a year (Jensen et al., European Journal of Orthopaedic Surgery & Traumatology, 2026).
- Standardised one-year mortality after a humerus fracture in South Korean women aged 50 and over fell from 9.6% to 5.5% between 2006 and 2021, and stayed about twice as high in men (Kim et al., Journal of Korean Medical Science, 2026).
- Refracture rates after a humerus fracture in South Korean women rose four-fold, from 17 to 67 per 1,000, between 2007 and 2021 (Kim et al., Journal of Korean Medical Science, 2026).
- Patients hospitalised with an arm or shoulder fracture in Finland died at 1.5 times the rate of the general population (men 2.1, women 1.3); the rate was about doubled after humerus fractures and not raised after wrist fractures (Somersalo et al., Acta Orthopaedica, 2015).
- Danish men aged 50-59 with a wrist (distal radius) fracture died at 4.60 times the rate of matched men, and women at 3.08 times, the highest ratios of any age group; the excess fell at older ages (Budtz et al., Acta Orthopaedica, 2026).
- Only 5% of Swedish patients aged 80 and over with a wrist (distal radius) fracture died within a year, 44% of the deaths expected for people of the same age and gender (SMR 0.44) (Arvidsson et al., Geriatric Orthopaedic Surgery & Rehabilitation, 2024).
- Women who broke their wrist (distal forearm) had 1.54 times the risk of a later hip fracture over up to 24 years, and men 2.27 times (Mallmin et al., Calcified Tissue International, 1993).
- 55% of people who broke their wrist (distal forearm) had another fracture within 10 years, and 80% within 20 years (Cuddihy et al., Osteoporosis International, 1999).
- Women over 70 who broke their wrist had 1.6 times the expected risk of a later hip fracture; vertebral fracture risk was 5.2 times higher in women and 10.7 times in men (Cuddihy et al., Osteoporosis International, 1999).
A second fracture
- 10% of US women aged 65 and over on Medicare who had a fracture broke another bone within a year, 18% within two years and 31% within five years (Balasubramanian et al., Osteoporosis International, 2019).
- 9% of Danish hip fracture patients had a second hip fracture within a year and 20% within five years, against an expected 2% and 12% (Ryg et al., Journal of Bone and Mineral Research, 2009).
- One year after a first major osteoporotic fracture, the risk of a second was 2.7 times the population risk; after 10 years it was still 1.4 times (Johansson et al., Osteoporosis International, 2017).
- The risk of a second major osteoporotic fracture rose 4% with each year of age and was 41% higher in women than in men (Johansson et al., Osteoporosis International, 2017).
- 23% of all second fractures in postmenopausal women happened within a year of the first fracture, and 54% within five years (van Geel et al., Annals of the Rheumatic Diseases, 2009).
- Within a year of a first fracture, women had 5.3 times the risk of another fracture, falling to 2.8 times in years two to five and 1.4 times in years six to ten (van Geel et al., Annals of the Rheumatic Diseases, 2009).
- 19.2% of women who had a new vertebral fracture had another vertebral fracture within the following year (Lindsay et al., JAMA, 2001).
- 20% of Danish hip fracture patients had a second hip fracture within five years, against 12% expected (Ryg et al., Journal of Bone and Mineral Research, 2009).
- 27% of Danish men died within a year of a second hip fracture, against 9% of the background population, and 21% of women (against 10%) (Ryg et al., Journal of Bone and Mineral Research, 2009).
- 58% of Danish women died within five years of a second hip fracture, against 41% of the background population (Ryg et al., Journal of Bone and Mineral Research, 2009).
- 8.2% of Framingham Study members who broke a hip had a second hip fracture within five years (9.7% of women), and 2.5% within one year (Berry et al., Archives of Internal Medicine, 2007).
- 24.1% of people died within a year of a second hip fracture, against 15.9% after a first hip fracture, in the Framingham Study (Berry et al., Archives of Internal Medicine, 2007).
- Women with a previous fracture had twice the risk of a future fracture (RR 2.0), and women with an existing vertebral fracture about four times the risk of another, in a synthesis of the literature (Klotzbuecher et al., Journal of Bone and Mineral Research, 2000).
- After a first low-trauma fracture, the risk of another was 1.95 times the first-fracture risk for Australian women aged 60 and over and 3.47 times for men (Center et al., JAMA, 2007).
- Within 10 years of a first low-trauma fracture, 40% to 60% of surviving women and men aged 60 and over had another fracture (Center et al., JAMA, 2007).
- 18% of US women aged 65 and over on Medicare who had a fracture broke another bone within two years (Balasubramanian et al., Osteoporosis International, 2019).
- 31% of US women aged 65 and over on Medicare who had a fracture broke another bone within five years (Balasubramanian et al., Osteoporosis International, 2019).
- After a first fracture of the spine, hip, pelvis, femur or collarbone (women 65-74) or almost any fracture (women 75 and over), 7% to 14% of women on Medicare broke another bone within a year (Balasubramanian et al., Osteoporosis International, 2019).
- Among people who broke another bone after a first hip, spine, wrist or upper-arm fracture, 31% to 45% did so within a year of the first fracture (Kanis et al., Osteoporosis International, 2018).
- Over 10 years, 28% of people with a first hip fracture had another fracture, and 35% to 38% of those with a first spine, wrist or upper-arm fracture (Kanis et al., Osteoporosis International, 2018).
- 20.7% of Swedish women aged 50 and over had a major osteoporotic fracture within five years of a fragility fracture, against 12.3% of matched women; after two fractures the figure was 32.0% (Söreskog et al., Bone, 2020).
Other studies
- Fractures of the femur, pelvis, spine or upper arm were each associated with about five years of life lost when they occurred at age 50 (Tran et al., eLife, 2023).
- The Ontario study compares its 14.4% one-year mortality after a fragility fracture with a 9.7% one-year mortality after a heart attack among Canadians admitted to hospital in 2006-2010 (Brown et al., BMC Musculoskeletal Disorders, 2021).
Why the rib study is quoted two ways. Bulger and colleagues' widely cited study of rib fractures in older adults says in its conclusion that each extra broken rib raises the risk of pneumonia by 27%. Its own results give an odds ratio of 1.16 per rib, about 16%. We show the results figure; the 19% for death agrees in both parts of the paper.
Sources: BMC Musculoskeletal Disorders; The Lancet; JAMA (2001, 2007, 2009); Journal of Clinical Endocrinology & Metabolism; eLife (2023); Osteoporosis International (1999-2026); JBMR Plus; Injury (2011, 2025, 2026); Journal of Trauma (2000, 2003); Journal of Surgical Research; Journal of the American Geriatrics Society; Emergency Medicine Journal; Surgery; Canadian Journal of Surgery; Bone (2018, 2020); European Journal of Trauma and Emergency Surgery; Trauma Surgery & Acute Care Open (2017, 2024); JAMA Network Open; European Journal of Orthopaedic Surgery & Traumatology; Journal of Korean Medical Science; Acta Orthopaedica (2015, 2026); Geriatric Orthopaedic Surgery & Rehabilitation; Calcified Tissue International; Journal of Bone and Mineral Research (2000, 2009); Annals of the Rheumatic Diseases; Archives of Internal Medicine
12 / Recovery
Can elderly walk again after a hip fracture?
Only 40% to 60% of people who survive a hip fracture regain their previous mobility within a year (BMC Geriatrics, 2016).

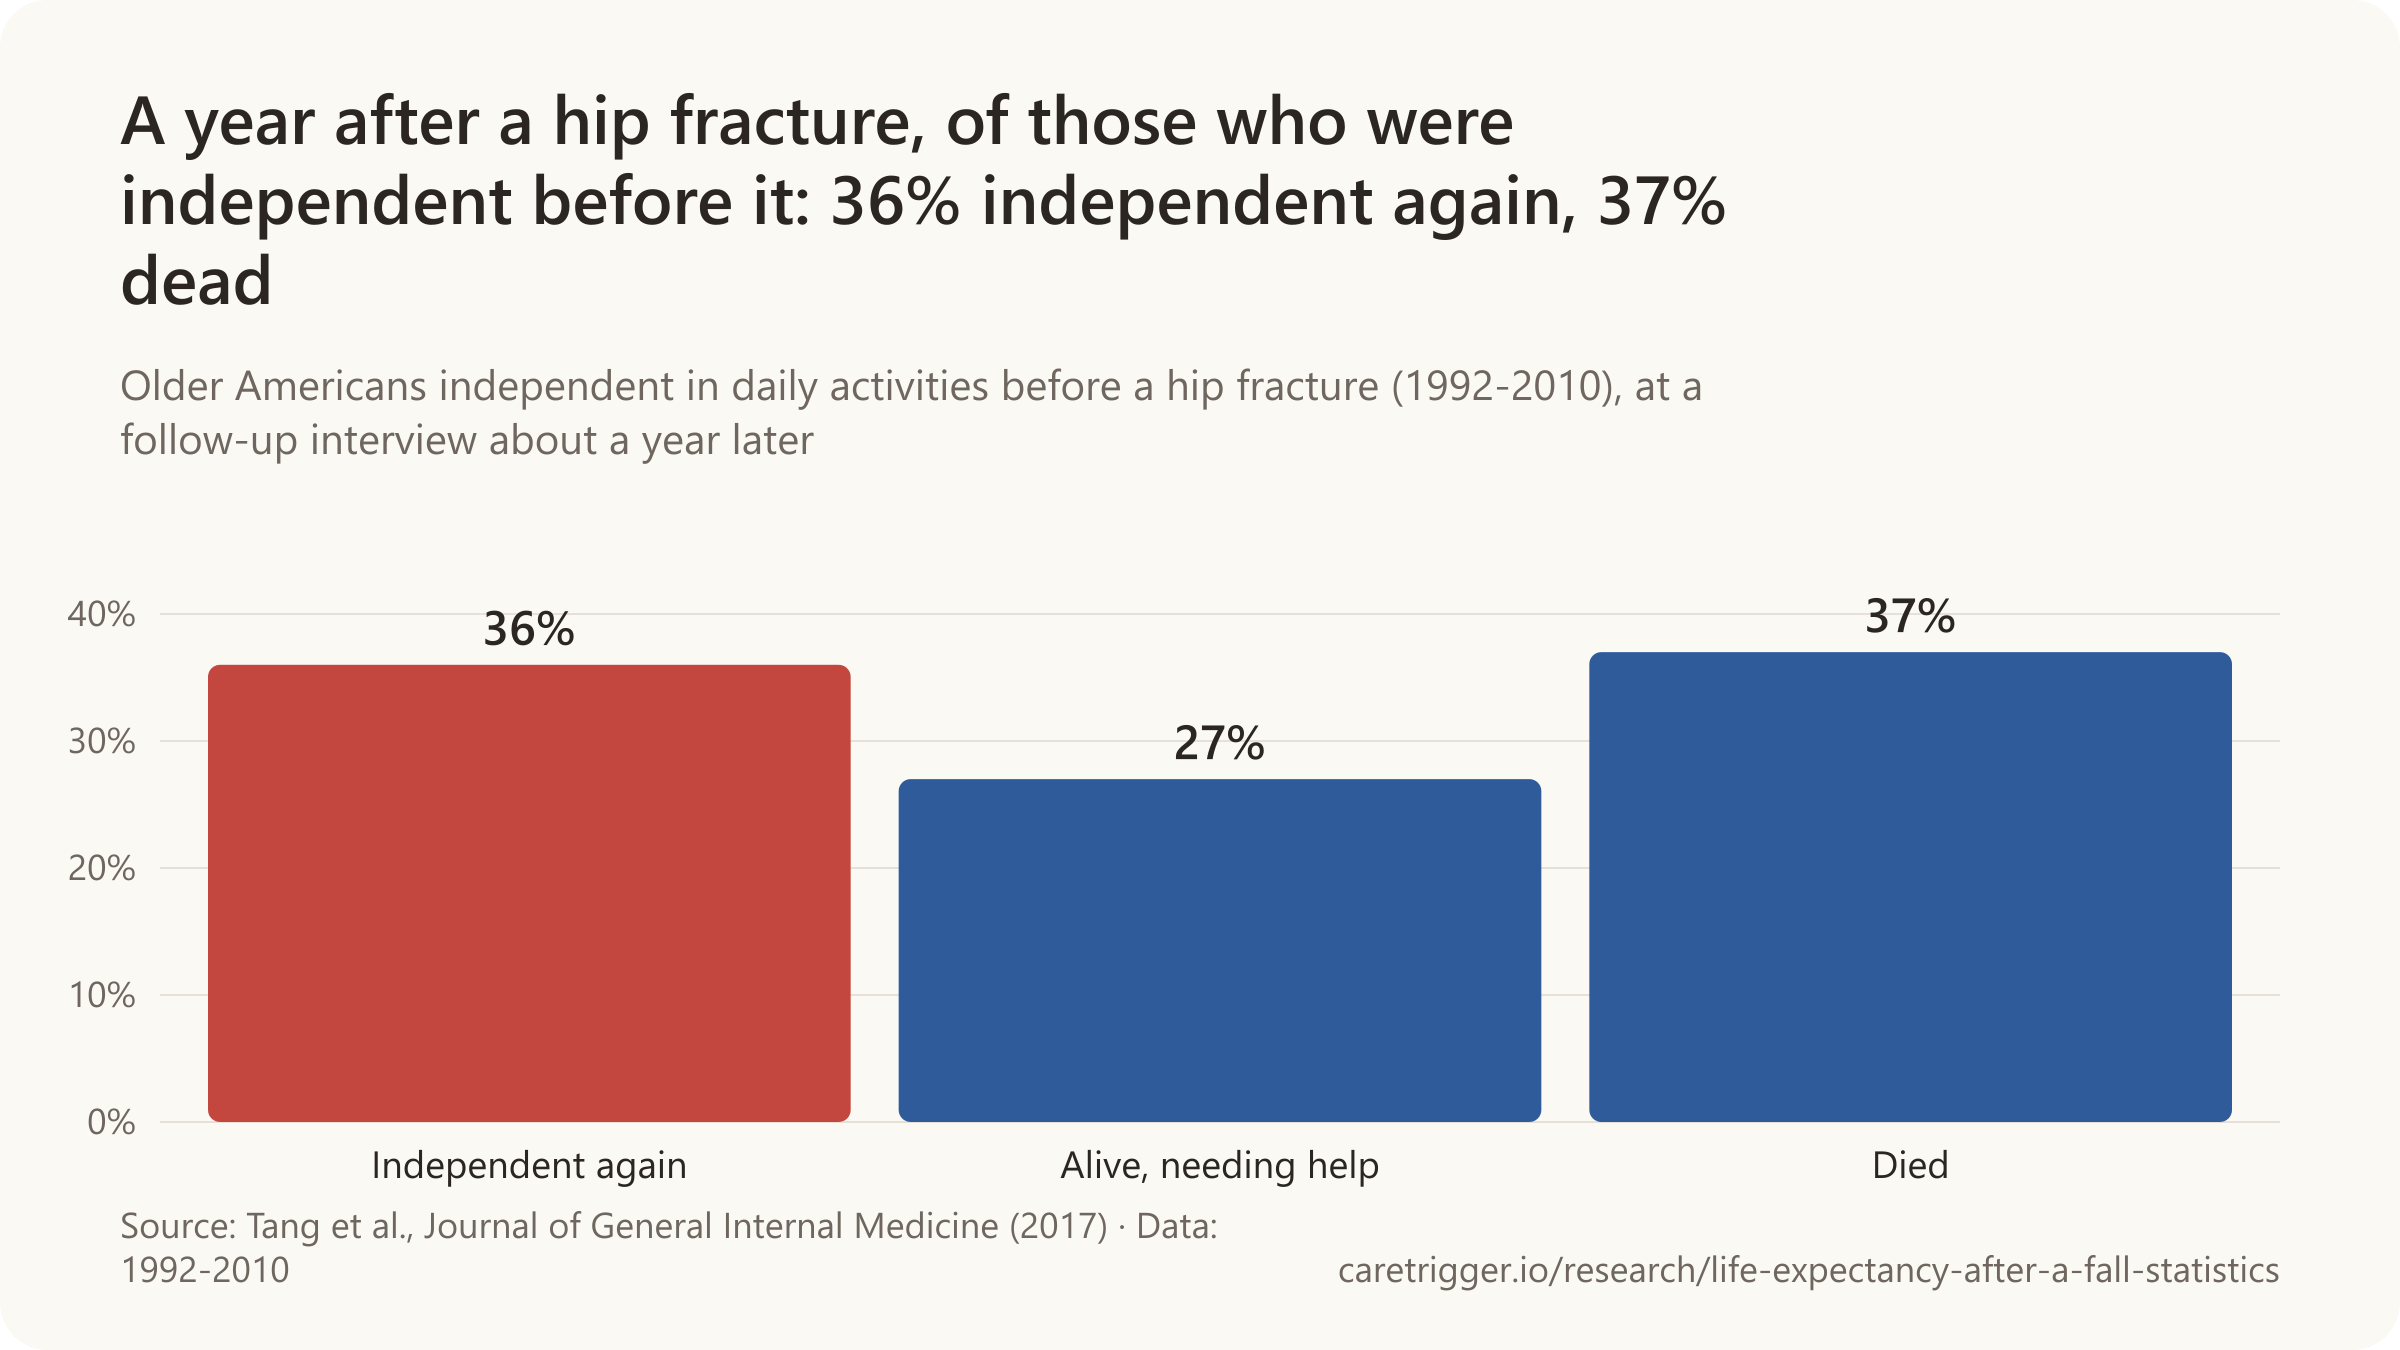
- Of Swedish hip-fracture patients who walked before, 10% could not walk at all four months later (2013-2015).
- In New Haven, 15% of older people could walk across a room unaided six months after a hip fracture, against 75% before it (1982-1988).
- In England, Wales and Northern Ireland, 75.0% of hip-fracture patients were back where they lived before within 120 days in 2025.
- Only 8% of hip-fracture patients with dementia regained independence in daily activities, against 39% without dementia (1992-2010).
- Between 42% and 71% of patients regain their former daily activities within six months of a hip fracture (2026).
| Country, measure and year | Share |
|---|---|
| Australia: back in their own home at 120 days, of those living at home before (2022) | 78% |
| New Zealand: back in their own home at 120 days, of those living at home before (2022) | 80% |
| Finland: alive and at home within 90 days (2022-2023) | 79.2% |
| Scotland: returned home within 30 days (2025) | 66% |
| Sweden, women 80 and older: in their own home at four months (2024) | 55% |
| Spain, 75 and older: living at home at one month (2023) | 49% |
| Greece: returned home after discharge | 60% |
| The Netherlands: discharged straight home (2024) | 31.8% |
| Ireland: discharged straight home from the acute hospital (2024) | 22% |
Sources: BMC Geriatrics; Journal of General Internal Medicine; Injury; Journal of the American Geriatrics Society; National Hip Fracture Database; JAMA; Australian and New Zealand Hip Fracture Registry; Finnish Institute for Health and Welfare, PERFECT; Public Health Scotland; RIKSHÖFT; Registro Nacional de Fracturas de Cadera; Cureus; Dutch Hip Fracture Audit, DICA; National Office of Clinical Audit
More statistics (225)
Between 40% and 60% of people who survive a hip fracture regain their pre-fracture level of mobility within one year, according to a review of 38 cohort studies (Dyer et al., BMC Geriatrics, 2016).
Most people who survive a hip fracture walk again, but many walk less well than before, need a stick or a frame, or can no longer go out alone. Most of the recovery comes in the first four to six months. Age, dementia and how well someone walked before the fracture predict recovery better than the fracture itself.
Walking again
- 10% of Swedish hip-fracture patients who could walk before the fracture were unable to walk at all four months later (Martinez-Carranza et al., Injury, 2022).
- 15% of older New Haven residents could walk across a room without help 6 months after a hip fracture, down from 75% before it, in a population cohort with pre-fracture data (Marottoli et al., Journal of the American Geriatrics Society, 1992).
- Among hip-fracture patients who walked independently before the fracture, 40% to 44% recovered that independence, in studies from the USA, the UK and the Netherlands (Dyer et al., BMC Geriatrics, 2016).
- Recovering the ability to walk 3 metres (10 feet) without help took about 14 months after a hip fracture, and chair-rise speed about 10 months, in a Baltimore cohort (Magaziner et al., 2000, as reported by Dyer et al., BMC Geriatrics, 2016).
- One year after a hip fracture, 56% of Belgian women over 80 could not walk independently, compared with 15% of women of the same age and residence without a fracture (Boonen et al., 2004, as reported by Dyer et al., BMC Geriatrics, 2016).
- One year after a hip fracture, 30% of Belgian women under 80 could not walk independently, compared with 7% of women of the same age and residence without a fracture (Boonen et al., 2004, as reported by Dyer et al., BMC Geriatrics, 2016).
- Two years after a hip fracture, 54% of older people in Auckland still got around in the community, compared with 87% of people of the same age and gender without a fracture (Norton et al., 2000, as reported by Dyer et al., BMC Geriatrics, 2016).
- In the Scottish Hip Fracture Audit, 22% of patients aged 75 to 89 regained their pre-fracture level of walking unaided and unaccompanied, compared with 2% of those aged 95 or older (Holt et al., 2008, as reported by Dyer et al., BMC Geriatrics, 2016).
- 34% of older Americans who broke a hip returned to their pre-fracture mobility (walking), measured about a year later in a national cohort (Tang et al., Journal of General Internal Medicine, 2017).
- 41% of older Americans who broke a hip returned to their pre-fracture stair-climbing ability, measured about a year later in a national cohort (Tang et al., Journal of General Internal Medicine, 2017).
- Of older Americans who could walk a block without difficulty before a hip fracture, 32% could still do so 6 months to 2.5 years later; 29% of those who climbed a flight of stairs without resting could still do so (Tang et al., Journal of General Internal Medicine, 2017).
- Of hip-fracture patients who could walk a block without difficulty beforehand, 19% of those aged 85 or older could do so again, compared with 41% of younger patients, adjusted for gender (Tang et al., Journal of General Internal Medicine, 2017).
- About 50% of hip-fracture patients had a walking disability 12 and 24 months after the fracture, compared with 21% to 29% of community-dwelling older people of the same age, gender and earlier walking ability; 26% of both groups had one before (Magaziner et al., American Journal of Epidemiology, 2003).
- 41% of previously walking hip-fracture patients from the community (137 of 336) kept their pre-fracture walking ability one year later (Koval et al., Clinical Orthopaedics and Related Research, 1995).
- 40% of previously walking hip-fracture patients from the community (134 of 336) still walked one year later but had become more dependent on walking aids (Koval et al., Clinical Orthopaedics and Related Research, 1995).
- 12% of 336 hip-fracture patients who had walked before the fracture (39 people) went from walking outside in the community to walking only within their home one year later (Koval et al., Clinical Orthopaedics and Related Research, 1995).
- 8% of previously walking hip-fracture patients from the community (26 of 336) could no longer walk functionally one year later (Koval et al., Clinical Orthopaedics and Related Research, 1995).
- One year after a hip fracture, 40% of patients are still unable to walk independently, according to a widely cited 1997 review (Cooper, American Journal of Medicine, 1997).
- 8% of older New Haven residents could climb a flight of stairs 6 months after a hip fracture, down from 63% before it, in a population cohort with pre-fracture data (Marottoli et al., Journal of the American Geriatrics Society, 1992).
- 6% of older New Haven residents could walk half a mile 6 months after a hip fracture, down from 41% before it, in a population cohort with pre-fracture data (Marottoli et al., Journal of the American Geriatrics Society, 1992).
- 48% (11 of 23) of surviving Canadian nursing-home residents who had walked before a hip fracture could no longer walk 12 months after it, and 35% walked independently (Beaupre et al., Journal of the American Geriatrics Society, 2012).
- 67% of Japanese hip-fracture patients had recovered their pre-fracture walking level one year after the injury (Kitamura et al., Clinical Orthopaedics and Related Research, 1998).
- 18.7% of Dutch hip-fracture patients aged 65+ who could walk before the fracture had become unable to walk one year after surgery; only about half had regained their pre-fracture mobility (Vochteloo et al., Geriatrics & Gerontology International, 2013).
- Between 40% and 60% of hip-fracture patients do not recover their pre-fracture mobility, and 30% to 60% do not regain independence in basic daily activities, as a 2023 review restates the 2016 Dyer review (Abelleyra Lastoria et al., European Geriatric Medicine, 2023).
- Two months after hip-fracture surgery, 14.4% to 15.2% of patients who had walked before the fracture could not walk about 10 feet (3 m) on their own or with a walker or cane, in a 1,600-patient trial (Neuman et al., New England Journal of Medicine, 2021).
- Among hip-fracture patients older than 95, 78.3% walked independently before the fracture and 36.8% six months after discharge (Barcelo et al., Journal of Clinical Medicine, 2026).
- Of hip-fracture patients older than 95 who walked independently before the fracture, 46.9% walked unaided again six months after discharge (Barcelo et al., Journal of Clinical Medicine, 2026).
- Half of Swedish hip-fracture patients who walked independently before the fracture had kept that walking ability four months later (Ek et al., JAMDA, 2024).
- 60% of Swedish hip-fracture patients who walked with help or an aid before the fracture kept that level of walking four months later (Ek et al., JAMDA, 2024).
- 22% of Swedish hip-fracture patients with dementia had completely lost the ability to walk four months later, compared with 7% of those without dementia (Linder et al., BMC Geriatrics, 2024).
- Among Swedish hip-fracture patients who walked outdoors alone before the fracture, dementia was associated with 2.34 times the odds of completely losing the ability to walk within four months (Linder et al., BMC Geriatrics, 2024).
- 25% of Swedish hip-fracture patients with dementia lost their ability to walk within four months, compared with 7% of those without cognitive problems (Martinez-Carranza et al., Injury, 2022).
- Men had 1.59 times the odds of losing the ability to walk within four months of a hip fracture, and patients discharged to institutional care 1.91 times (Martinez-Carranza et al., Injury, 2022).
- Six months after a hip fracture, 45% of Spanish survivors aged 65+ had not recovered their previous walking ability and 36% had not recovered their previous independence (Gonzalez Marcos et al., Journal of Clinical Medicine, 2022).
- Previous walking ability was restored in 39.6% of 1,425 Spanish hip-fracture patients (mean age 86) and worsened in 40.8% (Cordero-Ampuero et al., Injury, 2021).
- At hospital discharge, 48% of Spanish hip-fracture patients over 90 could not walk and none walked independently, although 62% had walked independently or with one stick before (Jimenez-Mola et al., Revista da Associação Médica Brasileira, 2025).
- Half of hip-fracture patients will be unable to walk without assistance afterwards, according to a widely cited 1995 review (Riggs & Melton, Bone, 1995).
Daily activities
- 8% of hip-fracture patients with dementia returned to independence in daily activities, compared with 39% of those without dementia, in a US national cohort (Tang et al., Journal of General Internal Medicine, 2017).
- Approximately 42% to 71% of patients regain their pre-fracture level of basic activities of daily living within six months of a hip fracture, a range across studies (Johannesdottir et al., JAMA, 2026).
- Between 40% and 70% of hip-fracture survivors regain their pre-fracture independence in basic activities of daily living, according to a review of 38 cohort studies (Dyer et al., BMC Geriatrics, 2016).
- Between 40% and 60% of people in hip-fracture cohort studies recovered their pre-fracture ability to perform instrumental activities of daily living, such as shopping and housework (Dyer et al., BMC Geriatrics, 2016).
- Among people who were independent in self-care before a hip fracture, 20% to 60% needed help with various self-care tasks one and two years after it (Dyer et al., BMC Geriatrics, 2016).
- While about 60% to 75% of hip-fracture patients are independent in basic activities of daily living before the fracture, 40% to 60% are afterwards, in studies with repeated measurements (Dyer et al., BMC Geriatrics, 2016).
- In a Norwegian study, half of the hip-fracture patients who lived at home without help before the fracture were receiving help at home one year later (Osnes et al., 2004, as reported by Dyer et al., BMC Geriatrics, 2016).
- Six months after a hip fracture, 73% of Canadian patients who had lived in the community were independent in dressing, compared with 9% of those admitted from long-term care (Beaupre et al., as reported by Dyer et al., BMC Geriatrics, 2016).
- In a Baltimore cohort of hip-fracture patients from the community, 34% were fully independent in instrumental activities of daily living before the fracture and 14% one year later (Magaziner et al., 1990, as reported by Dyer et al., BMC Geriatrics, 2016).
- In a UK cohort of 1,000 hip fractures, participation in shopping fell from 54% of patients before the fracture to 33% of survivors one year later (Keene et al., 1993, as reported by Dyer et al., BMC Geriatrics, 2016).
- One and two years after a hip fracture, 53% of Baltimore patients who had been independent before it needed help to reach places out of walking distance, or could not reach them (Magaziner et al., as reported by Dyer et al., BMC Geriatrics, 2016).
- One and two years after a hip fracture, almost 30% of Baltimore patients who had managed their medications on their own before it needed help to do so (Magaziner et al., as reported by Dyer et al., BMC Geriatrics, 2016).
- 31% of older Americans who broke a hip returned to their pre-fracture level of independence in activities of daily living, measured about a year later in a national cohort (Tang et al., Journal of General Internal Medicine, 2017).
- Of older Americans who were independent in activities of daily living before a hip fracture, 36% returned to independence by a follow-up interview held on average about a year later (Tang et al., Journal of General Internal Medicine, 2017).
- Of older Americans who were independent in activities of daily living before a hip fracture, 27% survived but needed help with daily activities by a follow-up interview held on average about a year later (Tang et al., Journal of General Internal Medicine, 2017).
- Of older Americans who were independent in activities of daily living before a hip fracture, 37% died by a follow-up interview held on average about a year later (Tang et al., Journal of General Internal Medicine, 2017).
- 26% of hip-fracture patients aged 85 or older returned to independence in daily activities, compared with 44% of those younger than 85, in a US national cohort (Tang et al., Journal of General Internal Medicine, 2017).
- 23% of hip-fracture patients with several other illnesses (Charlson score above 2) returned to independence in daily activities, compared with 44% of those with fewer (Tang et al., Journal of General Internal Medicine, 2017).
- Men were less likely than women to return to independence in daily activities after a hip fracture: 27% vs 38%, adjusted for age (Tang et al., Journal of General Internal Medicine, 2017).
- 89.9% of hip-fracture patients who had climbed five stairs without help or equipment before the fracture became newly dependent for it, the highest share of any task in a Baltimore cohort (Magaziner et al., Journals of Gerontology, 2000).
- 20.3% of hip-fracture patients who put on their trousers without help before the fracture became newly dependent for it, the lowest share of any task in a Baltimore cohort (Magaziner et al., Journals of Gerontology, 2000).
- One year after a hip fracture, 60% of patients have difficulty with at least one essential activity of daily living, according to a widely cited 1997 review (Cooper, American Journal of Medicine, 1997).
- One year after a hip fracture, 80% of patients are restricted in activities such as driving and grocery shopping, according to a widely cited 1997 review (Cooper, American Journal of Medicine, 1997).
- 49% of older New Haven residents could dress without help 6 months after a hip fracture, down from 86% before it, in a population cohort with pre-fracture data (Marottoli et al., Journal of the American Geriatrics Society, 1992).
- 32% of older New Haven residents could get in and out of a bed or chair without help 6 months after a hip fracture, down from 90% before it, in a population cohort with pre-fracture data (Marottoli et al., Journal of the American Geriatrics Society, 1992).
- 53.1% of older Americans who survived a hip fracture had more difficulty with mobility (walking and moving around) than in the survey interview before the fracture (Bentler et al., American Journal of Epidemiology, 2009).
- 51.2% of older Americans who survived a hip fracture had more difficulty with basic activities of daily living than in the survey interview before the fracture (Bentler et al., American Journal of Epidemiology, 2009).
- 44.9% of older Americans who survived a hip fracture had more difficulty with instrumental activities of daily living than in the survey interview before the fracture (Bentler et al., American Journal of Epidemiology, 2009).
- 43% of Oslo hip-fracture patients lost their pre-fracture ability to go outside on their own (Osnes et al., Osteoporosis International, 2004).
- 28% of Oslo hip-fracture patients lost the ability to cook their own dinner after the fracture (Osnes et al., Osteoporosis International, 2004).
- One year after a first hip fracture, 51% of Olmsted County residents were more disabled than before, compared with 16% of matched residents without a fracture (Leibson et al., Journal of the American Geriatrics Society, 2002).
- 29% of older hip-fracture patients do not get back to their pre-fracture level of daily activities one year after the fracture, and those who recover do so at around 6 months, according to a literature review (Bertram et al., Injury Prevention, 2011).
- Global Burden of Disease estimates had assumed that only 5% of hip fractures lead to long-term disability; using the evidence instead gave 4.5 times as many years lived with disability (8,251 in Australia in 2003) (Bertram et al., Injury Prevention, 2011).
- 15% of older women who broke a wrist (41 of 268) had a clinically important decline in daily functioning afterwards, compared with 12.2% of women without a wrist fracture (Edwards et al., BMJ, 2010).
- A wrist fracture was associated with 48% higher odds of a clinically important functional decline in older women (OR 1.48, 95% CI 1.04-2.12) after adjustment for age, health, baseline function and other factors (Edwards et al., BMJ, 2010).
- In the same cohort of older women, an incident hip fracture was associated with nearly five times the odds of a clinically important functional decline (OR 4.86, 95% CI 3.32-7.12) (Edwards et al., BMJ, 2010).
- After adjustment for age and other illnesses, a hip fracture accounted for a 24% decline in older Belgian women's functional status in the first year (Boonen et al., Osteoporosis International, 2004).
- Two years after a hip fracture, older people in Auckland were 4.2 times more likely than people without one to be unable to get around in the community (95% CI 2.8-6.2), after allowing for earlier illness and disability (Norton et al., Disability and Rehabilitation, 2000).
- Two years after a hip fracture, older people in Auckland were 2.6 times more likely than people without one to be functionally dependent (95% CI 1.7-4.1) (Norton et al., Disability and Rehabilitation, 2000).
- Two years after a hip fracture, older people spent 2.9 hours a day on their feet on average, compared with 3.5 hours for people without a fracture (Norton et al., Disability and Rehabilitation, 2000).
- Women with a lumbar (lower-back) vertebral fracture reported an average of 158.5 days of limited activity and 25.8 days in bed because of the fracture, the most of any fracture type (Fink et al., Osteoporosis International, 2003).
- Every woman with a hip fracture (100%) reported days of limited activity afterwards and 94% spent days in bed because of it, the highest shares of any fracture type (Fink et al., Osteoporosis International, 2003).
Back home or into care
- In Western countries, 10% to 20% of hip-fracture patients are newly admitted to residential care within 6 to 12 months of the fracture (Dyer et al., BMC Geriatrics, 2016).
- In a small Swedish study of patients from the community, about 80% of hip-fracture survivors were living in their own homes 4 months after the fracture, a share that stayed roughly constant for 10 years (Borgquist et al., as reported by Dyer et al., BMC Geriatrics, 2016).
- In Japan, the share of hip-fracture patients living in residential care barely changed: 5% before the fracture and 7% one and two years after it (Kitamura et al., as reported by Dyer et al., BMC Geriatrics, 2016).
- 27% of hip-fracture patients enter a nursing home for the first time in the year after the fracture, according to a widely cited 1997 review (Cooper, American Journal of Medicine, 1997).
- 60.5% of US nursing-home residents who were not totally dependent for moving around died or became totally dependent within a year of a hip fracture (Neuman et al., JAMA Internal Medicine, 2014).
- Of US nursing-home residents who moved around fully independently before a hip fracture, 21.0% were alive and still independent 180 days later (Neuman et al., JAMA Internal Medicine, 2014).
- 26.5% of US nursing-home residents who survived a year after a hip fracture, and who had moved around at least partly on their own before it, were totally dependent for moving around at one year (Neuman et al., JAMA Internal Medicine, 2014).
- 58% of older Americans hospitalised for a hip fracture were discharged to a nursing facility, mostly for skilled nursing care, in a national cohort with a mean age of 85 (Bentler et al., American Journal of Epidemiology, 2009).
- Only 14% of older Americans hospitalised for a hip fracture went straight home from hospital, in a national cohort with a mean age of 85 (Bentler et al., American Journal of Epidemiology, 2009).
- 48.2% of older Americans with a hip fracture in 1993-1996 were discharged to a nursing facility (Bentler et al., American Journal of Epidemiology, 2009).
- 20.1% of older Americans with a hip fracture in 1993-1996 were discharged home from hospital (Bentler et al., American Journal of Epidemiology, 2009).
- 62.6% of older Americans with a hip fracture in 1997-2001 were discharged to a nursing facility (Bentler et al., American Journal of Epidemiology, 2009).
- 11.1% of older Americans with a hip fracture in 1997-2001 were discharged home from hospital (Bentler et al., American Journal of Epidemiology, 2009).
- 60.7% of older Americans with a hip fracture in 2002-2005 were discharged to a nursing facility (Bentler et al., American Journal of Epidemiology, 2009).
- 10.8% of older Americans with a hip fracture in 2002-2005 were discharged home from hospital (Bentler et al., American Journal of Epidemiology, 2009).
- Half (49%) of older Americans discharged to a nursing facility after a hip fracture were back home at 90 days, and 96% of them were still home at 180 days (Bentler et al., American Journal of Epidemiology, 2009).
- 34% of older Americans discharged to a nursing facility after a hip fracture were still there at 90 days; of these, 81% remained at 180 days and 17% had died (Bentler et al., American Journal of Epidemiology, 2009).
- Half of older Americans who broke a hip in a national cohort of the oldest old (mean age 85) lived alone (Bentler et al., American Journal of Epidemiology, 2009).
- 6% of Oslo hip-fracture patients under 75 who had lived in their own homes moved to a nursing home after the fracture, compared with 33% of those over 85 (Osnes et al., Osteoporosis International, 2004).
- 33% of Oslo hip-fracture patients over 85 who had lived in their own homes moved to a nursing home after the fracture, compared with 6% of those under 75 (Osnes et al., Osteoporosis International, 2004).
- 64% of Olmsted County residents with a first hip fracture had a first nursing-home admission within a year, compared with 7% of matched residents without a fracture (Leibson et al., Journal of the American Geriatrics Society, 2002).
- Compared with matched residents without a fracture, people with a hip fracture had 20 times the risk of nursing-home admission at 3 months and still 2.1 times the risk at 5 years (Leibson et al., Journal of the American Geriatrics Society, 2002).
- 19% of Belgian women were newly admitted to a nursing home in the year after a hip fracture, compared with 4% of matched women without a fracture (Autier et al., Osteoporosis International, 2000).
- 27% of community-living people in western Sydney were permanently admitted to an aged-care home (nursing home or hostel) after a hip fracture, compared with 5% of controls, over a median 14 months (Cumming et al., Australian and New Zealand Journal of Public Health, 1996).
- A hip fracture was associated with four times the risk of permanent admission to an aged-care home (HR 4.0, 95% CI 1.7-9.5) after adjusting for multiple health factors, in western Sydney (Cumming et al., Australian and New Zealand Journal of Public Health, 1996).
- 52.1% of men in Auckland were dead or living in an institution two years after a hip fracture, compared with 12.4% of male controls (Fransen et al., Journal of the American Geriatrics Society, 2002).
- 39.2% of women in Auckland were dead or living in an institution two years after a hip fracture, compared with 19.7% of female controls (Fransen et al., Journal of the American Geriatrics Society, 2002).
- After adjustment for earlier health and physical function, a hip fracture was associated with 6.89 times the odds of being dead or institutionalised within two years for men but 1.48 times for women (Fransen et al., Journal of the American Geriatrics Society, 2002).
- 3.6% of German women aged 65 to 69 entered a nursing home within six months of hospital discharge after a femoral (thigh-bone) fracture, rising to 34.8% of women aged 95 and over (Rapp et al., JAMDA, 2015).
- 34.8% of German women aged 95 and over entered a nursing home within six months of hospital discharge after a femoral (thigh-bone) fracture, compared with 3.6% of women aged 65 to 69 (Rapp et al., JAMDA, 2015).
- For German men, the age-standardised risk of nursing-home admission within six months was almost as high after a femoral fracture as after a stroke: 7.5% vs 8.0% (Rapp et al., JAMDA, 2015).
- 71% of Canadian hip-fracture patients who lived in the community had regained their pre-fracture function six months later, compared with 22% of those from long-term care (Beaupre et al., Journals of Gerontology, 2007).
- 22% of Canadian hip-fracture patients admitted from long-term care had regained their pre-fracture function six months later, compared with 71% of those from the community (Beaupre et al., Journals of Gerontology, 2007).
- 81% of Japanese hip-fracture patients went back to the place they had lived before the fracture, after an average hospital stay of 67 days (Kitamura et al., Clinical Orthopaedics and Related Research, 1998).
- 34% of older patients with a pubic rami (pelvic) fracture were discharged to an institution rather than home (Loggers et al., European Journal of Trauma and Emergency Surgery, 2019).
- 49% of older patients with a pubic rami (pelvic) fracture lost their independent mobility, and 40% did not fully recover (Loggers et al., European Journal of Trauma and Emergency Surgery, 2019).
- After adjustment for age, function and illnesses, older women's risk of moving into a nursing home within six months of a pelvic fracture was similar to that after a hip fracture (RR 0.94, 95% CI 0.86-1.02) (Benzinger et al., Osteoporosis International, 2019).
- After adjustment for age, function and illnesses, older women's risk of moving into a nursing home within six months of a spine fracture was similar to that after a hip fracture (RR 0.95, 95% CI 0.87-1.03) (Benzinger et al., Osteoporosis International, 2019).
- 31.6% of Canadians aged 65+ who lived in the community before hip-fracture surgery went home from the surgical hospital (2004-2012) (Beaupre et al., Osteoporosis International, 2019).
- 22.5% of Canadians aged 65+ who lived in the community before hip-fracture surgery went to a rehabilitation unit (2004-2012) (Beaupre et al., Osteoporosis International, 2019).
- 27.0% of Canadians aged 65+ who lived in the community before hip-fracture surgery were moved to another acute-care hospital (2004-2012) (Beaupre et al., Osteoporosis International, 2019).
- 18.2% of Canadians aged 65+ who lived in the community before hip-fracture surgery were discharged to continuing (long-term) care (2004-2012) (Beaupre et al., Osteoporosis International, 2019).
- The share of Canadian hip-fracture patients discharged home ranged from 20.3% in Prince Edward Island to 52.2% in British Columbia (Beaupre et al., Osteoporosis International, 2019).
- 31% of older Americans sent to a skilled nursing facility after a first hip fracture were back in the community within 30 days and stayed there at least 30 days (Gozalo et al., Journal of the American Geriatrics Society, 2015).
- Successful return home from a skilled nursing facility after a hip fracture was 43.7% in facilities with more than 24 hip-fracture admissions a year, versus 18.8% in those with 1 to 6 (Gozalo et al., Journal of the American Geriatrics Society, 2015).
- 71.7% of Medicare fee-for-service hip-fracture patients admitted to a skilled nursing facility returned to the community within 100 days and stayed there at least 30 days (Kumar et al., PLOS Medicine, 2018).
- 6.8% of Medicare fee-for-service hip-fracture patients admitted to a skilled nursing facility from the community became long-stay residents (more than 100 days) (Kumar et al., PLOS Medicine, 2018).
- 3.2% of Danish hip-fracture patients aged 60 to 69 who lived in the community moved into a nursing home within a year of discharge (Wahlsten et al., Injury, 2020).
- 22.4% of Danish hip-fracture patients aged 90 to 100 who lived in the community moved into a nursing home within a year of discharge (Wahlsten et al., Injury, 2020).
- Among Danish hip-fracture patients aged 60 to 69, living alone was associated with 9.22 times the rate of nursing-home admission within a year, and dementia with 6.73 times (Wahlsten et al., Injury, 2020).
- Among Danish hip-fracture patients aged 90 and over, living alone was associated with 2.75 times the rate of nursing-home admission within a year, and dementia with 2.15 times (Wahlsten et al., Injury, 2020).
- 34% of low-income older Americans (on both Medicare and Medicaid) who broke a hip while living in the community were admitted to a nursing home within a year, and 25% died (Blackburn et al., Osteoporosis International, 2016).
- 65% of hip-fracture patients in England and Wales who lived in their own home before the fracture were discharged home from hospital (Hawley et al., Age and Ageing, 2022).
- In a small French cohort, post-operative delirium was associated with 5.23 times the odds of new institutionalisation three months after hip-fracture surgery, which affected 20.6% of patients (Labaste et al., Frontiers in Medicine, 2023).
- Older Spanish hip-fracture patients who lived alone before the fracture had 3.95 times the odds of a new admission to an institution (Uriz-Otano et al., Maturitas, 2016).
- 76.0% of Japanese hip-fracture patients who had lived alone (136 of 179) returned home after inpatient rehabilitation, compared with 87.1% of those who had lived with family (Oishi et al., Archives of Rehabilitation Research and Clinical Translation, 2026).
- 87.1% of Japanese hip-fracture patients who had lived with family (317 of 364) returned home after inpatient rehabilitation (Oishi et al., Archives of Rehabilitation Research and Clinical Translation, 2026).
- 63% of Medicare hip-fracture patients went from hospital to a skilled nursing facility, 19% to inpatient rehabilitation and only 10% home, in 2001-2005 (Nguyen-Oghalai et al., Journal of the American Geriatrics Society, 2008).
- 69% of Medicare hip-fracture patients discharged to inpatient rehabilitation were at home about 40 days after the fracture, compared with 45% of those discharged to a skilled nursing facility (Nguyen-Oghalai et al., Journal of the American Geriatrics Society, 2008).
- The share of Medicare hip-fracture patients discharged straight home fell from 12.5% in 2001 to 8.8% in 2005, while discharge to inpatient rehabilitation rose from 12.2% to 23.9% (Nguyen-Oghalai et al., Journal of the American Geriatrics Society, 2008).
- 67.8% of older Americans who received post-acute care after a hip fracture got it in a skilled nursing facility, 16.1% in an inpatient rehabilitation facility and 16.2% through home health care (Riester et al., BMC Medicine, 2023).
- 40% of Swedish hip-fracture patients without dementia went home from hospital, compared with 7% of those with dementia (Linder et al., BMC Geriatrics, 2024).
- One year after a hip fracture, 54% of German patients over 60 (168 of 312) were alive and not living in an institution (Buecking et al., Medicine, 2017).
- One year after a hip fracture, 13% of German patients over 60 (40 of 312) were living in a nursing home (Buecking et al., Medicine, 2017).
- One year after a hip fracture, 33% of German patients over 60 (104 of 312) had died (Buecking et al., Medicine, 2017).
- 30.2% of hip-fracture patients aged 100 or over who had lived in their own home were discharged to a nursing home, compared with 8.7% of patients under 80 (Pass et al., Journal of Clinical Medicine, 2024).
- 40.1% of community-dwelling Ontarians with dementia who had hip-fracture surgery received no rehabilitation afterwards; home or inpatient rehabilitation was associated with a lower risk of long-term care admission (Seitz et al., Journal of the American Geriatrics Society, 2016).
- 18.7% of aged-care residents hospitalised with a fall-related hip fracture in New South Wales had in-hospital rehabilitation, compared with 60.9% of older people from the community (Mitchell et al., Osteoporosis International, 2019).
- A quarter of hip-fracture patients will require long-term care, according to a widely cited 1995 review (Riggs & Melton, Bone, 1995).
- Older Americans without dementia spent 267 days alive at home, on average, in the 365 days after a hip fracture, in Medicare data for 1.85 million patients (Rodin et al., conference abstract, Innovation in Aging, 2025).
- Older Americans with dementia spent 181 days alive at home, on average, in the 365 days after a hip fracture, 86 fewer than those without dementia (Rodin et al., conference abstract, Innovation in Aging, 2025).
- Older Americans with dementia spent 37 days in a nursing home, on average, in the year after a hip fracture, compared with 11 days for those without dementia (Rodin et al., conference abstract, Innovation in Aging, 2025).
In national registries

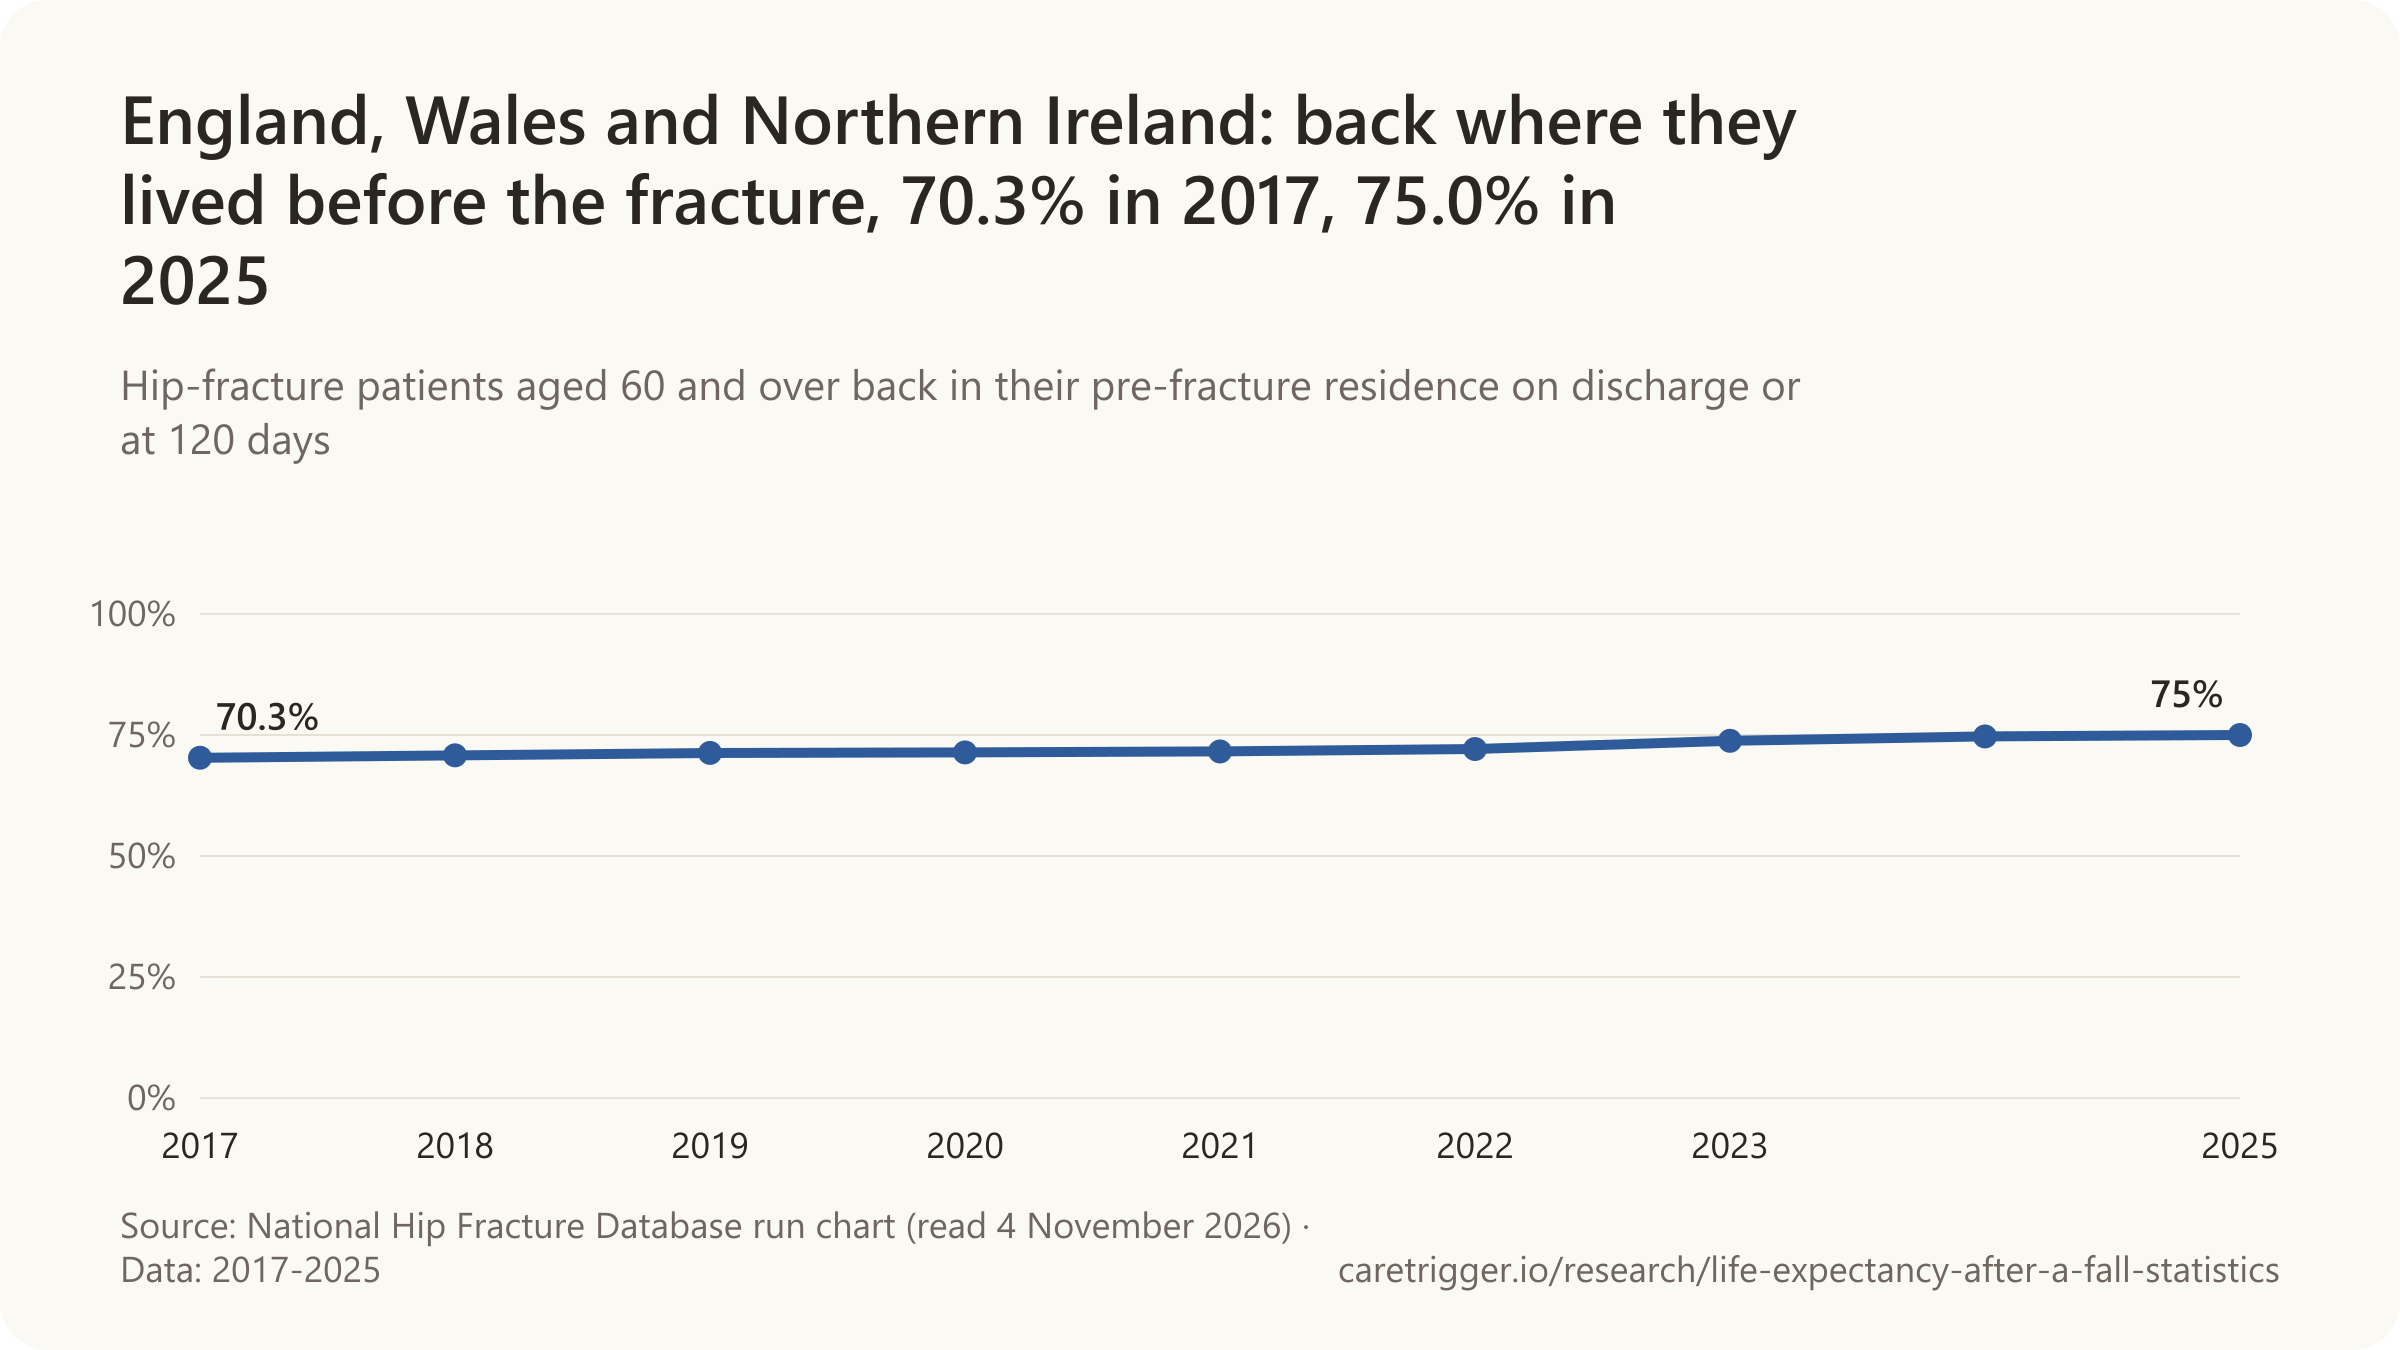

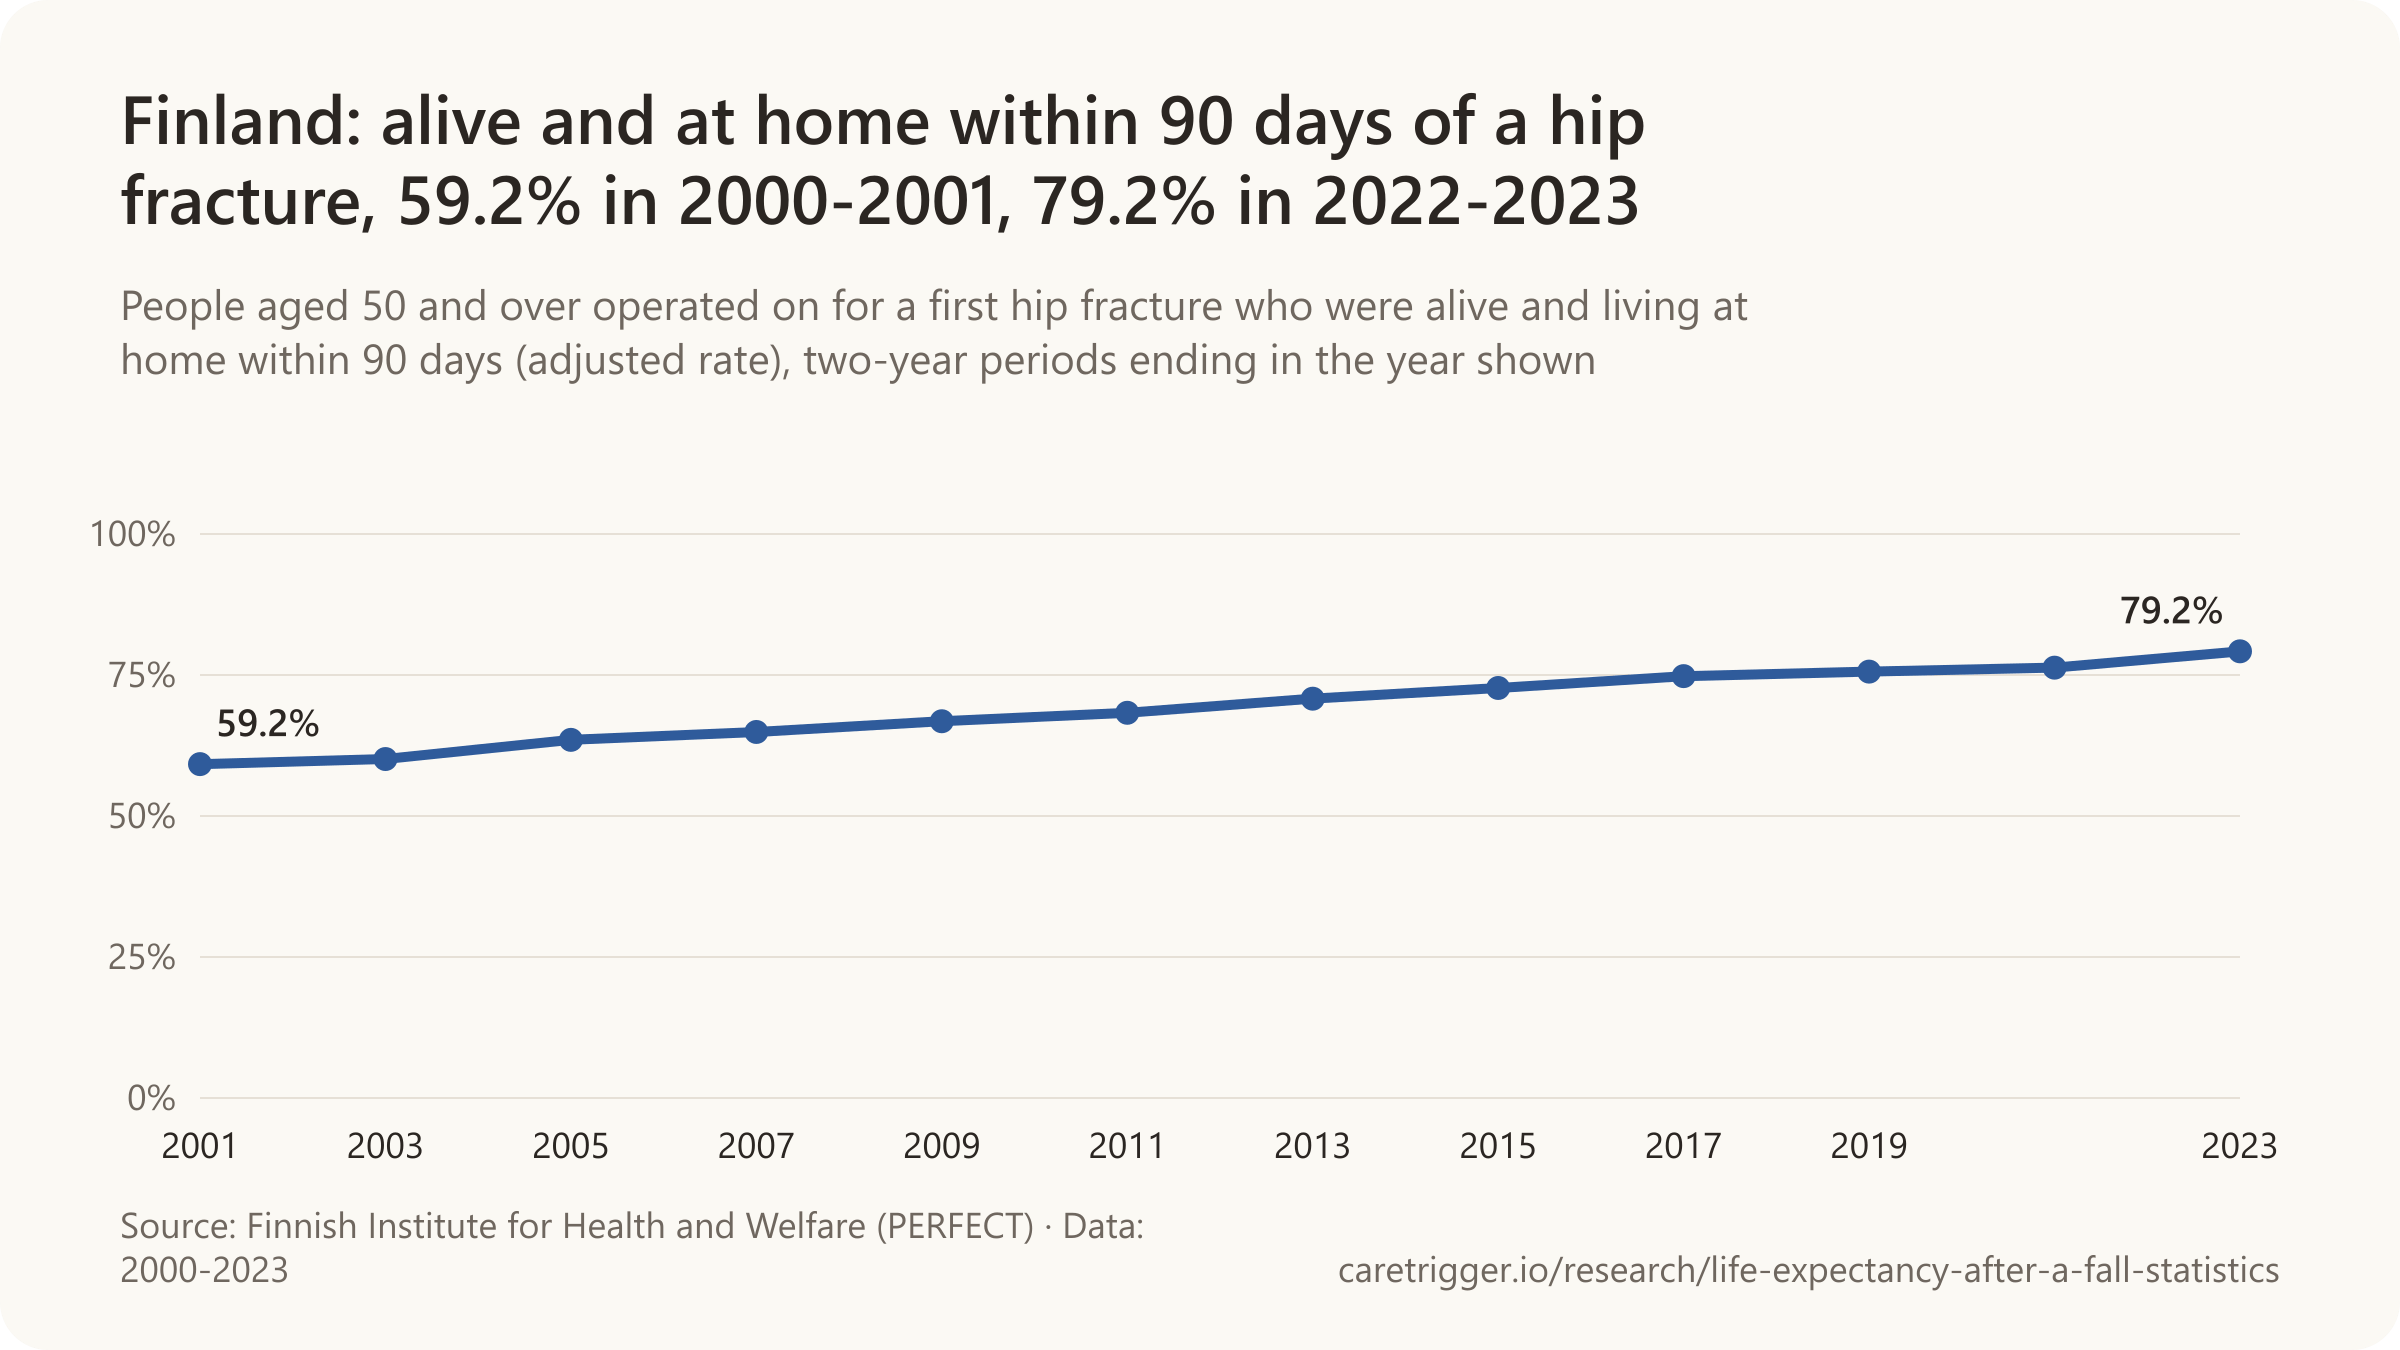
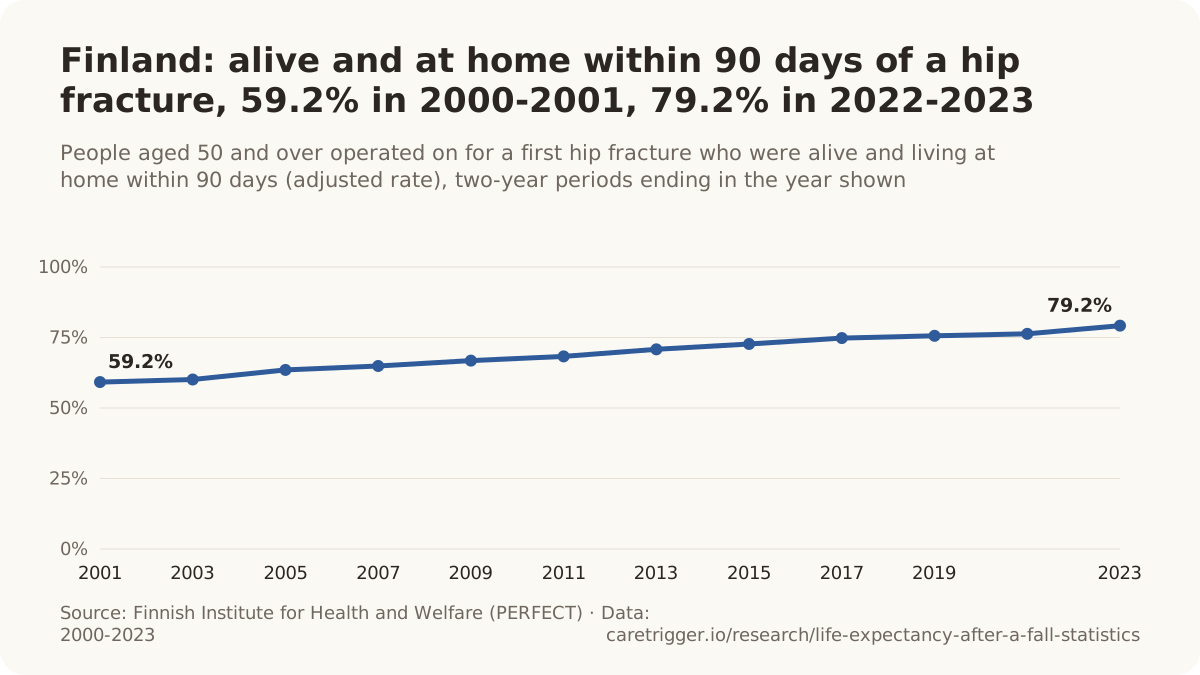

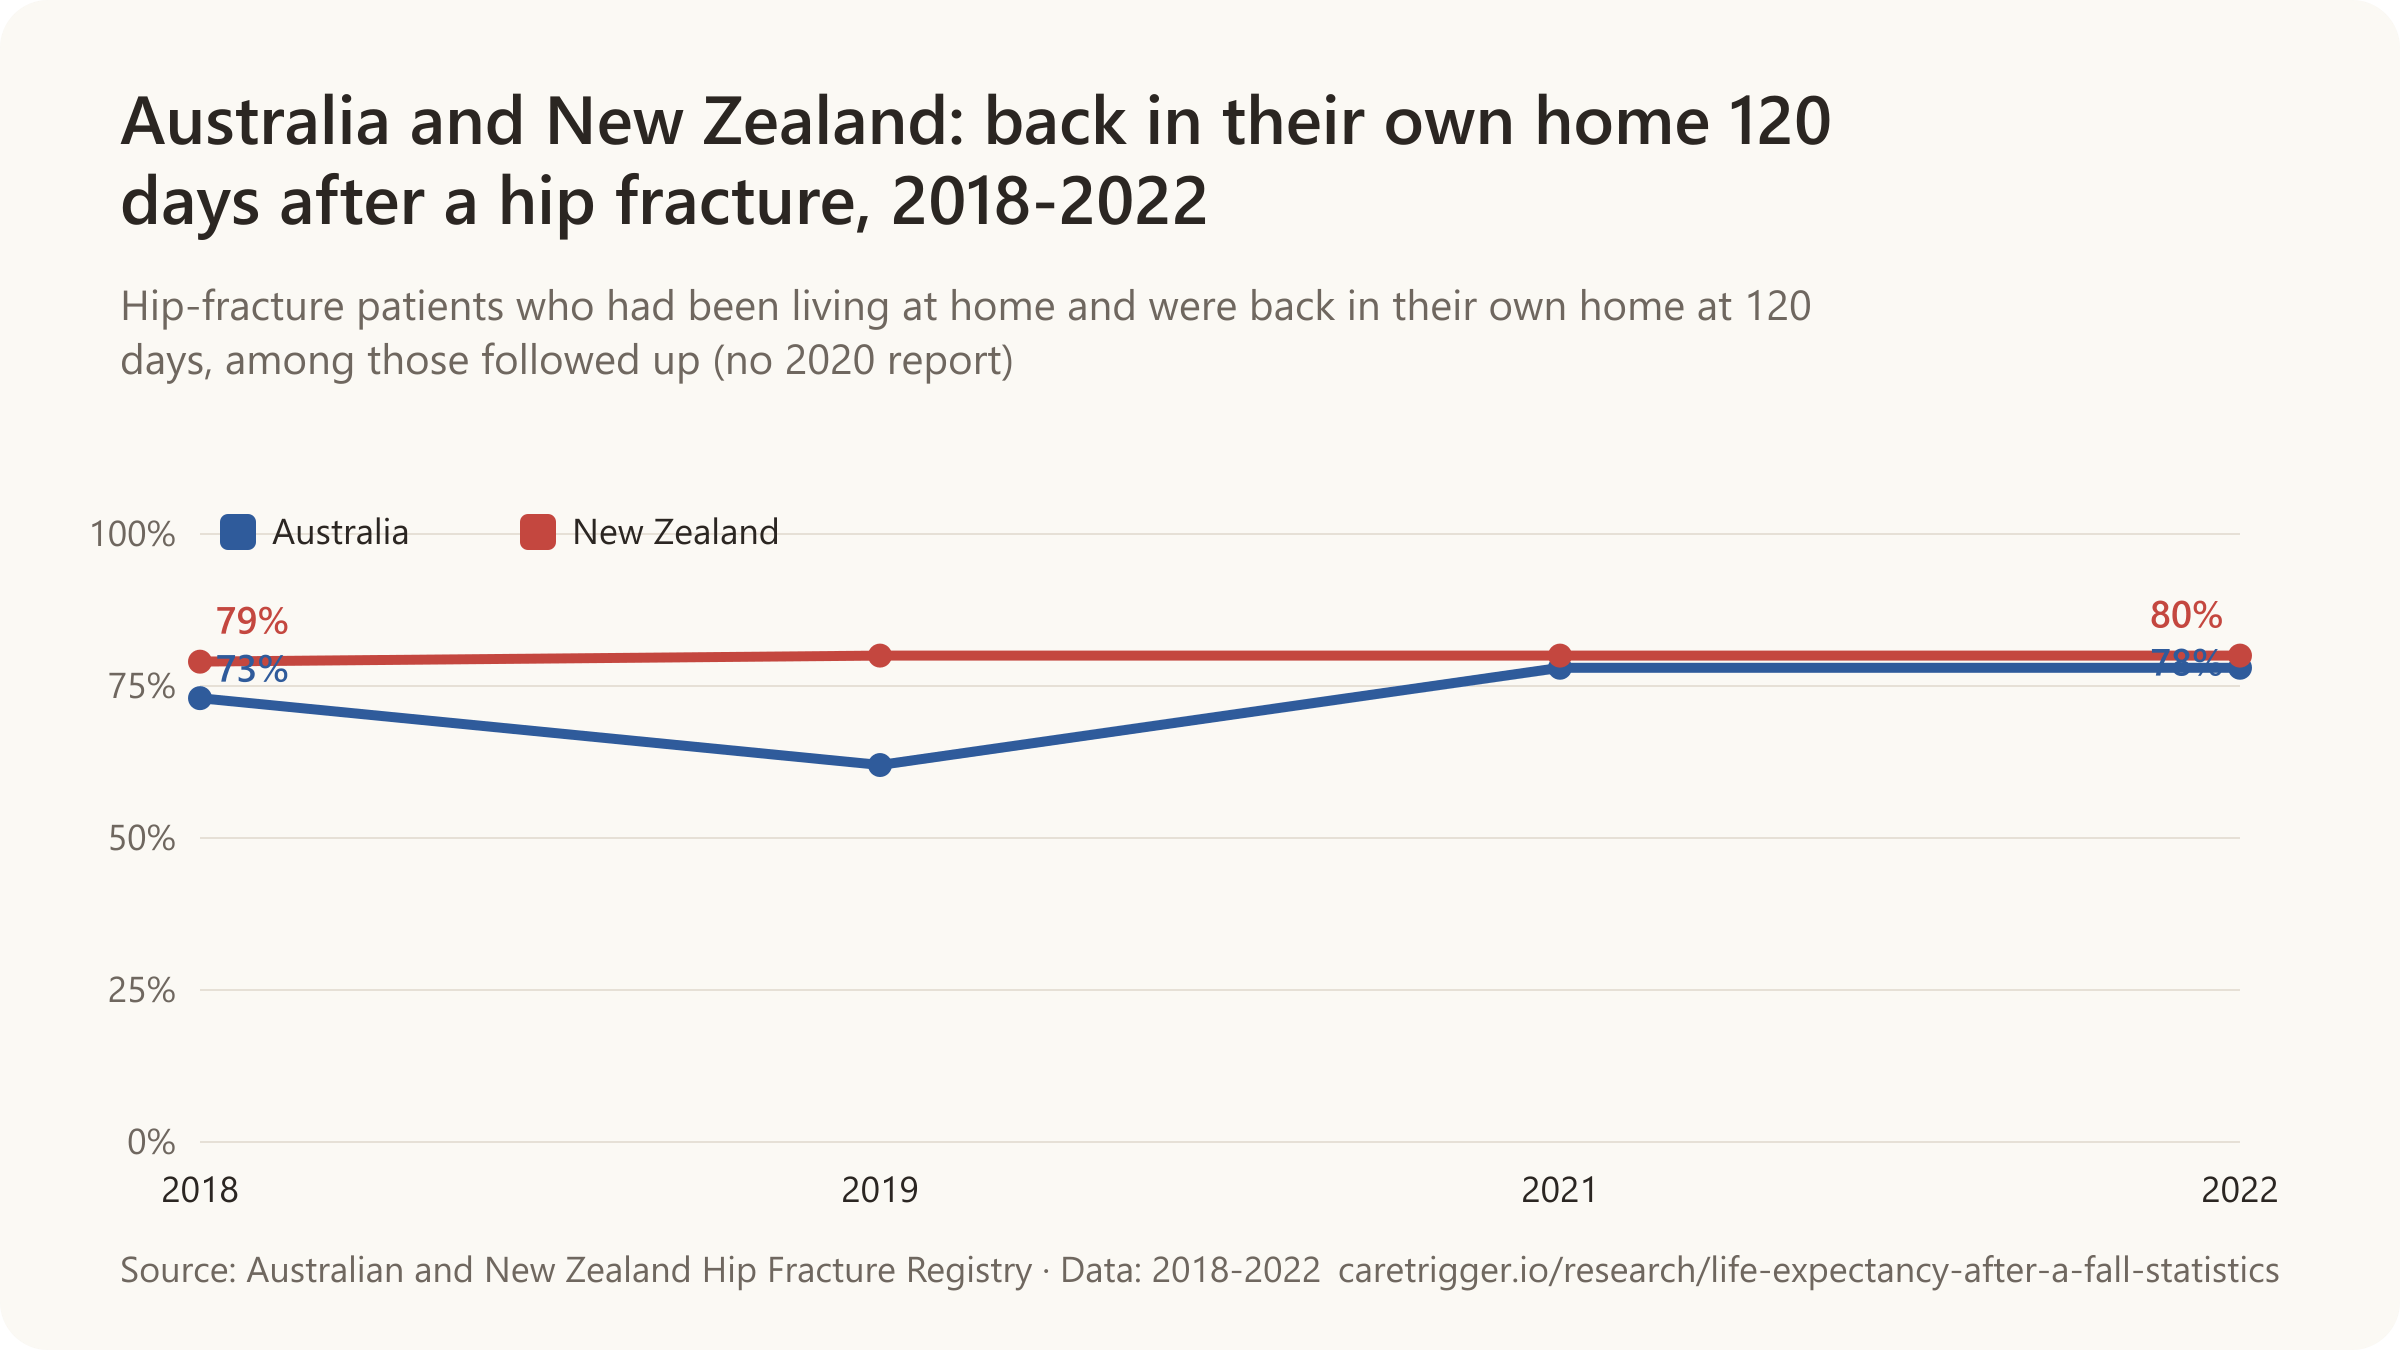
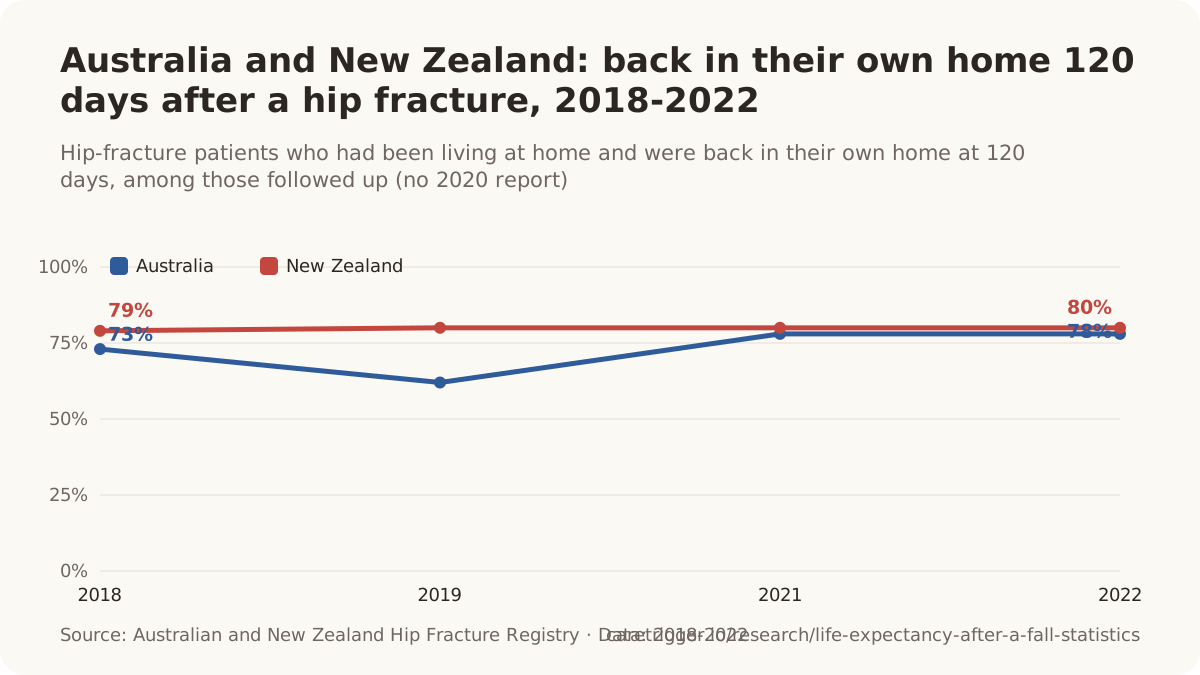

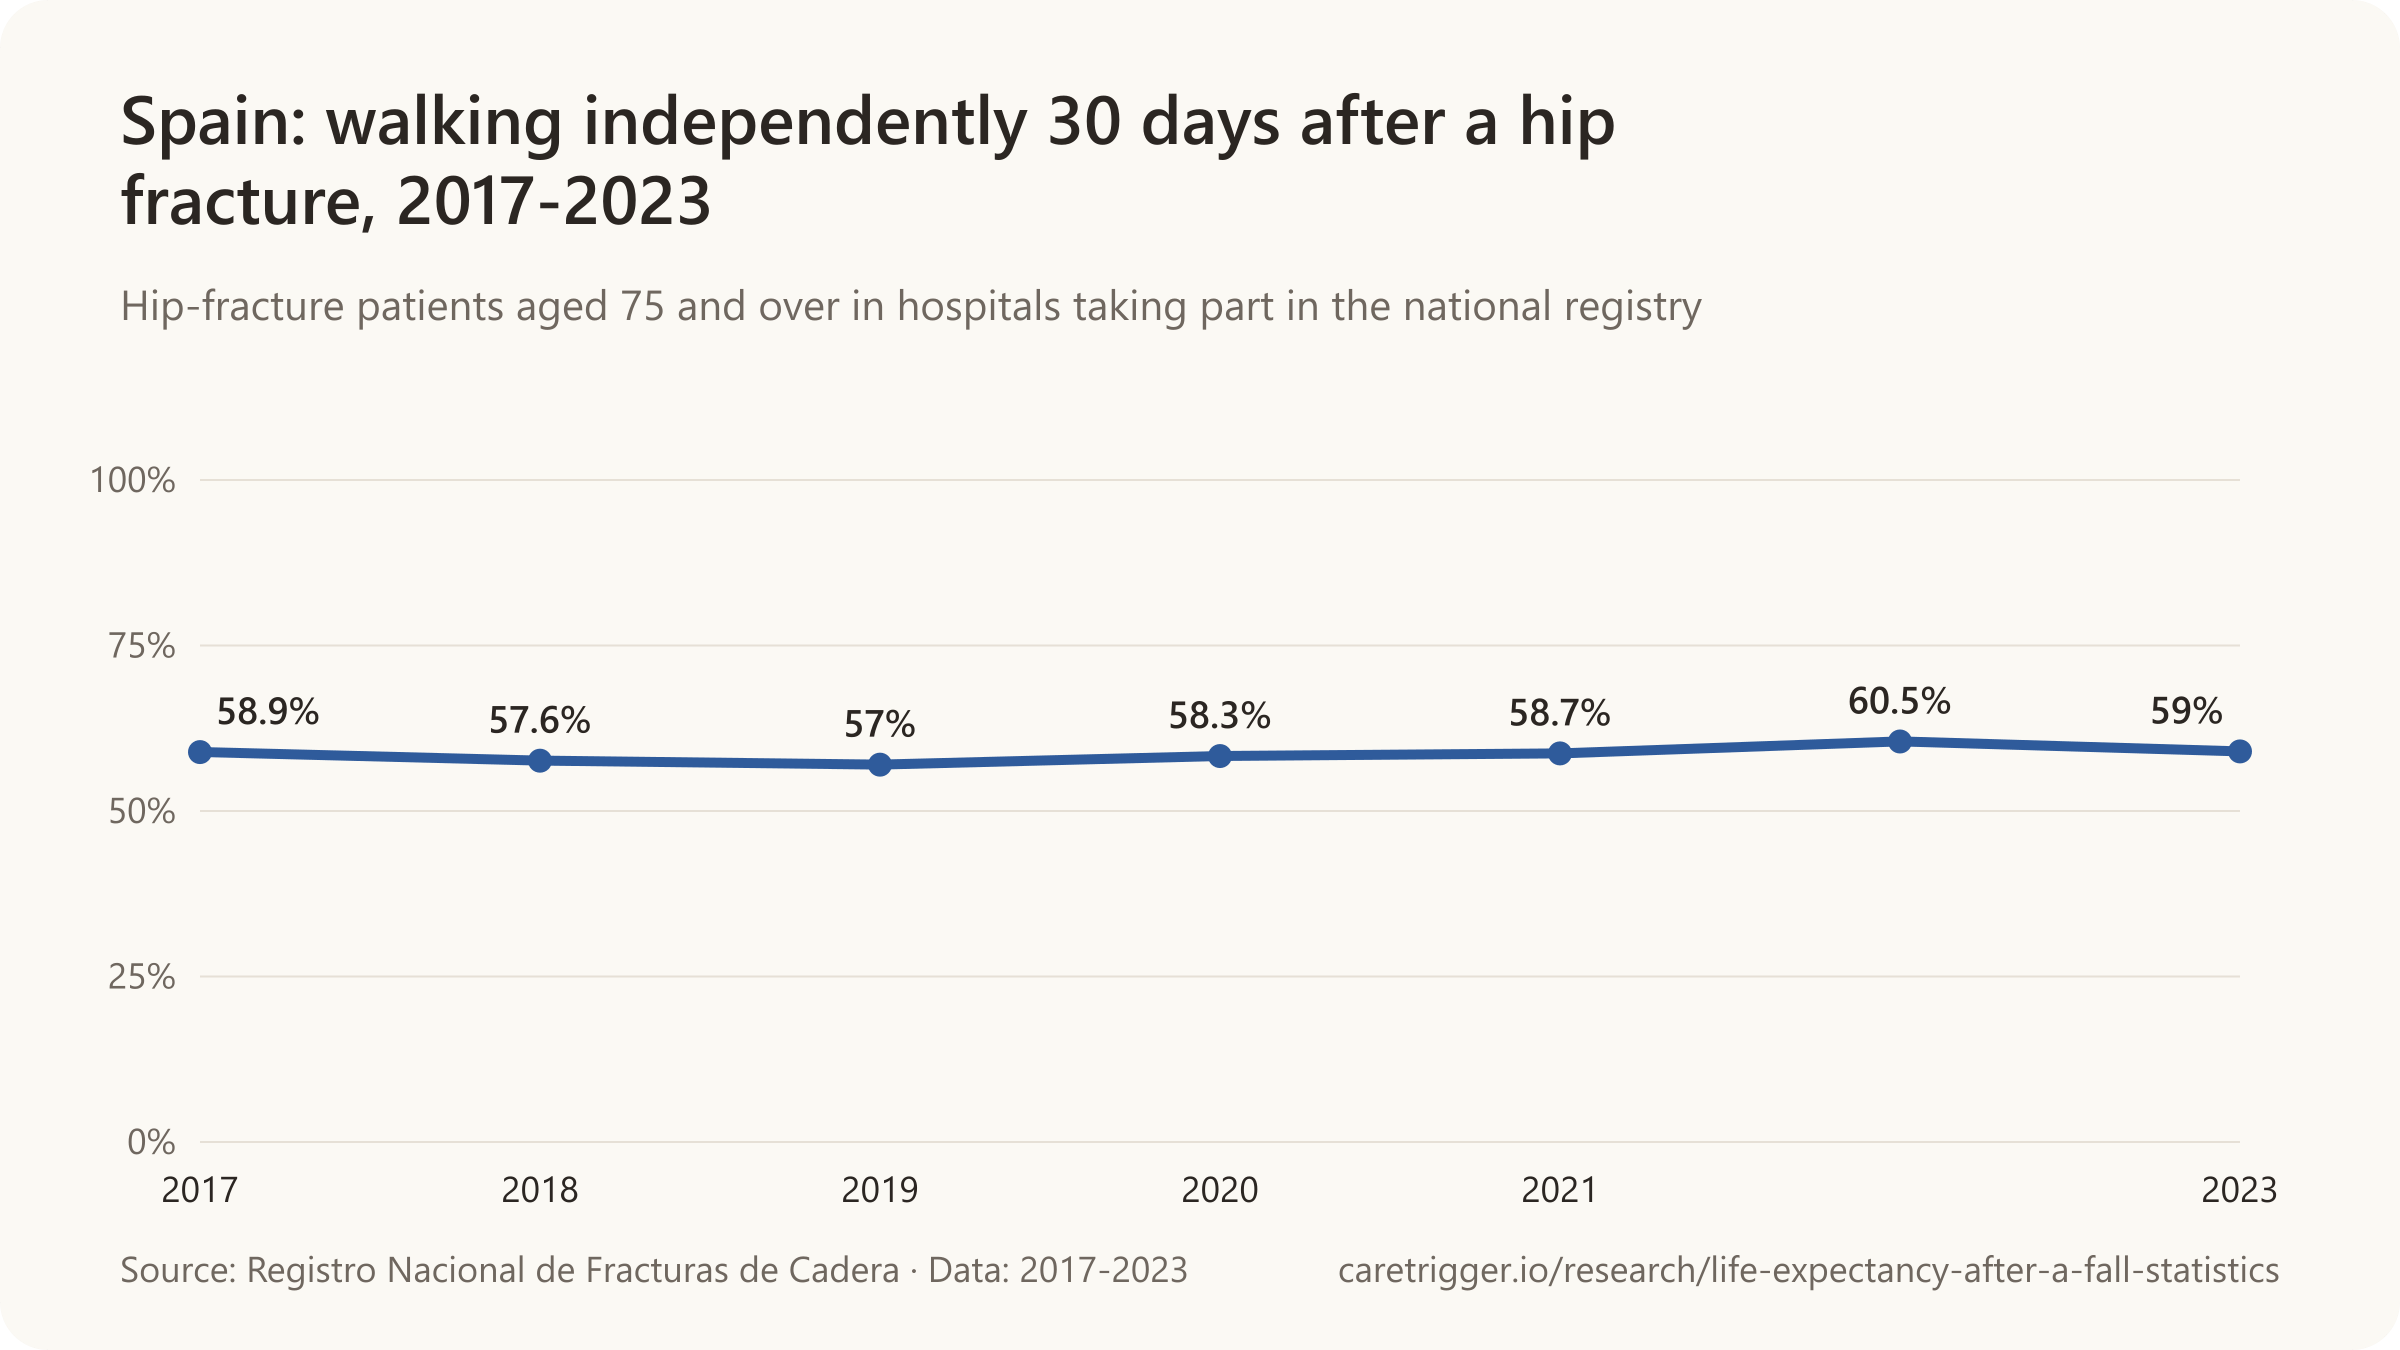
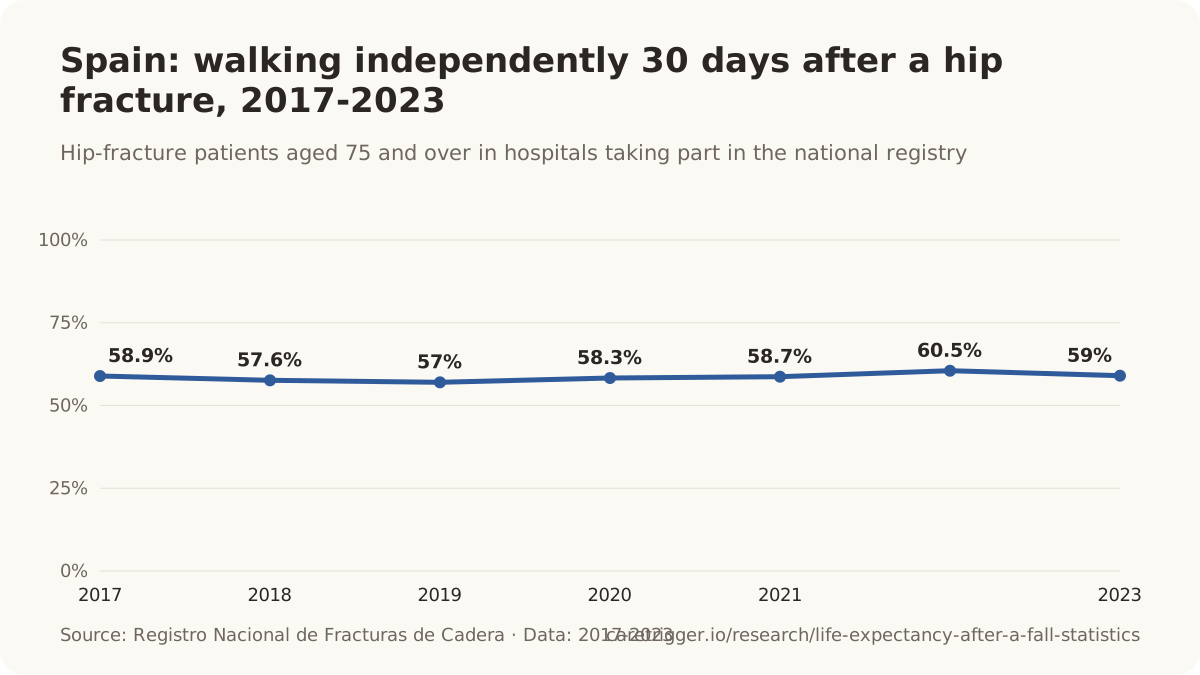
- In 2025, 75.0% of hip-fracture patients aged 60 and over in England, Wales and Northern Ireland were back in the place they lived before the fracture, either on discharge or at 120-day follow-up (National Hip Fracture Database KPI 6 run chart, 2026).
- 87.92% of hip-fracture patients aged 60 to 69 in England and Wales were back in the place they lived before the fracture by 120 days in 2025 (National Hip Fracture Database, 2026).
- 81.9% of hip-fracture patients aged 70 to 79 in England and Wales were back in the place they lived before the fracture by 120 days in 2025 (National Hip Fracture Database, 2026).
- 73.69% of hip-fracture patients aged 80 to 89 in England and Wales were back in the place they lived before the fracture by 120 days in 2025 (National Hip Fracture Database, 2026).
- 63.26% of hip-fracture patients aged 90 and over in England and Wales were back in the place they lived before the fracture by 120 days in 2025 (National Hip Fracture Database, 2026).
- In Scotland in 2025, only 66% of hip-fracture patients returned home within 30 days, though 80% had been admitted from home (Scottish Hip Fracture Audit, Public Health Scotland, 2026).
- In Scotland, 60% of hip-fracture patients were back in their original residence within 30 days of admission in 2023, up from 55% in 2017 (Scottish Hip Fracture Audit, Public Health Scotland, 2024).
- In Scotland, 62% of hip-fracture patients returned to their original residence within 30 days of admission in 2020, up from 59% in 2019 (Scottish Hip Fracture Audit, Public Health Scotland, 2021).
- In Scotland, 60% of hip-fracture patients were discharged back home within 30 days in 2021, down from 62% in 2020 (Scottish Hip Fracture Audit, Public Health Scotland, 2022).
- In Ireland in 2024, 22% of hip-fracture patients were discharged directly home from the acute hospital and 36% went to a rehabilitation unit (Irish Hip Fracture Database, 2025).
- In Ireland, the share of hip-fracture patients newly admitted to long-term care on discharge halved from 6% to 3% between 2013 and 2024 (Brent et al., Archives of Osteoporosis, 2026).
- Of hip-fracture patients aged 60 and over who were living in their own home, 68.4% went back home when discharged from the admitting hospital trust (National Hip Fracture Database, 2026).
- 7.0% of hip-fracture patients aged 60 and over who had been living in their own home were discharged to a care home (3.9% residential, 3.2% nursing) (National Hip Fracture Database, 2026).
- 9.3% of hip-fracture patients aged 60 and over admitted from a residential care home moved to a nursing home on discharge, and 68.7% went back to residential care (National Hip Fracture Database, 2026).
- Between 49% and 91% of hip-fracture patients were known to be back in their usual home 120 days after the fracture, depending on the hospital, in England, Wales and Northern Ireland in 2023 (National Hip Fracture Database, 2024).
- Hip-fracture patients in England, Wales and Northern Ireland waited 15 days on average, and up to 80 days, to start rehabilitation at home after leaving hospital (National Hip Fracture Database physiotherapy audit, 2024).
- In Denmark, 31% of hip-fracture patients aged 65+ left hospital with the same or better basic mobility than before the fracture, while 50% had lost 1-3 points and 19% had lost at least 4 points on the Cumulated Ambulation Score (Danish Multidisciplinary Hip Fracture Registry, 2026).
- In Denmark, 8.53% of hip-fracture patients aged 65+ whose basic mobility at discharge was worse than before the fracture died within 30 days, compared with 2.21% of those discharged at their pre-fracture level (Danish Multidisciplinary Hip Fracture Registry, 2026).
- In Sweden, 48% of hip-fracture patients aged 50+ could walk outdoors on their own four months after the fracture, compared with 58% before it (RIKSHÖFT, 2025).
- In Sweden, 58% of hip-fracture patients aged 50+ walked outdoors on their own before the fracture (RIKSHÖFT, 2025).
- In Sweden, 34% of women aged 80+ walked outdoors on their own four months after a hip fracture, compared with 49% before the fracture (RIKSHÖFT, 2025).
- In Sweden, 65% of women aged 50-79 walked outdoors on their own four months after a hip fracture, compared with 71% before the fracture (RIKSHÖFT, 2025).
- In Sweden, 44% of men aged 80+ walked outdoors on their own four months after a hip fracture in 2024, up from 36% in 2021, compared with 56% before the fracture (RIKSHÖFT, 2025).
- In Sweden, 66% of men aged 50-79 walked outdoors on their own four months after a hip fracture in 2024, compared with 73% before the fracture (RIKSHÖFT, 2025).
- In Sweden, 55% of women aged 80+ were back in their own home four months after a hip fracture, although 69% had lived in their own home before it (RIKSHÖFT, 2025).
- In Sweden, 54% of men aged 80+ were back in their own home four months after a hip fracture, compared with 70% living in their own home before it (RIKSHÖFT, 2025).
- In Finland, 79.2% of people aged 50+ operated for a first hip fracture in 2022-2023 were alive and living at home within 90 days (adjusted rate) (Finnish Institute for Health and Welfare, 2025).
- In the Netherlands, 31.8% of hip-fracture patients were discharged from hospital to their home (with or without help) in 2024 (Dutch Hip Fracture Audit, 2025).
- In Germany, 15.63% of adults who could walk before a hip fracture treated by internal fixation were unable to walk on their own when they left hospital in 2024 (IQTIG, 2025).
- In Spanish hospitals taking part in the national hip-fracture registry, 49% of hip-fracture patients aged 75+ were living at home one month after the fracture in 2023, up from 43% in 2017 (Registro Nacional de Fracturas de Cadera, 2025).
- In the first Greek national hip-fracture registry, 60% of patients returned to their own home after discharge, after an average stay of 10.7 days (Iliopoulos et al., Cureus, 2026).
- 43% of hip-fracture patients in Australia were transferred from the acute ward to inpatient rehabilitation in 2025 (Australian and New Zealand Hip Fracture Registry, 2026).
- 53% of hip-fracture patients in New Zealand were transferred from the acute ward to inpatient rehabilitation in 2025 (Australian and New Zealand Hip Fracture Registry, 2026).
- Only 20% of hip-fracture patients in Australia went straight home (to a private residence) from the acute ward in 2025 (Australian and New Zealand Hip Fracture Registry, 2026).
- Only 19% of hip-fracture patients in New Zealand went straight home (to a private residence) from the acute ward in 2025 (Australian and New Zealand Hip Fracture Registry, 2026).
- In New Zealand, 80% of hip-fracture patients who had been living at home were back in their own home 120 days after the fracture in 2022, among those followed up (Australian and New Zealand Hip Fracture Registry, 2023).
- In Australia, 78% of hip-fracture patients who had been living at home were back in their own home 120 days after the fracture in 2022, among those followed up (Australian and New Zealand Hip Fracture Registry, 2023).
- In New Zealand, 21% of hip-fracture patients followed up at 120 days in 2018 had returned to their pre-fracture level of walking (Australian and New Zealand Hip Fracture Registry, 2019).
- In Australia, 24% of hip-fracture patients followed up at 120 days in 2018 had returned to their pre-fracture level of walking (Australian and New Zealand Hip Fracture Registry, 2019).
- In New Zealand, 49% of hip-fracture patients in 2019 were reported to have returned to their pre-fracture walking ability at 120 days (Australian and New Zealand Hip Fracture Registry, 2020).
- In Japan, the share of operated hip-fracture patients aged 60+ discharged straight home from acute hospital fell from 39% in 2011 to 27.5% in 2021 (Hatano et al., Archives of Osteoporosis, 2025).
How long recovery takes
- Most of the recovery in walking ability and daily activities after a hip fracture takes place within the first 6 months (Dyer et al., BMC Geriatrics, 2016).
- After a hip fracture, recovery of depressive symptoms reached its peak level after about 3.9 months, in a two-year Baltimore study of 674 patients (Magaziner et al., Journals of Gerontology, 2000).
- After a hip fracture, recovery of upper-body (arm) function reached its peak level after about 4.3 months, in a two-year Baltimore study of 674 patients (Magaziner et al., Journals of Gerontology, 2000).
- After a hip fracture, recovery of cognition reached its peak level after about 4.4 months, in a two-year Baltimore study of 674 patients (Magaziner et al., Journals of Gerontology, 2000).
- After a hip fracture, recovery of lower-body (leg) function reached its peak level after about 11.2 months, in a two-year Baltimore study of 674 patients (Magaziner et al., Journals of Gerontology, 2000).
- Most of the recovery in walking and in personal and household daily activities after a hip fracture occurred by 6 months after discharge, and a large share of patients did not regain their pre-fracture level (Magaziner et al., Journal of Gerontology, 1990).
- Measured leg function and mobility after a hip fracture improved over the first 6 months, with no further significant gain between 6 and 12 months, in patients with a mean age of 84 (Fischer et al., Osteoporosis International, 2019).
- Patients' own rating of their physical functioning after a hip fracture kept improving up to 9 months, but not thereafter (Fischer et al., Osteoporosis International, 2019).
- None of four groups of Norwegian hip-fracture patients with distinct recovery paths regained their pre-fracture daily-activity level, and none improved further between the fourth and the twelfth month (Dakhil et al., PLOS ONE, 2023).
- Six years after a hip fracture, older Chinese adults still had 25% more difficulties with daily activities than before it, and those aged 80+ grew more disabled during recovery (Chen et al., JAMDA, 2026).
Quality of life and pain
- One year after a hip fracture, UK patients' quality of life (EQ-5D) was still 0.22 points below its pre-injury level on average, whatever their age or cognitive state (Griffin et al., Bone & Joint Journal, 2015).
- Hip-fracture patients under 80 lost 0.28 points of quality of life (EQ-5D) compared with before the injury, a gap that stayed fixed through the first year (Griffin et al., Bone & Joint Journal, 2015).
- Eighteen months after a hip fracture, patients' average quality-of-life score (EQ-5D utility) was 0.66, still below the 0.77 they reported for before the fracture, across 11 countries (Svedbom et al., Osteoporosis International, 2018).
- Eighteen months after a spine (vertebral) fracture, patients' average quality-of-life score (EQ-5D utility) was 0.70, below the 0.83 they reported for before the fracture, across 11 countries (Svedbom et al., Osteoporosis International, 2018).
- One month after hip-fracture surgery, Spanish patients' average quality-of-life score (EQ-5D index) had fallen from 0.62 before the fracture to 0.16 (Amarilla-Donoso et al., Health and Quality of Life Outcomes, 2020).
- 42% of frail older adults reported moderate or severe hip pain about three and a half months (mean 14.5 weeks) after hip-fracture surgery (Herrick et al., Journal of the American Geriatrics Society, 2004).
- Three months after a fragility fracture of the pelvis, 38% of older patients still had pain when moving and 16% had pain at rest (Kooger et al., European Journal of Trauma and Emergency Surgery, 2025).
- Older patients' quality-of-life score (EQ-5D) dropped to 0.33 the day after a pelvic fragility fracture, from 1.00 before it, and recovered to 0.85 among those alive at six months (Kooger et al., European Journal of Trauma and Emergency Surgery, 2025).
- In older Swedish women, a clinical spine (vertebral) fracture was associated with lower physical quality of life for up to 18.9 years after it happened (Johansson et al., Osteoporosis International, 2019).
- 90% of older Danes living at home after a hip fracture received help from family or friends in the first 12 weeks after discharge, a median of 32 hours in total (Ipsen et al., BMC Geriatrics, 2024).
- Older Danes who depended heavily on family help after a hip fracture received 66 hours of informal care in the first 12 weeks (median), compared with 11 hours for those with low dependence (Ipsen et al., BMC Geriatrics, 2024).
After other fractures and injuries
- 32.4% of older Japanese patients with a fragility fracture of the pelvis lost walking ability (Takegami et al., Journal of Orthopaedic Science, 2026).
- 17.3% of previously independent older Canadians treated in an emergency department for a minor injury had a decline in daily functioning at 6 months, and 14.9% at 3 months (Sirois et al., Journal of the American Geriatrics Society, 2013).
- 12.1% of independent older Canadians seen in an emergency department for a minor injury, at least 70% of them caused by falls, had lost daily functioning three months later (Sirois et al., Journals of Gerontology, 2017).
- 10% of Danish hip-fracture patients who lived in their own homes did not return to independent living within 12 months; most stayed at home with a small increase in care needs (Frandsen et al., Archives of Orthopaedic and Trauma Surgery, 2023).
Other studies
- Two years after a hip fracture, 72% of older people in Auckland had kept their functional independence, compared with 94% of matched people without a fracture (Norton et al., 2000, as reported by Dyer et al., BMC Geriatrics, 2016).
- Of nursing-home residents who could walk a block before a hip fracture, 7% could do so again, compared with 31% of people not living in a nursing home (Tang et al., Journal of General Internal Medicine, 2017).
- Hip-fracture patients had about 26 more cases of walking disability per 100 over two years than comparable older people without a fracture, an excess beyond what ageing alone explained (Magaziner et al., American Journal of Epidemiology, 2003).
- 38% to 39% of hip-fracture patients needed help getting in and out of a bed or chair at 12 and 24 months, compared with 10% to 18% of matched community-dwelling peers (about 22 extra cases per 100) (Magaziner et al., American Journal of Epidemiology, 2003).
- The share of Oslo hip-fracture patients who walked without any aid fell from 76% before the fracture to 36% afterwards (Osnes et al., Osteoporosis International, 2004).
Numbers we will not publish. "Half of older people who break a hip never walk again" has no primary source. Losing the ability to walk altogether is about one in ten in Swedish registry data (10% at four months) and 18.7% at one year in a Dutch cohort; what is well supported is that only 40% to 60% get back to the mobility they had before. The International Osteoporosis Foundation's "33% totally dependent or in a nursing home a year later" is not in any of the studies it cites. Two figures sometimes read as life expectancy are not: a Japanese study's "median remaining life expectancy of 260 days" and a Swedish study's "median survival of 61 days" describe only the patients who died.
Sources: BMC Geriatrics (2016, 2024); Injury (2020, 2021); Journal of the American Geriatrics Society (1992-2016); Journal of General Internal Medicine; American Journal of Epidemiology (2003, 2009); Clinical Orthopaedics and Related Research (1995, 1998); American Journal of Medicine; Geriatrics & Gerontology International; European Geriatric Medicine; New England Journal of Medicine; Journal of Clinical Medicine (2022, 2024, 2026); Journal of the American Medical Directors Association (2015, 2024, 2026); Revista da Associacao Medica Brasileira; Bone; JAMA; Journals of Gerontology Series A (2000, 2007, 2015); Osteoporosis International (2000-2019); Injury Prevention; BMJ; Disability and Rehabilitation; JAMA Internal Medicine; Australian and New Zealand Journal of Public Health; European Journal of Trauma and Emergency Surgery (2018, 2025); PLOS Medicine; Age and Ageing; Frontiers in Medicine; Maturitas; Archives of Rehabilitation Research and Clinical Translation; BMC Medicine; Medicine; Innovation in Aging; National Hip Fracture Database (2017, 2024, 2026); Finnish Institute for Health and Welfare, PERFECT; Australian and New Zealand Hip Fracture Registry (2019-2026); Registro Nacional de Fracturas de Cadera; Public Health Scotland (2021-2026); National Office of Clinical Audit; Archives of Osteoporosis (2025, 2026); Danish Multidisciplinary Hip Fracture Registry; RIKSHÖFT; Dutch Hip Fracture Audit, DICA; IQTIG; Cureus; Journal of Gerontology; PLOS ONE; Bone & Joint Journal; Health and Quality of Life Outcomes; Journal of Orthopaedic Science; Archives of Orthopaedic and Trauma Surgery
13 / Decline
Why do older adults decline after a fall?
After a fall injury other than a broken hip, 20.6% of older patients had a long-term nursing-home admission (American Journal of Epidemiology, 2013).

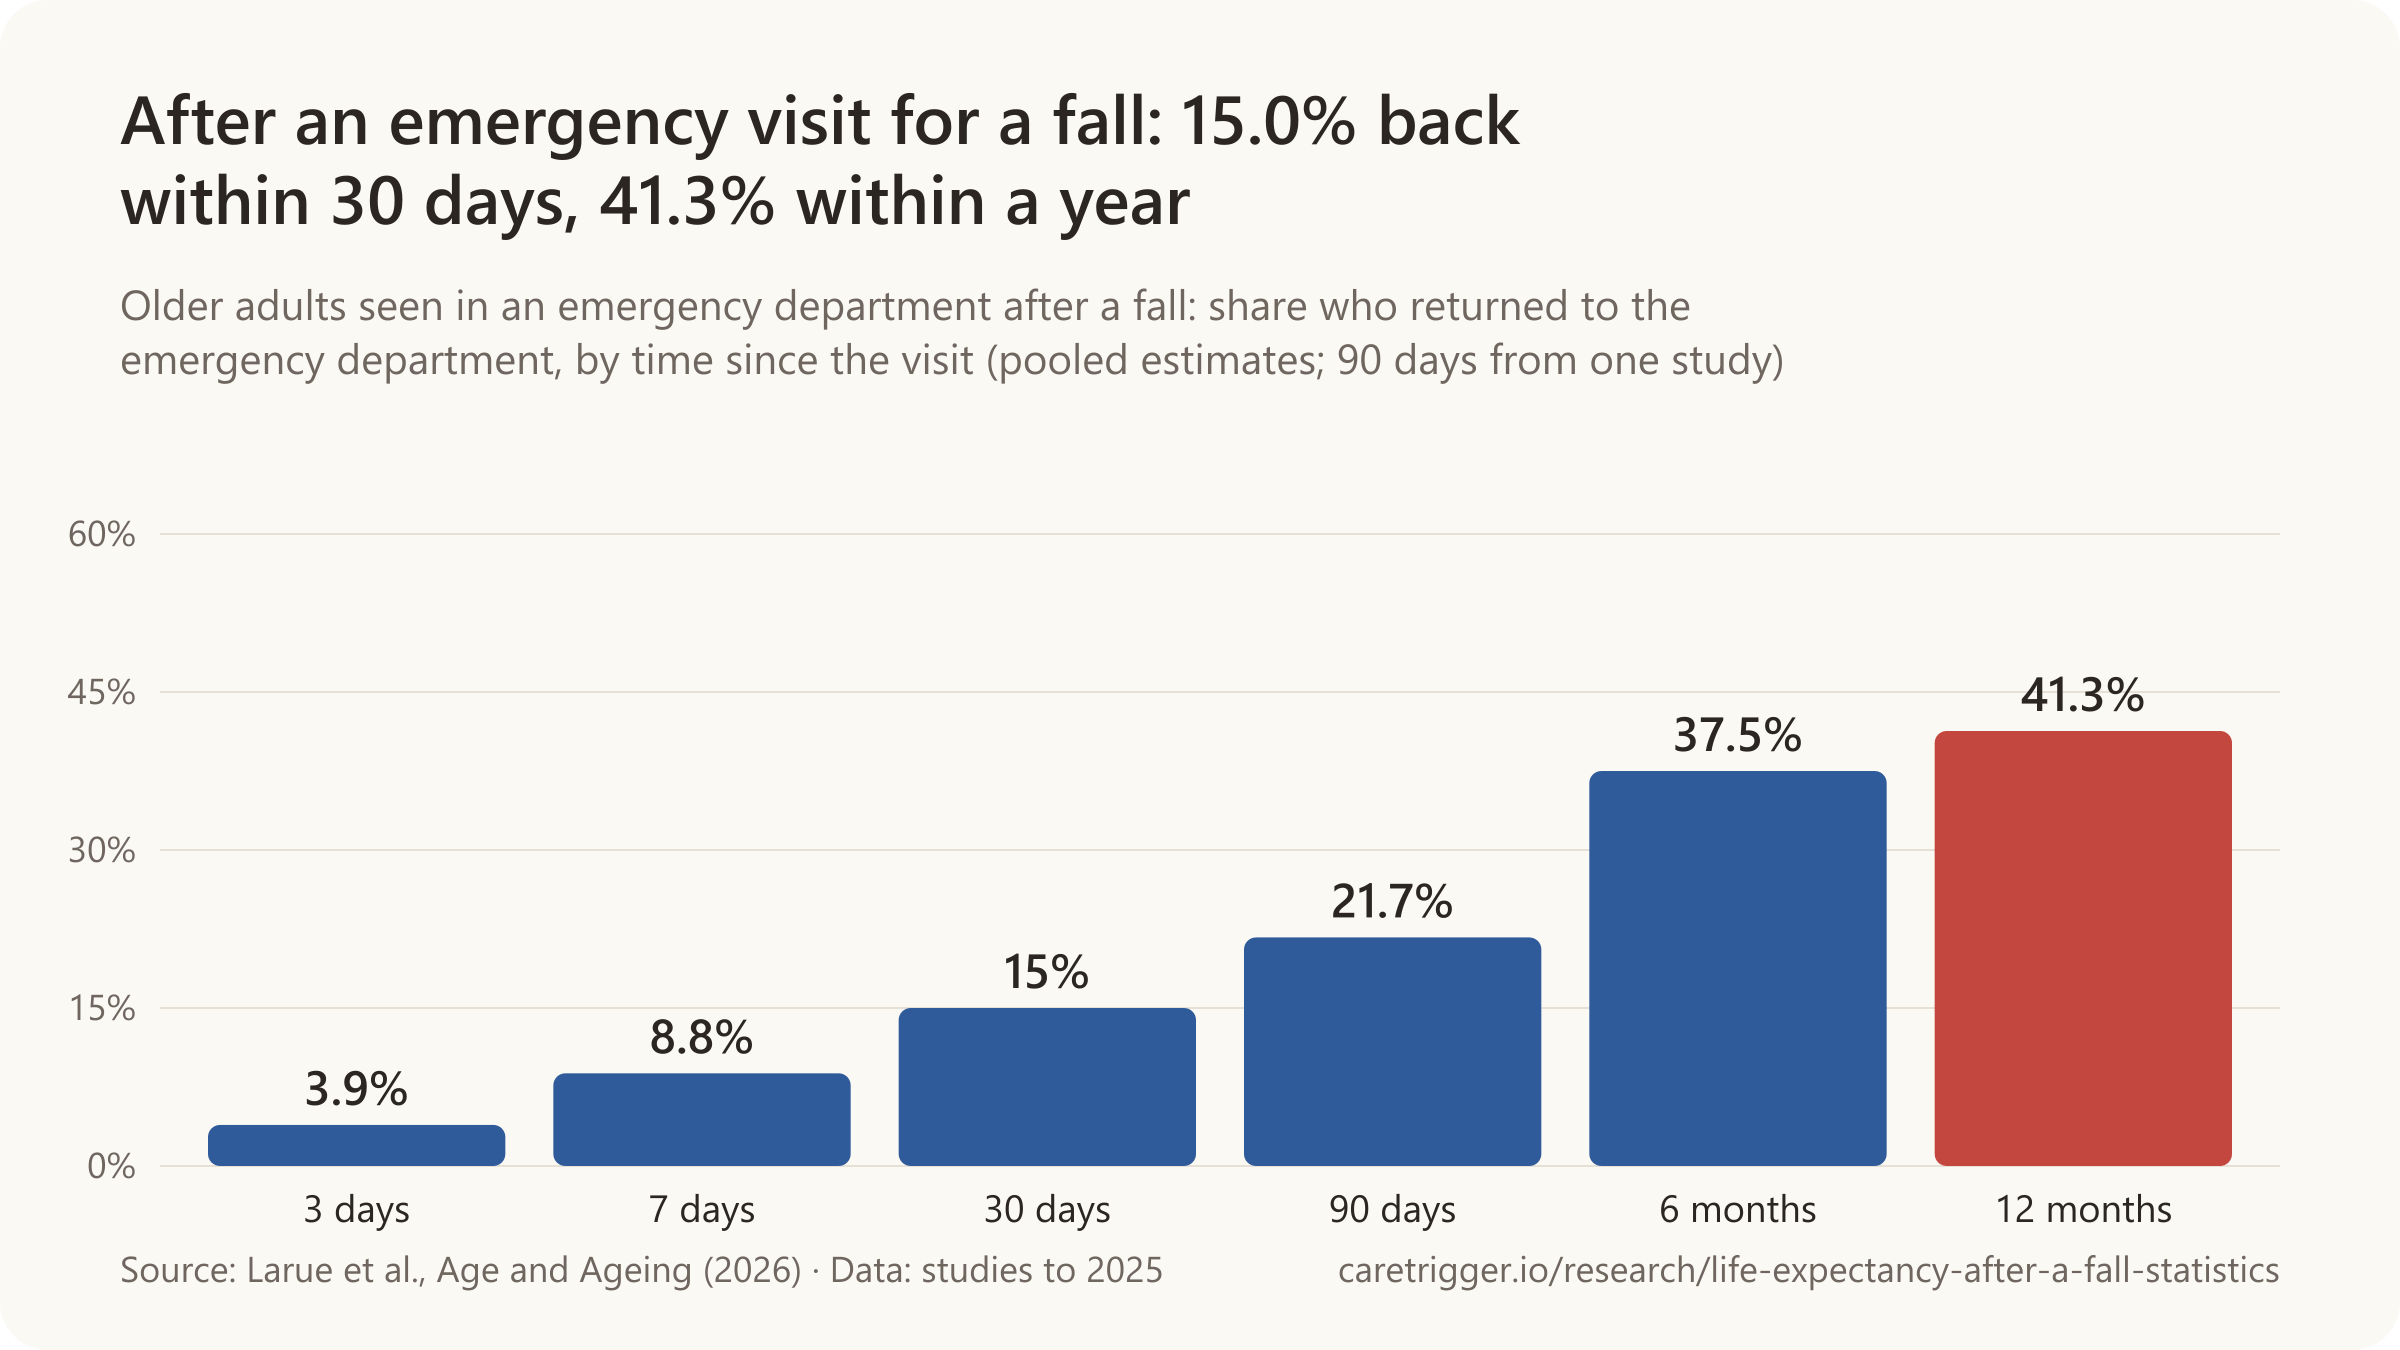
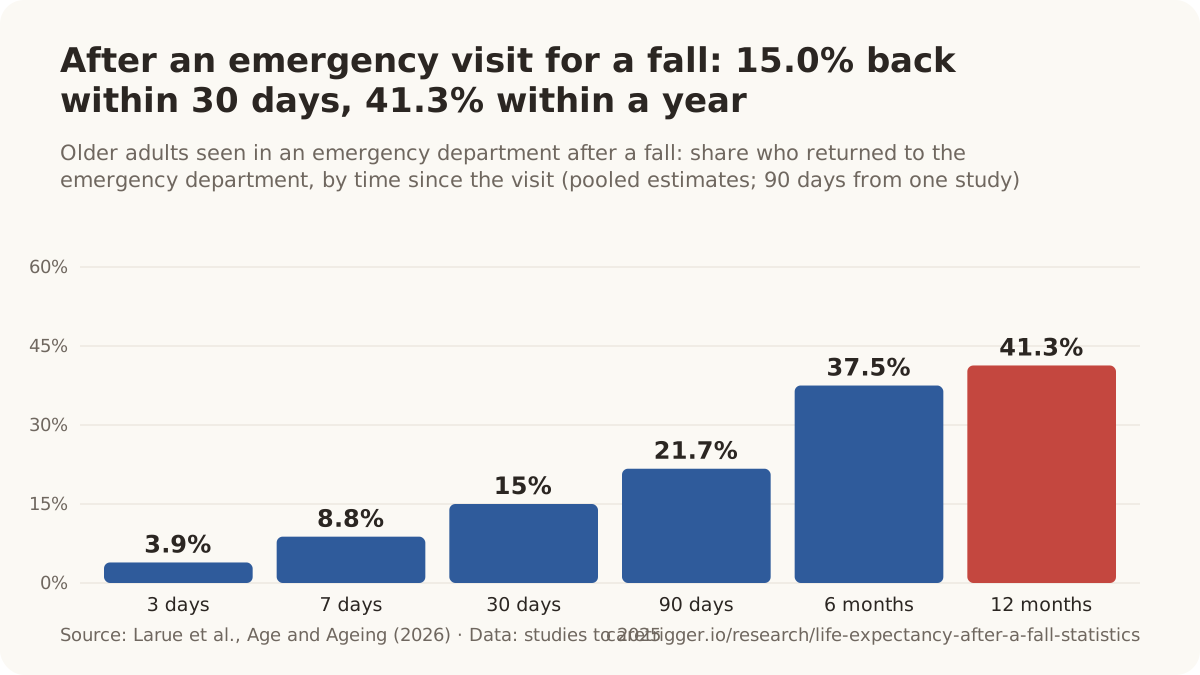
- 10.6% of US Medicare patients with no prior dementia were diagnosed with dementia within a year of an injurious fall (2014-2015).
- About half of older adults are afraid of falling: 49.6%, pooling 153 studies in 38 countries (2024).
- 41.4% of patients over 70 hospitalised after a fall lost the ability to stand or walk with no injury to explain it (2016).
- 58.5% of US patients 65 and older admitted for a fall injury were discharged to a skilled nursing facility (2014).
- One in nine (11.2%) people 65 and older seen in Spanish emergency departments after a fall fell again within six months (2022).
| Who and where | Declined |
|---|---|
| People 65 and older who fell, the Netherlands | 35.3% |
| Sent home from an emergency department after a fall, Melbourne (60 and older) | 35% |
| Seen in an emergency department after a fall, Spain (65 and older, at six months) | 29.6% |
| Seen in an emergency department after a fall, the Netherlands (70 and older, at three months) | 27.2% |
| Independent and sent home after a minor injury, Canada (at six months) | 17% |
Sources: American Journal of Epidemiology; Age and Ageing (2026, 2004); JAMA Network Open; BMC Geriatrics; Gerontology; Clinical Epidemiology; Emergencias; Journals of Gerontology Series A; Maturitas; Scandinavian Journal of Trauma, Resuscitation and Emergency Medicine; Annals of Emergency Medicine
More statistics (83)
20.6% of older people hospitalised for a fall injury other than a hip fracture had a long-term nursing-home admission, slightly more than after a hip fracture (18.6%) and more than after other hospital stays (8.7%) (Gill et al., American Journal of Epidemiology, 2013).
Many older people who survive a fall are not the same afterwards. Some lose confidence and stop going out, some fall again, some are diagnosed with dementia that the fall may have revealed, and some move into a care home. Each step can follow the one before, which is why a fall that causes no injury still matters.
Moving into a care home
- 58.5% of US patients aged 65+ admitted for a fall injury in 2014 were discharged to a skilled nursing or intermediate care facility, up from 55.6% in 2010 and about twice the rate for other trauma patients (30.5%) (Galet et al., Clinical Epidemiology, 2018; National Readmission Database).
- Among community-dwelling people over 71, at least one fall causing serious injury carried an adjusted odds ratio of 10.2 (95% CI 5.8-17.9) for long-term nursing-home admission over three years; one non-injurious fall 3.1; two or more non-injurious falls 5.5 (Tinetti & Williams, NEJM, 1997).
- 12.1% (133 of 1,103) of community-dwelling people over 71 had long-term admissions to nursing homes during three years of follow-up (Tinetti & Williams, NEJM, 1997; New Haven, USA).
- Among people aged 90+ who lay on the floor for an hour or more after a fall, 36% (5 of 14) moved into long-term care within one year and 53% (8 of 15) by the end of the study (Fleming & Brayne, BMJ, 2008).
- A single fall was associated with 3.8 times the odds of admission to long-term care within one year (95% CI 1.8-8.3) and recurrent falls with 4.5 times (95% CI 1.7-12), among 1,815 people over 75 living at home in the UK (Donald & Bulpitt, Age and Ageing, 1999).
- Of patients over 65 who survived a trauma-centre admission after a ground-level fall, 51% were discharged to a skilled nursing facility and 33% went home without assistance (Ayoung-Chee et al., Journal of Trauma and Acute Care Surgery, 2014).
- 48% of older ground-level fall patients discharged to a skilled nursing facility died during follow-up (mean 28.2 months), 61% of them while still living in the facility (Ayoung-Chee et al., Journal of Trauma and Acute Care Surgery, 2014).
- Only about one third of older adults hospitalised after a ground-level fall were discharged home to independent living (Ayoung-Chee et al., Journal of Trauma and Acute Care Surgery, 2014).
- Hospitalisation for a fall injury other than a hip fracture was associated with 3.2 times the odds of long-term nursing-home admission (95% CI 1.3-7.8) compared with hospitalisation for other reasons, similar to a hip fracture (3.3) (Gill et al., American Journal of Epidemiology, 2013).
- Six months after a hospital stay for a fall injury, older adults had 1.4 times the disability score of people hospitalised for other reasons (other fall injuries; 95% CI 1.2-1.6) and 1.5 times after a hip fracture (Gill et al., American Journal of Epidemiology, 2013).
- Of older adults who died within a year of an ambulance-attended fall, 40% died in a skilled nursing or other long-term care facility, 23% in hospital or the emergency department and 15% at home (Newgard et al., Western Journal of Emergency Medicine, 2022).
- Only 43.2% of US trauma-centre patients aged 65+ without dementia who were admitted after a fall from standing height went home from hospital; 32.0% went to a skilled nursing facility or long-term care hospital (Groechel et al., Trauma Surgery & Acute Care Open, 2026; 2019-2022).
- Only 48% of adults aged 65+ admitted to an Australian major trauma centre (two thirds after a low fall) returned to their previous residence on discharge (Emmett et al., BMC Geriatrics, 2025; Victoria, 2022-2023).
- Only 18.2% of trauma patients over 90 admitted after a fall from standing height were discharged home, compared with 73.7% of those under 60 (Bhattacharya et al., Injury, 2016).
- About 35% to 37% of Texans aged 65+ hospitalised for a fall (admitted from home) were discharged to a skilled nursing facility in 2011-2013, the most common destination after home (Towne et al., Health Services Research, 2018; 131,978 hospitalisations).
- 94.9% of older people hospitalised for a hip fracture after a fall were discharged to a nursing home, compared with 65.1% after other fall injuries and 36.1% after hospital stays for other reasons (Gill et al., American Journal of Epidemiology, 2013).
- 65.1% of older people hospitalised for a fall injury other than a hip fracture were discharged to a nursing home, compared with 36.1% after hospital stays for other reasons (Gill et al., American Journal of Epidemiology, 2013).
- 18.6% of older people hospitalised for a fall-related hip fracture had a long-term nursing-home admission, compared with 8.7% after hospital stays for other reasons (Gill et al., American Journal of Epidemiology, 2013).
- 8.7% of older people hospitalised for reasons other than a fall had a long-term nursing-home admission, and 36.1% were discharged to a nursing home (Gill et al., American Journal of Epidemiology, 2013).
- Six months after hospital, disability scores were 1.5 times higher after a hip fracture and 1.4 times higher after other fall injuries than after hospital stays for other reasons (Gill et al., American Journal of Epidemiology, 2013).
- Hospitalisation for a fall-related hip fracture or another fall injury carried about three times the odds of a long-term nursing-home admission (adjusted OR 3.3 and 3.2) compared with other hospital stays (Gill et al., American Journal of Epidemiology, 2013).
Dementia and delirium
- 10.6% of Medicare patients aged 66+ with no prior dementia diagnosis were diagnosed with Alzheimer disease or a related dementia within a year of an injurious fall, versus 6.1% after other injuries (Ordoobadi et al., JAMA Network Open, 2024; 2.45 million patients).
- After adjusting for demographics, other illnesses, injury details and the competing risk of death, a fall was associated with a 21% higher risk of a new dementia diagnosis within a year than other injuries (HR 1.21) (Ordoobadi et al., JAMA Network Open, 2024).
- Among matched trauma patients aged 65+ admitted after a fall from standing height, 9.8% of those with dementia died in hospital or were discharged to hospice, versus 6.3% of similar patients without dementia (Groechel et al., Trauma Surgery & Acute Care Open, 2026; US National Trauma Data Bank).
- 53.6% of trauma admissions of US patients aged 65+ with dementia were for falls from standing height (Groechel et al., Trauma Surgery & Acute Care Open, 2026; National Trauma Data Bank, 2019-2022).
- 26.2% of adults aged 65+ admitted to an Australian major trauma centre (two thirds after a low fall) developed delirium in hospital, the most common complication (Emmett et al., BMC Geriatrics, 2025; Victoria, 2022-2023).
- Older Japanese adults who fell several times had 1.66 times the risk of a later dementia diagnosis over nine years, and those who fell once 1.18 times, compared with non-fallers (Zhong et al., European Geriatric Medicine, 2025).
Fear of falling and post-fall syndrome
- A 2024 meta-analysis of 153 studies with 200,033 older adults in 38 countries estimated the global prevalence of fear of falling at 49.60% (range 6.96-90.34%), higher among patients than community residents (52.2% vs 48.4%) (Xiong et al., BMC Geriatrics, 2024).
- 41.4% of patients over 70 hospitalised after a fall (29 of 70) developed post-fall syndrome, a loss of the ability to stand or walk with no injury to explain it (Meyer et al., Gerontology, 2021; Strasbourg).
- 32% (70 of 219) of older people who fell during a two-year study reported a fear of falling afterwards; fearful fallers went on to develop greater mobility restriction (Vellas et al., Age and Ageing, 1997; New Mexico, USA).
- In the study that defined the 'post-fall syndrome', 10 of 36 older patients admitted after a fall showed severe clutching/grabbing and could not walk unaided, and 9 of those 10 had died or were still in hospital four months later (Murphy & Isaacs, Gerontology, 1982).
- 47.1% of 1,464 people aged 65+ seen in Spanish emergency departments after a fall reported a fear of falling (Garcia-Martinez et al., European Geriatric Medicine, 2024).
- A history of falls was associated with 2.39 times the odds of fear of falling, in a 2024 meta-analysis pooling 19 studies on this factor (Xiong et al., BMC Geriatrics, 2024).
- Reported rates of fear of falling among community-dwelling older people range from 3% to 85% depending on how it is measured; at least one fall is a main risk factor and the only modifiable one identified (Scheffer et al., Age and Ageing, 2008; 28 studies).
- 22% of US adults aged 65+ living in the community reported a fear of falling, and it was the strongest predictor of avoiding everyday activities (Bertera & Bertera, Health & Social Work, 2008; National Survey of Self-Care and Aging).
- One year after a fall-related hospital stay, 64.7% of older patients with post-fall syndrome could still walk and 52.9% could transfer (for example from bed to chair), compared with 85.2% and 80.7% of those without it (Meyer et al., Gerontology, 2021).
- A 2025 scoping review found post-fall syndrome described in only 14 studies and no epidemiological studies of the wider psychomotor disadaptation syndrome, so there is no reliable estimate of how common it is (Merendino et al., European Geriatric Medicine, 2025).
- Older adults who had fallen were 1.75 times as likely to develop a new fear of falling over the next 20 months (Friedman et al., Journal of the American Geriatrics Society, 2002; Salisbury, Maryland).
- Post-fall syndrome was associated with 1.77 times the odds of a lasting loss of independence six months after an emergency visit for a fall, and a fracture with 2.45 times (Miro et al., Maturitas, 2019).
- 48% of 1,507 people aged 65+ seen in Spanish emergency departments after a fall reported a fear of falling (Miro et al., Emergencias, 2018; FALL-ER registry).
- 19% of community-living people aged 72+ in New Haven restricted their activities because of fear of falling, and a further 24% had fear of falling without restricting activity; among those afraid, a history of an injurious fall was associated with restriction (Murphy, Williams & Gill, Journal of the American Geriatrics Society, 2002).
Falling again
- One in nine (11.2%) people aged 65+ treated in Spanish emergency departments after an accidental fall reported another fall within six months (147 of 1,313) (Garcia-Martinez et al., Emergencias, 2022; FALL-ER registry).
- People over 75 living at home in the UK who fell more than once had 2.6 times the odds of dying within one year (95% CI 1.4-4.7), while those who fell only once had no raised risk (OR 0.9) (Donald & Bulpitt, Age and Ageing, 1999).
- 22.6% of 350 patients aged 65+ seen in a Boston emergency department after a fall fell again within six months (Sri-On et al., Annals of Emergency Medicine, 2017).
- 47% of older people left at home by an ambulance crew after a fall (83 people) called 999 again within two weeks (Snooks et al., Quality and Safety in Health Care, 2006; London).
- 58% of people aged 70+ who were attended by an ambulance after a fall but not taken to hospital fell again within six months (Tiedemann et al., Australian and New Zealand Journal of Public Health, 2013; New South Wales).
- 25% of older fallers left at home by paramedics in New South Wales needed another fall-related ambulance attendance within six months (Tiedemann et al., Australian and New Zealand Journal of Public Health, 2013).
- The usual-care group (213 people aged 65+ who came to a London emergency department after a fall) reported 510 falls over the next 12 months, against 183 among 184 people given a falls assessment (Close et al., The Lancet, 1999; PROFET trial).
- A previous fall was the strongest risk factor for falling again: odds ratio 2.8 for any fall and 3.5 for recurrent falls, in a meta-analysis of 74 prospective studies of community-dwelling older people (Deandrea et al., Epidemiology, 2010).
- 15% of 89,061 older adults sent home from US emergency departments after a fall in 2022 came back to the emergency department with another fall within six months (Heslin et al., Innovation in Aging, 2023; conference abstract).
- Older adults who returned to the emergency department with a second fall within six months had higher mortality than those who did not (6.2% vs 3.5%, OR 1.83) (Heslin et al., Innovation in Aging, 2023; conference abstract, 89,061 patients).
- Among long-term care residents whose falls were captured on video, each additional fall per year was associated with a 4.2% higher risk of death (Heidel et al., Journal of the American Medical Directors Association, 2023; Vancouver).
- 42,873 (13.2%) of 324,060 ambulance attendances for falls by people aged 65+ in Victoria, Australia (2010-2017) were repeat falls within 12 months of the person's first attended fall (Cox et al., Injury, 2018).
Back to hospital
- More than half (50.3%) of patients aged 65+ seen in an emergency department after a fall had a recurrent fall, emergency revisit, hospitalisation or death within six months, up from 7.7% at 7 days and 21.4% at 30 days (Sri-On et al., Annals of Emergency Medicine, 2017).
- A quarter (25%) of patients aged 65+ seen in an emergency department after a fall returned to the emergency department within a year (Liu et al., American Journal of Emergency Medicine, 2015; Boston).
- 36% of patients aged 65+ seen in an emergency department after a fall (7,609 of 21,340) had another emergency visit or died within one year (Liu et al., American Journal of Emergency Medicine, 2015).
- 44.6% of patients over 65 admitted after a ground-level fall were readmitted to hospital within one year of the injury (Ayoung-Chee et al., Journal of Trauma and Acute Care Surgery, 2014).
- 17.4% of US fall patients aged 65+ readmitted within 30 days in 2014 were readmitted for another fall injury, up from 15.6% in 2010 and about 4.5 times the share among other trauma patients (Galet et al., Clinical Epidemiology, 2018).
- Within three years of a fall where paramedics did not take them to hospital, 91% of older fallers were admitted to hospital, 89% called an ambulance again and 87% attended an emergency department (Mikolaizak et al., Age and Ageing, 2022).
- Fall-related hospital stays for Canadians aged 65+ typically last 9 days longer than the average hospital stay for that age group (Public Health Agency of Canada, Health Infobase, 2025).
- Among older trauma patients, admission after a low fall was associated with a 26% longer hospital stay than other injury mechanisms after adjustment (IRR 1.26) (Emmett et al., BMC Geriatrics, 2025).
- About one in five fall-injury admissions of people aged 60+ in Victoria, Australia lasted more than a week (20.0% for women, 19.7% for men) (Berecki-Gisolf et al., Frontiers in Public Health, 2024; 2018/19-2022/23).
- 3.9% of older adults seen in an emergency department after a fall returned to the emergency department within 3 days (pooled estimate; Larue et al., Age and Ageing, 2026; 19 studies).
- 8.8% of older adults seen in an emergency department after a fall returned within 7 days (pooled estimate; Larue et al., Age and Ageing, 2026).
- 15.0% of older adults seen in an emergency department after a fall returned within 30 days (pooled estimate; Larue et al., Age and Ageing, 2026).
- 21.7% of older adults seen in an emergency department after a fall returned within 90 days (single study in a 2026 meta-analysis; Larue et al., Age and Ageing, 2026).
- 37.5% of older adults seen in an emergency department after a fall returned to the emergency department within six months (pooled estimate; Larue et al., Age and Ageing, 2026).
- 41.3% of older adults seen in an emergency department after a fall returned to the emergency department within a year, in a 2026 meta-analysis of 19 studies (Larue et al., Age and Ageing, 2026).
- 10.4% of older adults seen in an emergency department after a fall were admitted to hospital again within 30 days (pooled estimate; Larue et al., Age and Ageing, 2026).
- 30.4% of older adults seen in an emergency department after a fall had a hospital (re)admission within six months, and 31.9% within a year in a single study (Larue et al., Age and Ageing, 2026).
- 42.9% of Koreans aged 75+ seen in an emergency department for a fall injury were admitted to hospital, against 2.6% of young children with similar emergency visit rates (Kim et al., Journal of Preventive Medicine and Public Health, 2026; national injury statistics 2022).
- 26.5% of emergency department visits for fall injuries by US adults aged 65+ ended in hospital admission (Orces, The Scientific World Journal, 2025; NEISS-AIP, 2001-2021).
- 21% of ambulance 'lift assist' calls (help up, no treatment or transport) were followed by an emergency department visit within 14 days, 11.6% by an admission and 1.1% by a death (Leggatt et al., Prehospital Emergency Care, 2017; London, Ontario, 2013).
- 42.6% of 350 patients aged 65+ seen in a Boston emergency department after a fall came back to the emergency department within six months (Sri-On et al., Annals of Emergency Medicine, 2017).
- 31.1% of 350 patients aged 65+ seen in a Boston emergency department after a fall were admitted to hospital within six months (Sri-On et al., Annals of Emergency Medicine, 2017).
Daily functioning
- 35.3% of community-dwelling people aged 65+ in the Netherlands who fell reported a decline in their functional status after the fall (Stel et al., Age and Ageing, 2004; Longitudinal Aging Study Amsterdam).
- 35% of people aged 60+ sent home directly from an Australian emergency department after a fall reported a decline in function (Russell et al., Journals of Gerontology Series A, 2006; Melbourne).
- 17% of independent older adults sent home from Canadian emergency departments after a 'minor' injury (two thirds of them falls) had a lasting decline in daily functioning six months later (Sirois et al., Annals of Emergency Medicine, 2022; 2,919 patients, 8 EDs).
- Older adults who fell were 2.45 times as likely as matched non-fallers to show worsening physical function, mood and thinking all at once (Lin et al., PLOS Medicine, 2026; cohorts in China, the UK and the US).
- In a US national cohort, older adults who had several falls in a year were 1.72 times as likely to develop new mobility limitations over the next four years, independent of fear of falling (Liu et al., BMC Geriatrics, 2021; NHATS).
- 27.2% of patients aged 70+ seen in a Dutch emergency department after a fall had a decline in daily functioning three months later, and 22.9% at 12 months (Blomaard et al., Scandinavian Journal of Trauma, Resuscitation and Emergency Medicine, 2021).
- 29.6% of people aged 65+ seen in Spanish emergency departments after a fall had a clinically significant loss of independence in daily activities six months later (133 of 452) (Miro et al., Maturitas, 2019; FALL-ER registry).
Numbers we will not publish. "Half of older people who fall will fall again within six months" comes from the opening line of a conference abstract with no reference; the studies on this page put it at 11.2% to 22.6% for people sent home from emergency departments, and 58% only among fallers whom paramedics left at home. "Falls cause 40% of nursing-home admissions" is attributed to a 1997 study we could not trace it to; the measured risks are in the care-home list above.
Sources: American Journal of Epidemiology; Clinical Epidemiology; New England Journal of Medicine; BMJ; Age and Ageing (1997-2026); Journal of Trauma and Acute Care Surgery; Western Journal of Emergency Medicine; Trauma Surgery & Acute Care Open; BMC Geriatrics (2021, 2024, 2025); Injury (2016, 2018); Health Services Research; JAMA Network Open; European Geriatric Medicine (2024, 2025); Gerontology (1982, 2020); Health & Social Work; Journal of the American Geriatrics Society (2002); Maturitas; Emergencias (2018, 2022); Annals of Emergency Medicine (2017, 2022); Quality and Safety in Health Care; Australian and New Zealand Journal of Public Health; The Lancet; Epidemiology; Innovation in Aging; Journal of the American Medical Directors Association; American Journal of Emergency Medicine; Public Health Agency of Canada; Frontiers in Public Health; Journal of Preventive Medicine and Public Health; The Scientific World Journal; Prehospital Emergency Care; Journals of Gerontology Series A; PLOS Medicine; Scandinavian Journal of Trauma, Resuscitation and Emergency Medicine
14 / Falls in numbers
How many older adults fall, and how many die from falls?
Falls killed 43,020 Americans 65 and older in 2024 (CDC).
- More than 14 million Americans 65 and older, one in four, report a fall each year (2020-2021).
- The US fall death rate for people 65 and older reached 78.4 per 100,000 in 2024, up 21% from 2018.
- Worldwide, falls kill an estimated 684,000 people a year (2021).
- Nearly 319,000 older Americans are hospitalized for a hip fracture each year (2026).
- More than 14.2 million people worldwide break a hip each year, 280,000 of them in the US (2026).
How many fall, how many cannot get up, the hours on the floor, ambulance calls and costs are on the companion page on falls and the long lie.
Sources: CDC WISQARS; CDC Injury Center (2026a, 2026b); World Health Organization; JAMA
More statistics (7)
In 2024, 43,020 U.S. adults aged 65 and over died from unintentional falls (CDC WISQARS 2024 leading causes chart).
- Over 14 million, or 1 in 4, U.S. older adults report falling every year (CDC Older Adult Falls Data, reviewed 2026).
- The age-adjusted unintentional fall death rate among U.S. adults 65+ reached 78.4 per 100,000 in 2024, up 21% from 2018 (CDC Older Adult Falls Data, 2026).
- An estimated 684,000 people die from falls globally each year (WHO Falls fact sheet, 2021).
- Nearly 319,000 U.S. older adults are hospitalized for hip fractures each year (CDC Facts About Falls, 2026).
- More than 14.2 million people worldwide, 280,000 of them in the US, have a hip fracture each year (Johannesdottir et al., JAMA, 2026).
- An estimated 740,000 deaths worldwide were associated with hip fracture in 1990, out of 1.31 million new hip fractures (Johnell & Kanis, Osteoporosis International, 2004).
A number to quote with care. The "740,000 deaths a year from hip fractures" is an estimate of deaths associated with a hip fracture worldwide in 1990, not deaths caused by it; only some of the deaths after a hip fracture are caused by the fracture (see the section on causes).
Sources: CDC WISQARS; CDC Injury Center (2026); World Health Organization; JAMA; Osteoporosis International
15 / Data
Download the data
All 1,622 statistics on this page, each with its source, verbatim quote and locator: CSV · JSON
Data behind each chart (CSV, 32 files)
- Hip fracture: 30-day mortality rises from 1.96% at 60-69 to 10.35% at 90 and over
- After a fall that needed an ambulance: 4.7% died within a month, 21.1% within a year
- Median survival after hip-fracture surgery falls from 8.18 years at 65-69 to 1.75 at 90 and over
- US fall deaths at 65 and over: a head injury on 48.7% of death certificates, a hip fracture on 29.5%
- One-year mortality after a hip fracture: from 18.2% in South Korea to 27.6% in New Zealand
- Hip fracture at 100: 34% of Danish centenarians died within 30 days, 66% within a year
- US deaths from fall-related brain injury at 75 and over rose from 39.7 to 62.7 per 100,000 (2007-2021)
- Fragility fracture of the pelvis: 17% died within a year, 46% within five years
- One year after a broken hip, pelvis or thigh bone in Sweden: 20% to 25% had died
- After a spinal compression fracture: 53.9% of Medicare patients alive at three years, 10.5% at seven
- One year after a fracture at 66 or older: 24.6% died after a broken hip, 4.4% after a broken wrist
- A year after a hip fracture, of those who were independent before it: 36% independent again, 37% dead
- After an emergency visit for a fall: 15.0% back within 30 days, 41.3% within a year
- England, Wales and Northern Ireland: 30-day mortality after a hip fracture, 8.3% in 2012, 6.1% in 2025
- Finland: one-year mortality after hip-fracture surgery fell from 32.8% to 21.0% (2000-2023)
- Australia and New Zealand: 30-day mortality after hip-fracture surgery, 2016-2025
- Australia and New Zealand: one-year mortality after hip-fracture surgery, 2016-2024
- Australia and New Zealand: hip-fracture surgery within 48 hours, 2016-2023
- Canada: hip-fracture surgery within 48 hours of admission, 2012-13 to 2025-26
- Sweden: hip-fracture surgery within 24 hours fell from 71% in 2014 to 56% in 2024
- Sweden: one-year survival after a first hip fracture barely changed from 1998 to 2017
- Denmark: one-year and 30-day mortality after hip-fracture surgery, 2017-18 to 2024-25
- Denmark: hip-fracture surgery within 24 hours, 2018-19 to 2024-25
- Spain: 30-day and in-hospital mortality after a hip fracture, 2017-2023
- England, Wales and Northern Ireland: surgery on the day of or after presentation fell from 69.3% to 56.7% (2017-2025)
- Finland: hip-fracture patients waiting more than two days for surgery fell from 13.7% to 7.0% (2000-2023)
- Finland: alive and at home within 90 days of a hip fracture, 59.2% in 2000-2001, 79.2% in 2022-2023
- England, Wales and Northern Ireland: back where they lived before the fracture, 70.3% in 2017, 75.0% in 2025
- Spain: walking independently 30 days after a hip fracture, 2017-2023
- Australia and New Zealand: back in their own home 120 days after a hip fracture, 2018-2022
- US deaths from a brain injury caused by a fall rose from 12,311 in 2008 to 17,408 in 2017
- US veterans after hip-fracture surgery: 8.9% of men and 13.69% of women alive after ten years
Charts and figures on this page may be reused with a link to https://caretrigger.io/research/life-expectancy-after-a-fall-statistics as the source.
16 / Methodology
Methodology
What we included. Published figures on what happens to older adults after a fall: deaths within set times after a fall that needed care, after a hip, pelvic, femur, spine, rib or other fracture and after a traumatic brain injury; life expectancy, median survival and years of life lost; causes of death; recovery of walking and daily activities; return home and moves into care; and the indicators that national hip-fracture registries publish. National registries and official statistics, peer-reviewed studies and meta-analyses are preferred. A few narrative reviews and one conference abstract are included where they are the only or the most cited source, and are labelled as such.
How each figure was verified. Every record carries the exact sentence or table cell from the source (quote) and where it sits (locator). A researcher confirmed each one against the source document, downloading and parsing PDFs and spreadsheets rather than reading web summaries of them; a script then re-fetched every source on the date shown at the top of the page, using publisher APIs and PDF text where the web page blocks automated access, and checked for the quote. Records the script could not confirm are kept only if the researcher's check was complete, and are marked for human review in the dataset. Where the same figure was captured twice, one record is kept and the other marked as superseded.
What we excluded. Figures we could not trace to a document, figures for strokes presented as figures for falls, vendor and law-firm pages that cite no source, and the widely repeated claims described in the "Numbers we will not publish" notes. One figure is left out because its source does not say whom it describes.
Rounding and derivation. Numbers are reproduced as published. In the key statistics and in the short sentences at the top of each section, large counts may be rounded; the exact figure is under "More statistics" and in the dataset. Derived figures (a one-year mortality computed from a published survival rate, years of life lost computed from a table of "skeletal ages") say so in the statement and name the inputs. Live registry dashboards carry no publication date and are re-read at each refresh. The bold figure in each statement is a reading aid, not an edit.
Updates. Sources are re-checked and new figures added quarterly, timed to the releases that matter here: the National Hip Fracture Database and the Australian and New Zealand Hip Fracture Registry in September, the Irish Hip Fracture Database in the autumn, the Nordic registries through the year, and CDC's injury data in the spring. The next scheduled refresh is February 2027. Corrections are welcome through the support page.
Cite this page
CareTrigger. "Statistics on Life Expectancy After a Fall: Hip Fracture Mortality, Head Injuries, and Recovery in Older Adults." https://caretrigger.io/research/life-expectancy-after-a-fall-statistics. Last updated 2026-11-04.
17 / FAQ
Frequently asked questions
What is the life expectancy of an elderly person after a fall?
No source gives one figure in years, because falls range from no injury to a broken hip or a bleed on the brain. After a fall that needs emergency care, 15% to 21% die within a year: 16% of Danes 67 and older seen in an emergency department, 15% in a Boston emergency department, and 21.1% of older Americans taken to hospital by ambulance. After a hip fracture, half of US veteran men had died within 2.2 years and half of women veterans within 3.42 years.
What percentage of elderly people die within a year of a hip fracture?
About one in five to one in four. A 2026 JAMA review puts the median across studies at 22%; national registries range from 18.2% in South Korea to 27.6% in New Zealand. In the US, 26.9% of men and 18.5% of women died within a year in 2008-2017. The risk rises steeply with age and is higher for men, people with dementia and people who lived in a care home.
Do half of elderly people die after breaking a hip?
No. We found no source for the claim that half die within a year. National registries put one-year mortality at 18.2% to 27.6%. Half or more die within a year only in particular groups: 53.8% of people aged 100 or more across 23 studies, 52.8% of Danish patients who lived in a care home, and 51.96% of men aged 90 in Germany.
What is the life expectancy after a hip fracture at 80 or 90?
It depends on the group studied, and no figure is a forecast for one person. Among US women veterans, half were alive 3.33 years after surgery at 80-84 and 1.75 years at 90 and older. In Australian aged care homes, a woman of 80 could expect 4.8 more years. Danish men who broke a hip after 80 lived on average 2.1 more years, 3.0 fewer than men of the same age without a fracture.
What do older people die of after a fall or a hip fracture?
In the first weeks, often the injury: a head injury appeared on 48.7% of the death certificates of Americans 65 and older who died from a fall in 2010, and a hip fracture on 29.5%. In Norway, the injury from the fall was the recorded cause of 53.8% of deaths within 30 days of a hip fracture. Over the following years, heart and blood vessel disease leads (44.1% of deaths among Finnish hip-fracture patients), followed by dementia and lung disease.
Is a broken pelvis as serious as a broken hip?
In older people, nearly. Pooled studies find that 17% of people 60 and older with a fragility fracture of the pelvis die within a year and 46% within five years. In Sweden, 21% died within a year of a pelvic fracture, against 25% after a hip fracture, and a 2019 study found no significant difference from same-age patients operated for a femoral neck fracture.
Can you survive a brain bleed after a fall?
Most older people do, but the risk is real. Of older adults with a clinically important bleed inside the skull after a fall, 21% died within 90 days. Of people with a chronic subdural haematoma, 32.9% died within a year in a US population study. Severity matters most: in adults over 60, 10.7% died within a year of a mild brain injury and 79.3% of a severe one.
Which sources should I cite for life expectancy after a fall?
For hip-fracture mortality: the 2026 JAMA review (Johannesdottir and colleagues) and the national registries (the National Hip Fracture Database for England, Wales and Northern Ireland, the Australian and New Zealand Hip Fracture Registry, the Danish Multidisciplinary Hip Fracture Registry). For life expectancy in years: Vestergaard and colleagues (Acta Orthopaedica, 2009) and the US veterans studies (Lee, 2023; Bernstein, 2022). For excess deaths against people of the same age: Haentjens and colleagues (Annals of Internal Medicine, 2010). For causes of fall deaths: Stevens and Rudd (Journal of the American Geriatrics Society, 2014). The dataset on this page carries the verbatim source quote for every figure.
Sources: Age and Ageing; American Journal of Emergency Medicine; Western Journal of Emergency Medicine; Frontiers in Surgery; Cureus; JAMA; Osteoporosis International; Australian and New Zealand Hip Fracture Registry; European Geriatric Medicine; Danish Multidisciplinary Hip Fracture Registry; Wissenschaftliches Institut der AOK; Scientific Reports; Acta Orthopaedica (2021, 2009); Journal of the American Geriatrics Society; BMC Geriatrics (2023, 2019); BMC Musculoskeletal Disorders; Injury; CMAJ; Stroke; NeuroRehabilitation; National Hip Fracture Database; Annals of Internal Medicine
18 / Sources
Sources
Every publication behind the figures on this page, by publisher. The dataset gives the source, the verbatim quote and its location for each statistic.
Show all 484 sources
Loading the list of sources…