Key statistics
Key statistics on loneliness
- About one in six people worldwide, 16%, experienced loneliness in 2014-2023, by the World Health Organization's estimate (2025).
- 16.3 million adults in the US said they always or usually feel lonely in September-October 2026.
- Feeling isolated jumped to 55.7% of Americans aged 50 to 80 in June 2020, from 26.6% in 2018, then fell back to 29.2% by 2024.
- Worldwide, people 60 and older are the least lonely age group, 11.8%, against 20.9% of 13- to 17-year-olds (2025).
- 29.5% of Americans 85 and older living at home feel lonely at least sometimes, as many as at 18 to 29 (2024).
- 25% of US men aged 15 to 34 felt lonely a lot of the previous day, against an OECD median of 15% (2023-2024).
- 24.3% of people in low-income countries are lonely, more than twice the 10.6% in high-income countries (2014-2023).
- The WHO's model attributes about 871,000 deaths a year to loneliness, one risk estimate applied to every age and region (2014-2019).
Sources: World Health Organization (2025a, 2025b); U.S. Census Bureau; JAMA; National Center for Health Statistics; Gallup
Loneliness is the feeling of lacking the connection you want; social isolation is having few contacts. This page collects the figures we could verify from the surveys that measure them: how many people are lonely, how that has changed, by age, gender and country, how many older adults are lonely or isolated and who is most at risk, how often older people are in touch with others, and what loneliness and isolation are linked to and cost. Every figure names its question, because the same population can be 5% lonely on one question and 40% on another. Health findings are associations, not proof of cause.
01 / How many
How many people are lonely?
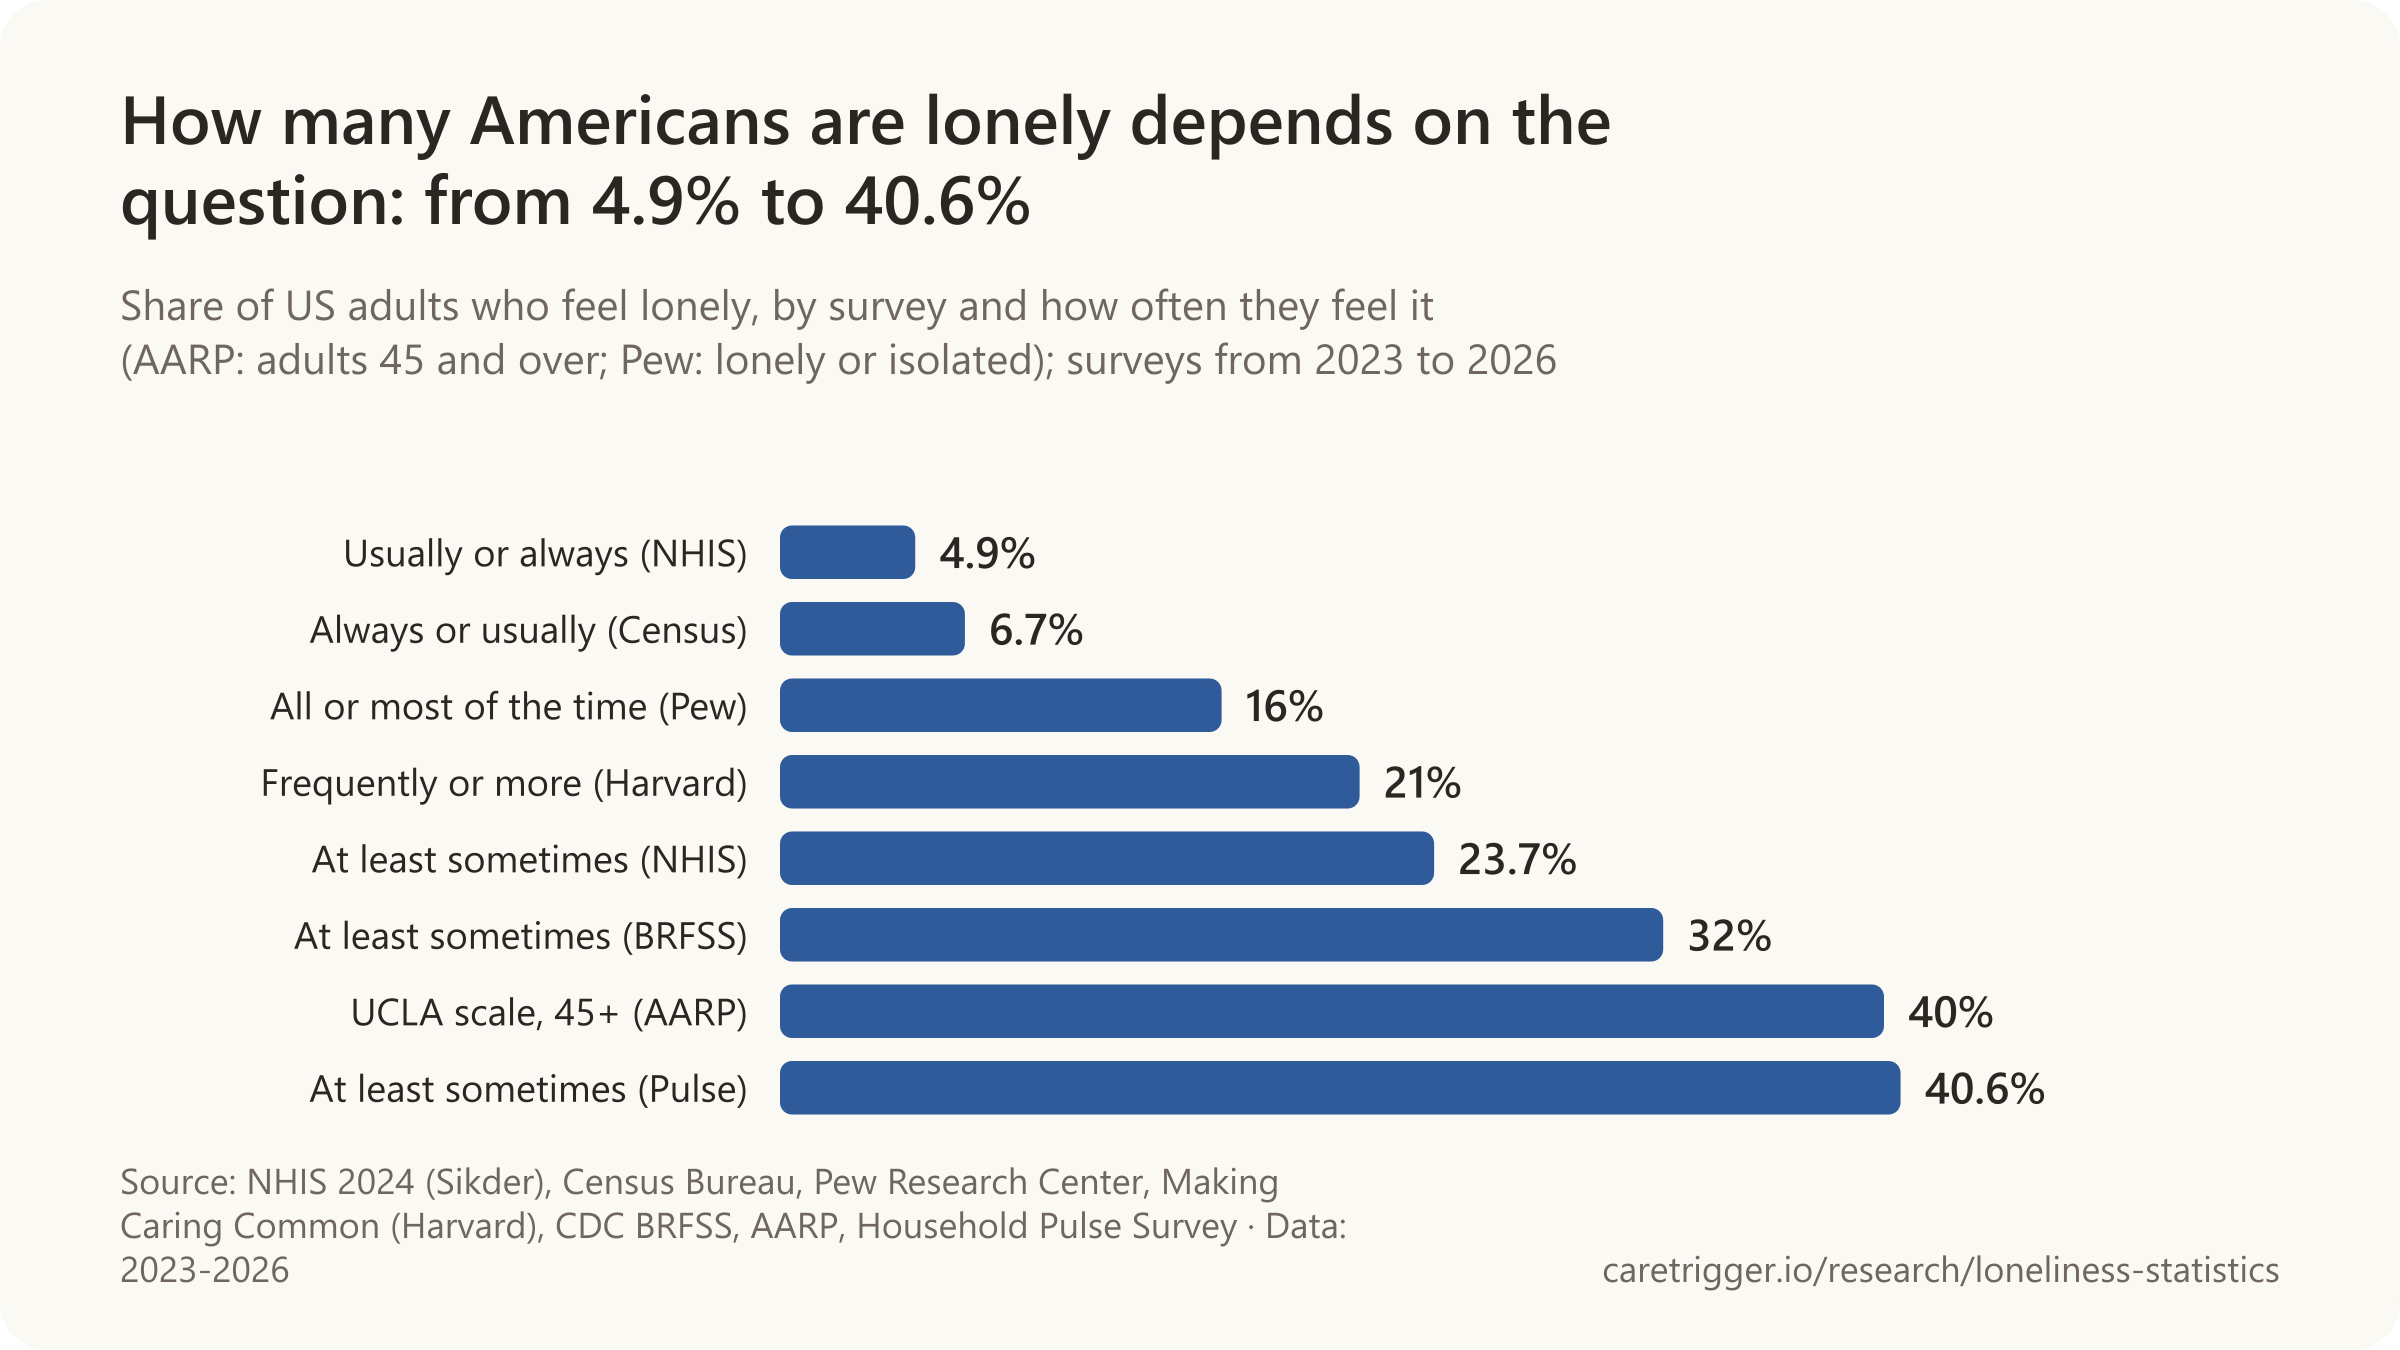
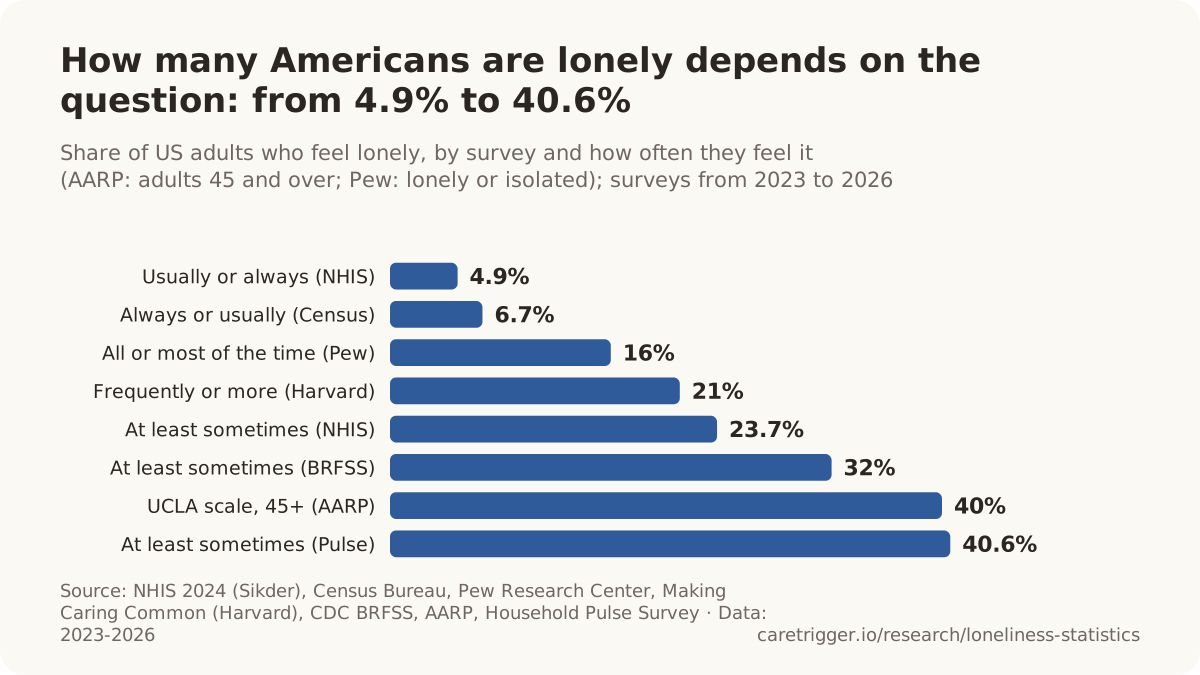
About one in six people worldwide, 16%, experienced loneliness in 2014-2023, by the World Health Organization's estimate (WHO, 2025).

- 16.3 million adults in the US said they always or usually feel lonely in September-October 2026.
- 16% of US adults feel lonely or isolated all or most of the time, up from 10% in 2018 (Pew Research Center, 2025).
- 23.7% of US adults, about 59 million, feel lonely at least sometimes in the first federal health survey to ask directly (2024).
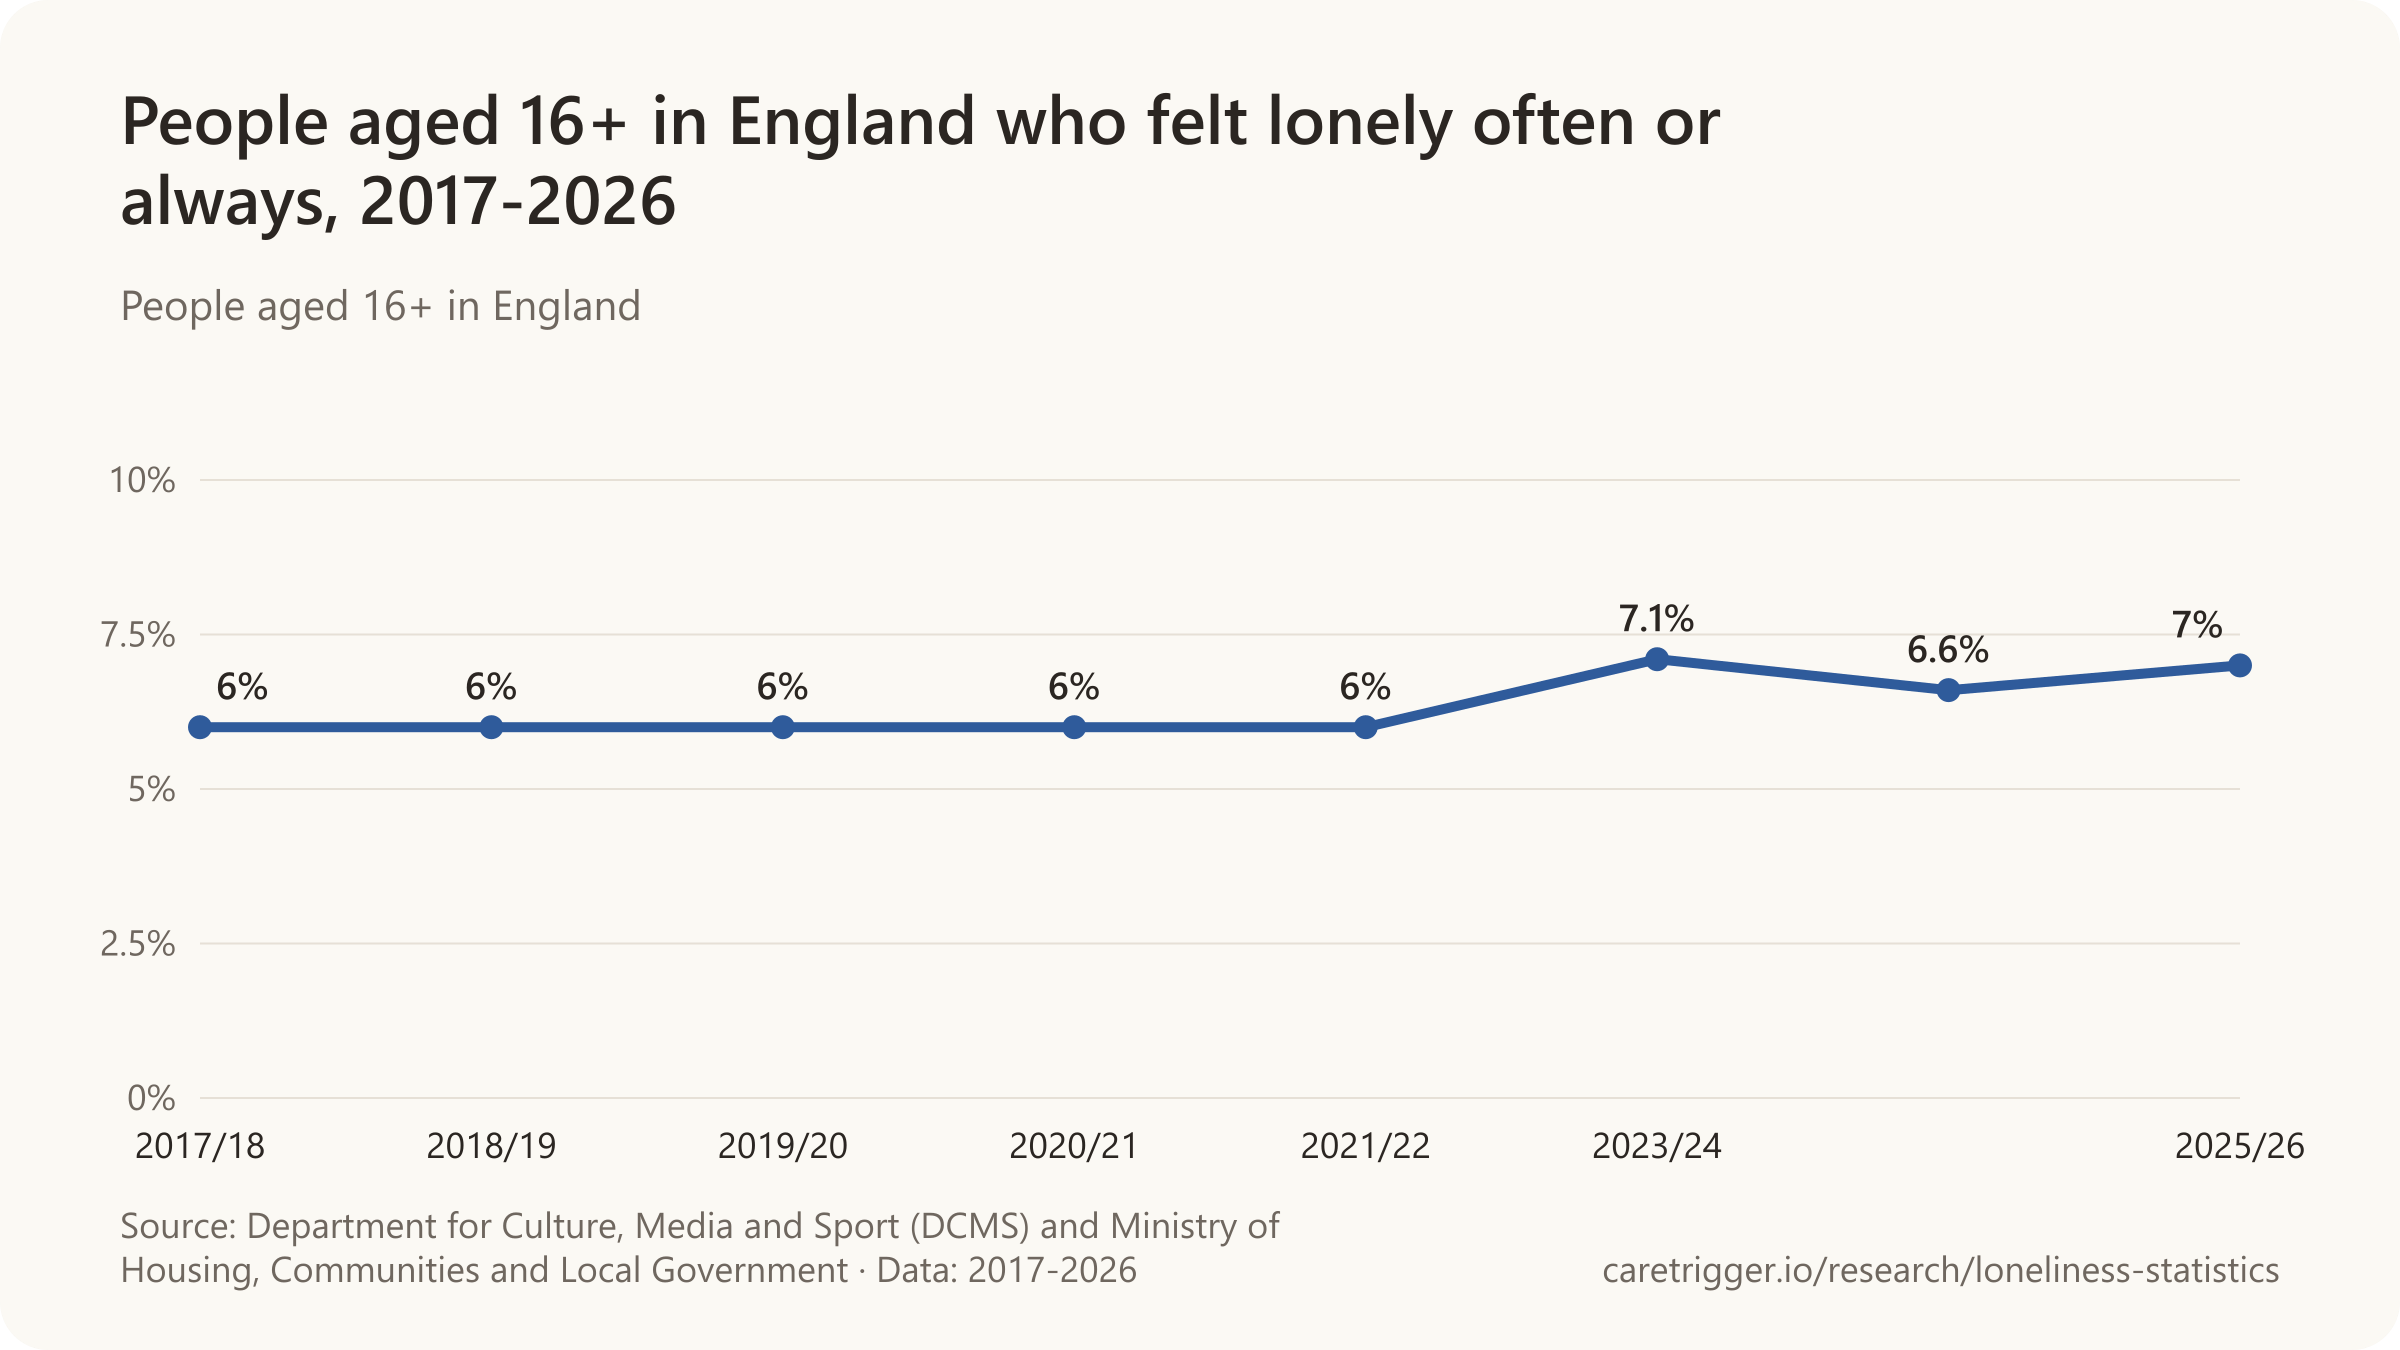
- 7% of people 16 and older in England felt lonely often or always in 2025/26, no significant change from the year before.
- 24% of people 15 and older in 142 countries felt very or fairly lonely, in a Gallup survey for Meta (2022-2023).
The share depends on the question: how often ("always or usually", "at least sometimes"), over what period, and whether people are asked directly or scored on a scale. Each figure on this page names its question; see how loneliness is measured.
Sources: World Health Organization; medRxiv; U.S. Census Bureau; Pew Research Center; Making Caring Common, Harvard Graduate School of Education; CDC, PLACES: Local Data for Better Health; AARP Research; National Center for Health Statistics and U.S. Census Bureau; Department for Culture, Media and Sport and Ministry of Housing, Communities and Local Government; Gallup
More statistics (189)
16% of people worldwide, about one in six, experienced loneliness in 2014-2023, according to the WHO Commission on Social Connection (WHO, 2025).
Loneliness is the feeling of being alone or lacking connection; social isolation is having few contacts. Surveys ask about the feeling directly ("How often do you feel lonely?") or score it on a short scale such as the 3-item UCLA Loneliness Scale, and count anyone above a threshold. The same population gives 5% on one question and 40% on another, so compare only figures with the same question.
- 24% of people aged 15 and over in 142 countries felt very or fairly lonely in 2022-2023, more than 1 billion people (Meta-Gallup Global State of Social Connections, a Gallup survey for Meta, 2023).
- 8% of people aged 15 and over in 142 countries felt very lonely, the strongest answer offered, about 374 million people (Meta-Gallup Global State of Social Connections, a Gallup survey for Meta, 2023).
- 49% of people aged 15 and over in 142 countries said they did not feel lonely at all, about 2.2 billion people (Meta-Gallup Global State of Social Connections, a Gallup survey for Meta, 2023).
- 72% of people aged 15 and over in 142 countries felt very or fairly connected to other people, while 6% did not feel connected at all (Meta-Gallup Global State of Social Connections, a Gallup survey for Meta, 2023).
United States: federal surveys

- 16.3 million adults in the US said they always or usually feel lonely in September-October 2026 (Household Trends and Outlook Pulse Survey, Census Bureau, 2026).
- 23.7% of US adults, an estimated 59.3 million people, said they feel lonely at least sometimes in 2024 (Sikder, NHIS 2024 analysis, medRxiv preprint, 2026).
- 2.38 times the adjusted prevalence of a depression history (3.61 times for stress) was found among adults in 26 US states who reported the BRFSS loneliness item in 2022, compared with those who did not (Bruss et al., MMWR, 2024).
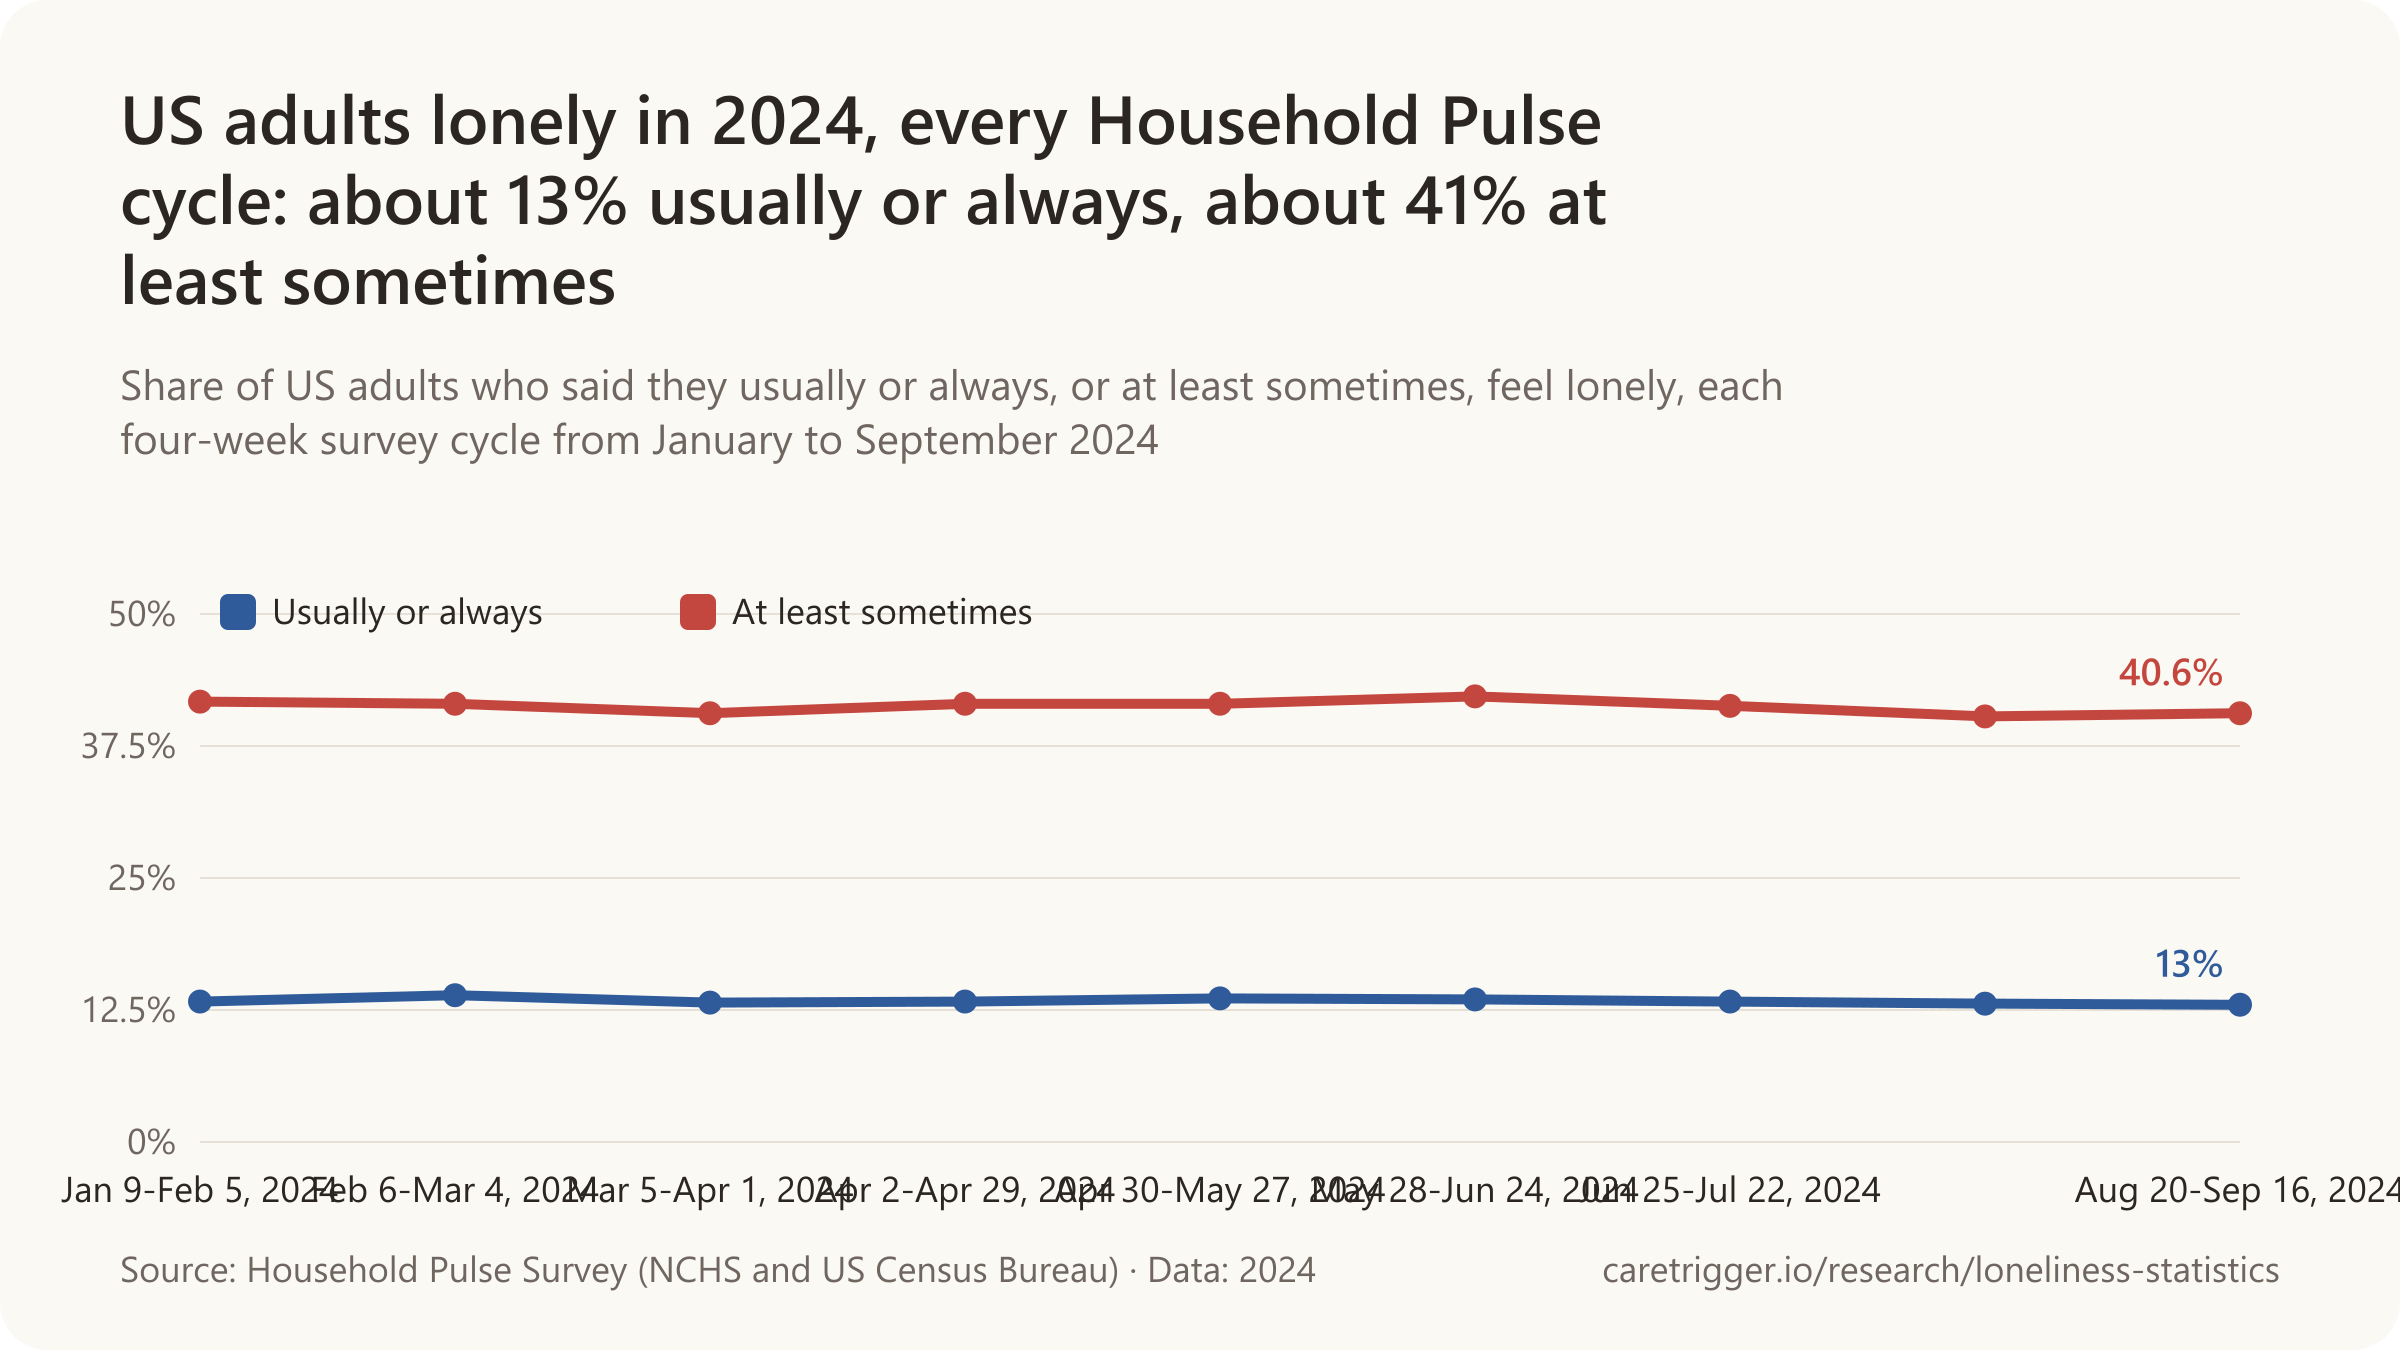
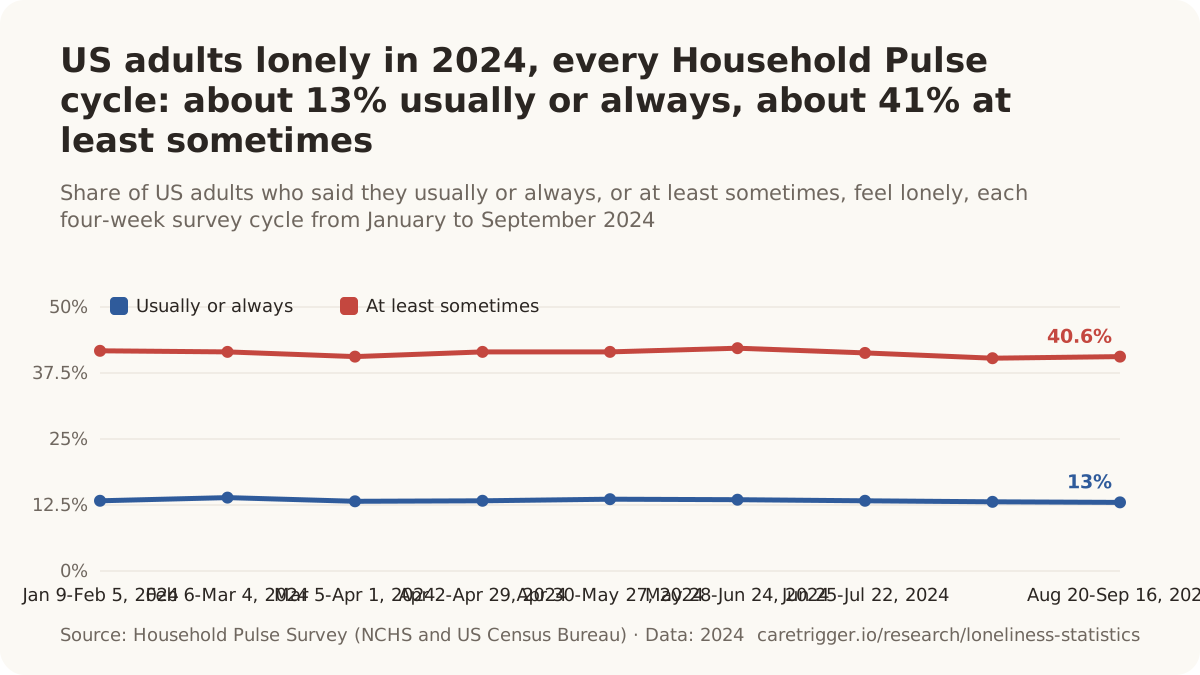
- 41% of US adults said they sometimes, rarely or never get the social and emotional support they need, Aug 20-Sep 16, 2024 (Household Pulse Survey, NCHS and US Census Bureau, 2024).
- 46.1% of US adults said they talk on the telephone with family, friends or neighbors less than three times in a typical week, Aug 20-Sep 16, 2024 (Household Pulse Survey, NCHS and US Census Bureau, 2024).
- 78% of US adults said they get together with friends or relatives less than three times in a typical week, Aug 20-Sep 16, 2024 (Household Pulse Survey, NCHS and US Census Bureau, 2024).
- 69% of US adults said they attend church or religious services less than four times a year, Aug 20-Sep 16, 2024 (Household Pulse Survey, NCHS and US Census Bureau, 2024).
- 76.9% of US adults said they attend meetings of clubs or organizations less than three times a year, or never, Aug 20-Sep 16, 2024 (Household Pulse Survey, NCHS and US Census Bureau, 2024).
- 7% of US adults said they always or usually feel lonely in September-October 2026, and 65% said they always or usually get the social and emotional support they need (Census Bureau, Loneliness and Social Engagement, 2026).
- About 1 in 3 adults in the US report feeling lonely, CDC states, citing the 2022 BRFSS item that asked how often people feel socially isolated from others (CDC, 2024).
- 23.3% of adults in 39 US states and DC said they get the social and emotional support they need only sometimes, rarely or never in 2023 (CDC PLACES, BRFSS 2023).
- 29% of US households, 39.7 million, were one-person households in 2025, up from 20% in 1975 (Census Bureau, Current Population Survey, 2025).
- 13% of US households were one-person households in 1960, against 29% (37.9 million) in 2022 (Census Bureau, 2022).
- 50.6% of US adults said they never feel lonely in 2024, while 2.5% said always, 2.4% usually, 18.8% sometimes and 25.7% rarely (Sikder, NHIS 2024 analysis, medRxiv preprint, 2026).
- 5.7% of adults in nonmetropolitan (rural) US counties said they usually or always feel lonely in 2024, against 4.9% in large central metropolitan counties (Sikder, NHIS 2024 analysis, medRxiv preprint, 2026).
- 19.6% of US adults who rarely or never get the social and emotional support they need said they usually or always feel lonely in 2024, against 3.6% of others (Sikder, NHIS 2024 analysis, medRxiv preprint, 2026).
- 30.4% of frequently lonely US adults had serious psychological distress in 2024 (adjusted odds ratio 14.5, 95% CI 12.1-17.3), against 2.4% of other adults (Sikder, NHIS 2024 analysis, medRxiv preprint, 2026).
- 1.8 times the odds of an emergency department visit in the past year were found among frequently lonely US adults in 2024, after adjusting for sociodemographic characteristics (Sikder, NHIS 2024 analysis, medRxiv preprint, 2026).
| Household income | Felt isolated | Scope |
|---|---|---|
| Household income below $25,000 | 47.9% | adults with household incomes below $25,000 in 26 US states; felt socially isolated from others always, usually or sometimes · United States (26 states) · 2022 |
| Household income $25,000-$49,999 | 36.2% | adults with household incomes of $25,000-$49,999 in 26 US states; felt socially isolated from others always, usually or sometimes · United States (26 states) · 2022 |
| Household income $50,000-$74,999 | 30.4% | adults with household incomes of $50,000-$74,999 in 26 US states; felt socially isolated from others always, usually or sometimes · United States (26 states) · 2022 |
| Household income $75,000-$99,999 | 27% | adults with household incomes of $75,000-$99,999 in 26 US states; felt socially isolated from others always, usually or sometimes · United States (26 states) · 2022 |
| Household income $100,000-$149,999 | 23.6% | adults with household incomes of $100,000-$149,999 in 26 US states; felt socially isolated from others always, usually or sometimes · United States (26 states) · 2022 |
| Household income $150,000 or more | 21.2% | adults with household incomes of $150,000 or more in 26 US states; felt socially isolated from others always, usually or sometimes · United States (26 states) · 2022 |
| Race and ethnicity | Felt isolated | Scope |
|---|---|---|
| Non-Hispanic White adults | 29.6% | non-Hispanic White adults in 26 US states; felt socially isolated from others always, usually or sometimes · United States (26 states) · 2022 |
| Non-Hispanic Black adults | 36.4% | non-Hispanic Black adults in 26 US states; felt socially isolated from others always, usually or sometimes · United States (26 states) · 2022 |
| Hispanic or Latino adults | 37.5% | Hispanic or Latino adults in 26 US states; felt socially isolated from others always, usually or sometimes · United States (26 states) · 2022 |
| Non-Hispanic Asian adults | 32% | non-Hispanic Asian adults in 26 US states; felt socially isolated from others always, usually or sometimes · United States (26 states) · 2022 |
| Non-Hispanic American Indian or Alaska Native adults | 37.9% | non-Hispanic American Indian or Alaska Native adults in 26 US states; felt socially isolated from others always, usually or sometimes · United States (26 states) · 2022 |
| Non-Hispanic multiracial adults | 40.1% | non-Hispanic multiracial adults in 26 US states; felt socially isolated from others always, usually or sometimes · United States (26 states) · 2022 |
United States: polls
- 16% of US adults said they feel lonely or isolated from those around them all or most of the time in September 2024 (Pew Research Center, 2025).
- 57.9 million adults aged 45 and older in the US were lonely on the UCLA Loneliness Scale in 2025 by AARP's projection, 10.2 million more than in 2018 (AARP Research, 2025).
- 38% of US adults aged 45 and older who feel lonely always or sometimes said the feeling has lasted six years or more in 2025, about 18.2 million people (AARP Research, 2025).
- 62% of US adults aged 45 and older who feel lonely always or sometimes said there is no specific source of their loneliness in 2025, up from 57% in 2010 (AARP Research, 2025).
- 7.3 hours a day are spent alone on average by lonely US adults aged 45 and older, against 5.6 hours for all adults 45 and older and 4.6 hours for those who are not lonely (AARP Research, 2025).
- 29% of US adults aged 45 and older said they have fewer friends than five years ago in 2025, up from 25% in 2018 and 23% in 2010 (AARP Research, 2025).
- 25% of lonely US adults aged 45 and older said they have no close friends in 2025, against 15% of all adults 45 and older (AARP Research, 2025).
- 23% of lonely US adults aged 45 and older said they are interested in AI technologies for companionship, conversation and connection reminders in 2025 (AARP Research, 2025).
- 50% of US adults aged 45 and older with household incomes under $25,000 were lonely on the UCLA Loneliness Scale in 2018, against 31% of those earning over $75,000 (AARP Research, 2018).
- 51% of never-married US adults aged 45 and older were lonely on the UCLA Loneliness Scale in 2018, against 31% of married adults (AARP Research, 2018).
- 14 percentage points more US adults aged 45 and older who identify as LGBTQ were lonely in 2018 than other adults 45 and older (AARP Research, 2018).
- 61% of US adults aged 45 and older who have never spoken to a neighbor were lonely in 2018, against 33% of those who have (AARP Research, 2018).
- 51% of US adults aged 45 and older in fair or poor health were lonely on the UCLA Loneliness Scale in 2018, against 27% of those in excellent or very good health (AARP Research, 2018).
- 41% of lonely US adults aged 45 and older said their loneliness had persisted six years or more in 2018 (AARP Research, 2018).
- 14% of US adults who felt lonely a lot of the previous day rated their current life 0-3 on a 0-10 scale in 2024, against 3% of those who did not (Gallup Panel, Gallup, 2024).
- 33% of US adults who felt lonely a lot of the previous day currently had or were being treated for depression in February 2023, against 13% of those who were not lonely (Gallup Panel, Gallup, 2023).
- 29% of US adults earning under $30,000 a year said they felt lonely frequently or almost all of the time in the past 30 days in May 2024, against 18% of those earning over $100,000 (Making Caring Common, Harvard, 2024).
- 42% of US adults with two or more racial identities said they felt lonely frequently or almost all of the time in the past 30 days in May 2024 (Making Caring Common, Harvard, 2024).
- 81% of seriously lonely US adults reported anxiety or depression in May 2024, against 29% of adults who were less or not lonely (Making Caring Common, Harvard, 2024).
- 67% of seriously lonely US adults said they do not have meaningful groups or communities they are really a part of, in May 2024 (Making Caring Common, Harvard, 2024).
- 36% of US adults in an online convenience sample said they felt lonely frequently or almost all the time in the prior four weeks in October 2020 (Making Caring Common, Harvard, 2021).
- 22% of US adults said they often or always feel lonely, lack companionship, feel left out or feel isolated in 2018, against 23% in the UK and 9% in Japan (KFF and The Economist, 2018).
- 22% of US adults who report loneliness said they have felt isolated or lonely for more than 10 years in 2018, against 35% in Japan (KFF and The Economist, 2018).
- 47% of US adults called loneliness and social isolation more of a public health problem in 2018, while 45% called it more of an individual problem (KFF and The Economist, 2018).
- 4% of US adults said they use AI chatbots for companionship in February 2026, and 10% for emotional support or advice (Pew Research Center, 2026).
- 15.3% of 4,885 US volunteers aged 10-97 who took a web test scored the maximum on the 3-item UCLA Loneliness Scale, meaning they often feel lonely (Shovestul et al., PLOS ONE, 2020).
- 25% of US adults aged 30-70 scored as lonely on a 4-item PROMIS loneliness scale in 2023 (Gorman et al., International Journal of Environmental Research and Public Health, 2025).
- 38% of US adults said they sometimes feel lonely or isolated from those around them in September 2024, and 47% said hardly ever or never (Pew Research Center, 2025).
- 22% of US adults under 50 said they feel lonely or isolated all or most of the time in September 2024, against 9% of adults 50 and older (Pew Research Center, 2025).
- 29% of US adults with at least one close friend said they see a close friend in person at least a few times a week in September 2024, while 61% text one that often (Pew Research Center, 2025).
- 8% of US adults said they have no close friends in July 2023, while 38% said they have five or more (Pew Research Center, 2023).
- 20% of US adults who know none of their neighbors said they feel lonely or isolated all or most of the time in 2018, against 6% of those who know most or all of them (Pew Research Center, 2018).
Who is lonelier in the United States
| Group | Lonely | Scope |
|---|---|---|
| Household income $100,000 or more | 32% | US adults aged 45 and older with household incomes of $100,000 or more; UCLA-20 score 44+ · United States · August 4-19, 2025 |
| Never married | 62% | US adults aged 45 and older who never married; UCLA-20 score 44+ · United States · August 4-19, 2025 |
| Divorced or separated | 47% | US adults aged 45 and older who are divorced or separated; UCLA-20 score 44+ · United States · August 4-19, 2025 |
| Married | 34% | US adults aged 45 and older who are married; UCLA-20 score 44+ · United States · August 4-19, 2025 |
| Not working | 57% | US adults aged 45 and older who are not working; UCLA-20 score 44+ · United States · August 4-19, 2025 |
| LGBTQ+ | 46% | US adults aged 45 and older who identify as LGBTQ+; UCLA-20 score 44+ · United States · August 4-19, 2025 |
| Caregivers | 43% | US adults aged 45 and older who are caregivers; UCLA-20 score 44+ · United States · August 4-19, 2025 |
| Rural | 44% | US adults aged 45 and older living in rural areas; UCLA-20 score 44+ · United States · August 4-19, 2025 |
| Suburban | 36% | US adults aged 45 and older living in suburbs; UCLA-20 score 44+ · United States · August 4-19, 2025 |
| Black | 42% | US adults aged 45 and older who are Black; UCLA-20 score 44+ · United States · August 4-19, 2025 |
| Hispanic | 41% | US adults aged 45 and older who are Hispanic; UCLA-20 score 44+ · United States · August 4-19, 2025 |
| Asian American, Native Hawaiian or Pacific Islander | 46% | US adults aged 45 and older who are Asian American, Native Hawaiian or Pacific Islander; UCLA-20 score 44+ · United States · August 4-19, 2025 |
| White | 38% | US adults aged 45 and older who are White; UCLA-20 score 44+ · United States · August 4-19, 2025 |
| Group | Usually or always lonely | Scope |
|---|---|---|
| Men | 12.4% | US men (18+), living in households; usually or always feel lonely · United States · Aug 20-Sep 16, 2024 |
| Women | 13.7% | US women (18+), living in households; usually or always feel lonely · United States · Aug 20-Sep 16, 2024 |
| Cisgender men | 11.9% | cisgender US men (18+), living in households; usually or always feel lonely · United States · Aug 20-Sep 16, 2024 |
| Cisgender women | 13.3% | cisgender US women (18+), living in households; usually or always feel lonely · United States · Aug 20-Sep 16, 2024 |
| Transgender adults | 41.5% | transgender US adults (18+), living in households; usually or always feel lonely · United States · Aug 20-Sep 16, 2024 |
| Gay or lesbian | 20.5% | gay or lesbian US adults (18+), living in households; usually or always feel lonely · United States · Aug 20-Sep 16, 2024 |
| Straight | 11.7% | straight US adults (18+), living in households; usually or always feel lonely · United States · Aug 20-Sep 16, 2024 |
| Bisexual | 26.3% | bisexual US adults (18+), living in households; usually or always feel lonely · United States · Aug 20-Sep 16, 2024 |
| Hispanic or Latino | 14% | Hispanic or Latino US adults (18+), living in households; usually or always feel lonely · United States · Aug 20-Sep 16, 2024 |
| White, non-Hispanic | 12.2% | non-Hispanic White US adults (18+), living in households; usually or always feel lonely · United States · Aug 20-Sep 16, 2024 |
| Black, non-Hispanic | 15.3% | non-Hispanic Black US adults (18+), living in households; usually or always feel lonely · United States · Aug 20-Sep 16, 2024 |
| Asian, non-Hispanic | 10.4% | non-Hispanic Asian US adults (18+), living in households; usually or always feel lonely · United States · Aug 20-Sep 16, 2024 |
| Other or multiple races, non-Hispanic | 17.7% | non-Hispanic US adults of other or multiple races (18+), living in households; usually or always feel lonely · United States · Aug 20-Sep 16, 2024 |
| Less than high school | 17.5% | US adults without a high school diploma (18+), living in households; usually or always feel lonely · United States · Aug 20-Sep 16, 2024 |
| High school diploma or GED | 15.2% | US adults with a high school diploma or GED (18+), living in households; usually or always feel lonely · United States · Aug 20-Sep 16, 2024 |
| Some college or associate's degree | 14.8% | US adults with some college or an associate's degree (18+), living in households; usually or always feel lonely · United States · Aug 20-Sep 16, 2024 |
| Bachelor's degree or higher | 8.6% | US adults with a bachelor's degree or higher (18+), living in households; usually or always feel lonely · United States · Aug 20-Sep 16, 2024 |
| With a disability | 30.2% | US adults with a disability (18+), living in households; usually or always feel lonely · United States · Aug 20-Sep 16, 2024 |
| Without a disability | 10.4% | US adults without a disability (18+), living in households; usually or always feel lonely · United States · Aug 20-Sep 16, 2024 |
US states and cities
| State | Usually or always lonely | Scope |
|---|---|---|
| Maine | 17.7% | adults in Maine (18+), living in households; usually or always feel lonely · Maine, United States · Aug 20-Sep 16, 2024 |
| Indiana | 17.4% | adults in Indiana (18+), living in households; usually or always feel lonely · Indiana, United States · Aug 20-Sep 16, 2024 |
| Idaho | 17.2% | adults in Idaho (18+), living in households; usually or always feel lonely · Idaho, United States · Aug 20-Sep 16, 2024 |
| Alaska | 16.6% | adults in Alaska (18+), living in households; usually or always feel lonely · Alaska, United States · Aug 20-Sep 16, 2024 |
| West Virginia | 16.6% | adults in West Virginia (18+), living in households; usually or always feel lonely · West Virginia, United States · Aug 20-Sep 16, 2024 |
| Rhode Island | 16.1% | adults in Rhode Island (18+), living in households; usually or always feel lonely · Rhode Island, United States · Aug 20-Sep 16, 2024 |
| New Hampshire | 16% | adults in New Hampshire (18+), living in households; usually or always feel lonely · New Hampshire, United States · Aug 20-Sep 16, 2024 |
| Oklahoma | 15.6% | adults in Oklahoma (18+), living in households; usually or always feel lonely · Oklahoma, United States · Aug 20-Sep 16, 2024 |
| Missouri | 15.4% | adults in Missouri (18+), living in households; usually or always feel lonely · Missouri, United States · Aug 20-Sep 16, 2024 |
| Oregon | 15.4% | adults in Oregon (18+), living in households; usually or always feel lonely · Oregon, United States · Aug 20-Sep 16, 2024 |
| Connecticut | 15.2% | adults in Connecticut (18+), living in households; usually or always feel lonely · Connecticut, United States · Aug 20-Sep 16, 2024 |
| Utah | 15% | adults in Utah (18+), living in households; usually or always feel lonely · Utah, United States · Aug 20-Sep 16, 2024 |
| Kentucky | 14.9% | adults in Kentucky (18+), living in households; usually or always feel lonely · Kentucky, United States · Aug 20-Sep 16, 2024 |
| California | 14.7% | adults in California (18+), living in households; usually or always feel lonely · California, United States · Aug 20-Sep 16, 2024 |
| Louisiana | 14.6% | adults in Louisiana (18+), living in households; usually or always feel lonely · Louisiana, United States · Aug 20-Sep 16, 2024 |
| Michigan | 14.6% | adults in Michigan (18+), living in households; usually or always feel lonely · Michigan, United States · Aug 20-Sep 16, 2024 |
| Ohio | 14.6% | adults in Ohio (18+), living in households; usually or always feel lonely · Ohio, United States · Aug 20-Sep 16, 2024 |
| Mississippi | 14.5% | adults in Mississippi (18+), living in households; usually or always feel lonely · Mississippi, United States · Aug 20-Sep 16, 2024 |
| Tennessee | 14.5% | adults in Tennessee (18+), living in households; usually or always feel lonely · Tennessee, United States · Aug 20-Sep 16, 2024 |
| New Mexico | 14.3% | adults in New Mexico (18+), living in households; usually or always feel lonely · New Mexico, United States · Aug 20-Sep 16, 2024 |
| District of Columbia | 14.1% | adults in District of Columbia (18+), living in households; usually or always feel lonely · District of Columbia, United States · Aug 20-Sep 16, 2024 |
| Kansas | 14% | adults in Kansas (18+), living in households; usually or always feel lonely · Kansas, United States · Aug 20-Sep 16, 2024 |
| Washington | 13.7% | adults in Washington (18+), living in households; usually or always feel lonely · Washington, United States · Aug 20-Sep 16, 2024 |
| Iowa | 13.6% | adults in Iowa (18+), living in households; usually or always feel lonely · Iowa, United States · Aug 20-Sep 16, 2024 |
| Texas | 13.5% | adults in Texas (18+), living in households; usually or always feel lonely · Texas, United States · Aug 20-Sep 16, 2024 |
| Colorado | 13.4% | adults in Colorado (18+), living in households; usually or always feel lonely · Colorado, United States · Aug 20-Sep 16, 2024 |
| Arkansas | 13.2% | adults in Arkansas (18+), living in households; usually or always feel lonely · Arkansas, United States · Aug 20-Sep 16, 2024 |
| Massachusetts | 13.2% | adults in Massachusetts (18+), living in households; usually or always feel lonely · Massachusetts, United States · Aug 20-Sep 16, 2024 |
| Georgia | 12.9% | adults in Georgia (18+), living in households; usually or always feel lonely · Georgia, United States · Aug 20-Sep 16, 2024 |
| Virginia | 12.9% | adults in Virginia (18+), living in households; usually or always feel lonely · Virginia, United States · Aug 20-Sep 16, 2024 |
| Wyoming | 12.8% | adults in Wyoming (18+), living in households; usually or always feel lonely · Wyoming, United States · Aug 20-Sep 16, 2024 |
| Hawaii | 12.7% | adults in Hawaii (18+), living in households; usually or always feel lonely · Hawaii, United States · Aug 20-Sep 16, 2024 |
| North Carolina | 12.6% | adults in North Carolina (18+), living in households; usually or always feel lonely · North Carolina, United States · Aug 20-Sep 16, 2024 |
| Nebraska | 12.3% | adults in Nebraska (18+), living in households; usually or always feel lonely · Nebraska, United States · Aug 20-Sep 16, 2024 |
| Illinois | 12.2% | adults in Illinois (18+), living in households; usually or always feel lonely · Illinois, United States · Aug 20-Sep 16, 2024 |
| Nevada | 12.2% | adults in Nevada (18+), living in households; usually or always feel lonely · Nevada, United States · Aug 20-Sep 16, 2024 |
| South Carolina | 12.1% | adults in South Carolina (18+), living in households; usually or always feel lonely · South Carolina, United States · Aug 20-Sep 16, 2024 |
| Arizona | 11.6% | adults in Arizona (18+), living in households; usually or always feel lonely · Arizona, United States · Aug 20-Sep 16, 2024 |
| Pennsylvania | 11.4% | adults in Pennsylvania (18+), living in households; usually or always feel lonely · Pennsylvania, United States · Aug 20-Sep 16, 2024 |
| Alabama | 11.2% | adults in Alabama (18+), living in households; usually or always feel lonely · Alabama, United States · Aug 20-Sep 16, 2024 |
| New York | 10.8% | adults in New York (18+), living in households; usually or always feel lonely · New York, United States · Aug 20-Sep 16, 2024 |
| Minnesota | 10.7% | adults in Minnesota (18+), living in households; usually or always feel lonely · Minnesota, United States · Aug 20-Sep 16, 2024 |
| Wisconsin | 10.7% | adults in Wisconsin (18+), living in households; usually or always feel lonely · Wisconsin, United States · Aug 20-Sep 16, 2024 |
| New Jersey | 10.6% | adults in New Jersey (18+), living in households; usually or always feel lonely · New Jersey, United States · Aug 20-Sep 16, 2024 |
| Florida | 10.2% | adults in Florida (18+), living in households; usually or always feel lonely · Florida, United States · Aug 20-Sep 16, 2024 |
| South Dakota | 10.2% | adults in South Dakota (18+), living in households; usually or always feel lonely · South Dakota, United States · Aug 20-Sep 16, 2024 |
| Maryland | 9.9% | adults in Maryland (18+), living in households; usually or always feel lonely · Maryland, United States · Aug 20-Sep 16, 2024 |
| Delaware | 9.6% | adults in Delaware (18+), living in households; usually or always feel lonely · Delaware, United States · Aug 20-Sep 16, 2024 |
| Montana | 9% | adults in Montana (18+), living in households; usually or always feel lonely · Montana, United States · Aug 20-Sep 16, 2024 |
| Vermont | 8% | adults in Vermont (18+), living in households; usually or always feel lonely · Vermont, United States · Aug 20-Sep 16, 2024 |
| North Dakota | 7.8% | adults in North Dakota (18+), living in households; usually or always feel lonely · North Dakota, United States · Aug 20-Sep 16, 2024 |
| Metro area | Lonely at least sometimes | Scope |
|---|---|---|
| Riverside-San Bernardino-Ontario | 45.8% | adults 18+ in the Riverside-San Bernardino-Ontario, CA Metro Area; feel lonely always, usually or sometimes; denominator excludes non-reporters · Riverside-San Bernardino-Ontario, CA Metro Area, United States · August 20-September 16, 2024 |
| Detroit-Warren-Dearborn | 45.8% | adults 18+ in the Detroit-Warren-Dearborn, MI Metro Area; feel lonely always, usually or sometimes; denominator excludes non-reporters · Detroit-Warren-Dearborn, MI Metro Area, United States · August 20-September 16, 2024 |
| Atlanta-Sandy Springs-Alpharetta | 45.5% | adults 18+ in the Atlanta-Sandy Springs-Alpharetta, GA Metro Area; feel lonely always, usually or sometimes; denominator excludes non-reporters · Atlanta-Sandy Springs-Alpharetta, GA Metro Area, United States · August 20-September 16, 2024 |
| Seattle-Tacoma-Bellevue | 45.0% | adults 18+ in the Seattle-Tacoma-Bellevue, WA Metro Area; feel lonely always, usually or sometimes; denominator excludes non-reporters · Seattle-Tacoma-Bellevue, WA Metro Area, United States · August 20-September 16, 2024 |
| Los Angeles-Long Beach-Anaheim | 44.8% | adults 18+ in the Los Angeles-Long Beach-Anaheim, CA Metro Area; feel lonely always, usually or sometimes; denominator excludes non-reporters · Los Angeles-Long Beach-Anaheim, CA Metro Area, United States · August 20-September 16, 2024 |
| Boston-Cambridge-Newton | 43.2% | adults 18+ in the Boston-Cambridge-Newton, MA-NH Metro Area; feel lonely always, usually or sometimes; denominator excludes non-reporters · Boston-Cambridge-Newton, MA-NH Metro Area, United States · August 20-September 16, 2024 |
| New York-Newark-Jersey City | 40.7% | adults 18+ in the New York-Newark-Jersey City, NY-NJ-PA Metro Area; feel lonely always, usually or sometimes; denominator excludes non-reporters · New York-Newark-Jersey City, NY-NJ-PA Metro Area, United States · August 20-September 16, 2024 |
| Philadelphia-Camden-Wilmington | 40.7% | adults 18+ in the Philadelphia-Camden-Wilmington, PA-NJ-DE-MD Metro Area; feel lonely always, usually or sometimes; denominator excludes non-reporters · Philadelphia-Camden-Wilmington, PA-NJ-DE-MD Metro Area, United States · August 20-September 16, 2024 |
| Dallas-Fort Worth-Arlington | 38.6% | adults 18+ in the Dallas-Fort Worth-Arlington, TX Metro Area; feel lonely always, usually or sometimes; denominator excludes non-reporters · Dallas-Fort Worth-Arlington, TX Metro Area, United States · August 20-September 16, 2024 |
| Washington-Arlington-Alexandria | 38.2% | adults 18+ in the Washington-Arlington-Alexandria, DC-VA-MD-WV Metro Area; feel lonely always, usually or sometimes; denominator excludes non-reporters · Washington-Arlington-Alexandria, DC-VA-MD-WV Metro Area, United States · August 20-September 16, 2024 |
| Houston-The Woodlands-Sugar Land | 37.8% | adults 18+ in the Houston-The Woodlands-Sugar Land, TX Metro Area; feel lonely always, usually or sometimes; denominator excludes non-reporters · Houston-The Woodlands-Sugar Land, TX Metro Area, United States · August 20-September 16, 2024 |
| Chicago-Naperville-Elgin | 37.7% | adults 18+ in the Chicago-Naperville-Elgin, IL-IN-WI Metro Area; feel lonely always, usually or sometimes; denominator excludes non-reporters · Chicago-Naperville-Elgin, IL-IN-WI Metro Area, United States · August 20-September 16, 2024 |
| San Francisco-Oakland-Berkeley | 36.6% | adults 18+ in the San Francisco-Oakland-Berkeley, CA Metro Area; feel lonely always, usually or sometimes; denominator excludes non-reporters · San Francisco-Oakland-Berkeley, CA Metro Area, United States · August 20-September 16, 2024 |
| Phoenix-Mesa-Chandler | 34.2% | adults 18+ in the Phoenix-Mesa-Chandler, AZ Metro Area; feel lonely always, usually or sometimes; denominator excludes non-reporters · Phoenix-Mesa-Chandler, AZ Metro Area, United States · August 20-September 16, 2024 |
| Miami-Fort Lauderdale-Pompano Beach | 33.2% | adults 18+ in the Miami-Fort Lauderdale-Pompano Beach, FL Metro Area; feel lonely always, usually or sometimes; denominator excludes non-reporters · Miami-Fort Lauderdale-Pompano Beach, FL Metro Area, United States · August 20-September 16, 2024 |
Close friends
- 49% of US adults said they have three or fewer close friends in May 2021, against 27% in a 1990 Gallup poll (Survey Center on American Life, 2021).
- 24% of US adults with a high school education or less said they have no close friends in 2024, against 10% of college graduates (Survey Center on American Life, 2024).
An insurer's online surveys (Cigna)
- 61% of US adults in an insurer's online survey scored as lonely (43 or higher on the UCLA Loneliness Scale) in 2019, against 54% in 2018 (Cigna, 2020).
- 58% of US adults were classified as lonely in an insurer's December 2021 online survey (Cigna and Morning Consult, 2022).
Europe and the UK
- 7% of people aged 16+ in England felt lonely often or always in 2025/26, no significant change from 2024/25 (DCMS Community and Engagement Survey, 2026).
- 8.6% of adults in Europe were frequently lonely before the pandemic, according to European Social Survey data for 2006-2014 (d'Hombres et al., IZA discussion paper, 2021).
- More than 40% of people in Hungary and Greece met socially with friends, relatives or colleagues no more than once a month, against around 8% in the Netherlands, Denmark and Sweden (d'Hombres et al., IZA discussion paper, 2021).
- 3% of people in the Netherlands and Denmark were frequently lonely, the lowest in Europe, against about 1 in 10 in Hungary, the Czech Republic, Italy, Poland, Belgium and Greece (d'Hombres et al., IZA discussion paper, 2021).
Figures restated by the Surgeon General and CDC
- About 1 in 2 adults in the US reported experiencing loneliness, the Surgeon General's 2023 advisory states, citing an insurer's online surveys (UCLA scale cut-off 43) and a volunteer web sample (Office of the Surgeon General, 2023).
Numbers we will not publish. "About half of US adults are lonely" is the Surgeon General's restatement of an insurer's online panels scored on a 20-item scale (Cigna) and of a volunteer web sample; the federal surveys above, asked directly, give 5% to 41% depending on how often. "61% of Americans are lonely" and "58%" come from the same insurer's surveys. A range such as "21% to over 50%" without the questions behind it is not a statistic.
Sources: World Health Organization; Gallup (2023, 2024); National Center for Health Statistics and U.S. Census Bureau; U.S. Census Bureau (2022-2026); medRxiv; CDC, Morbidity and Mortality Weekly Report (2024); CDC, National Center for Chronic Disease Prevention and Health Promotion; CDC, PLACES: Local Data for Better Health; JAMA Network Open; Pew Research Center (2018-2026); AARP Research (2018, 2025); Making Caring Common, Harvard Graduate School of Education (2021, 2024); Kaiser Family Foundation and The Economist; PLOS ONE; International Journal of Environmental Research and Public Health; Survey Center on American Life (2021, 2024); Cigna, survey by Ipsos; Cigna, survey by Morning Consult; Department for Culture, Media and Sport and Ministry of Housing, Communities and Local Government; IZA Institute of Labor Economics; Office of the U.S. Surgeon General
02 / Trends
Is there a loneliness epidemic? How loneliness has changed over time
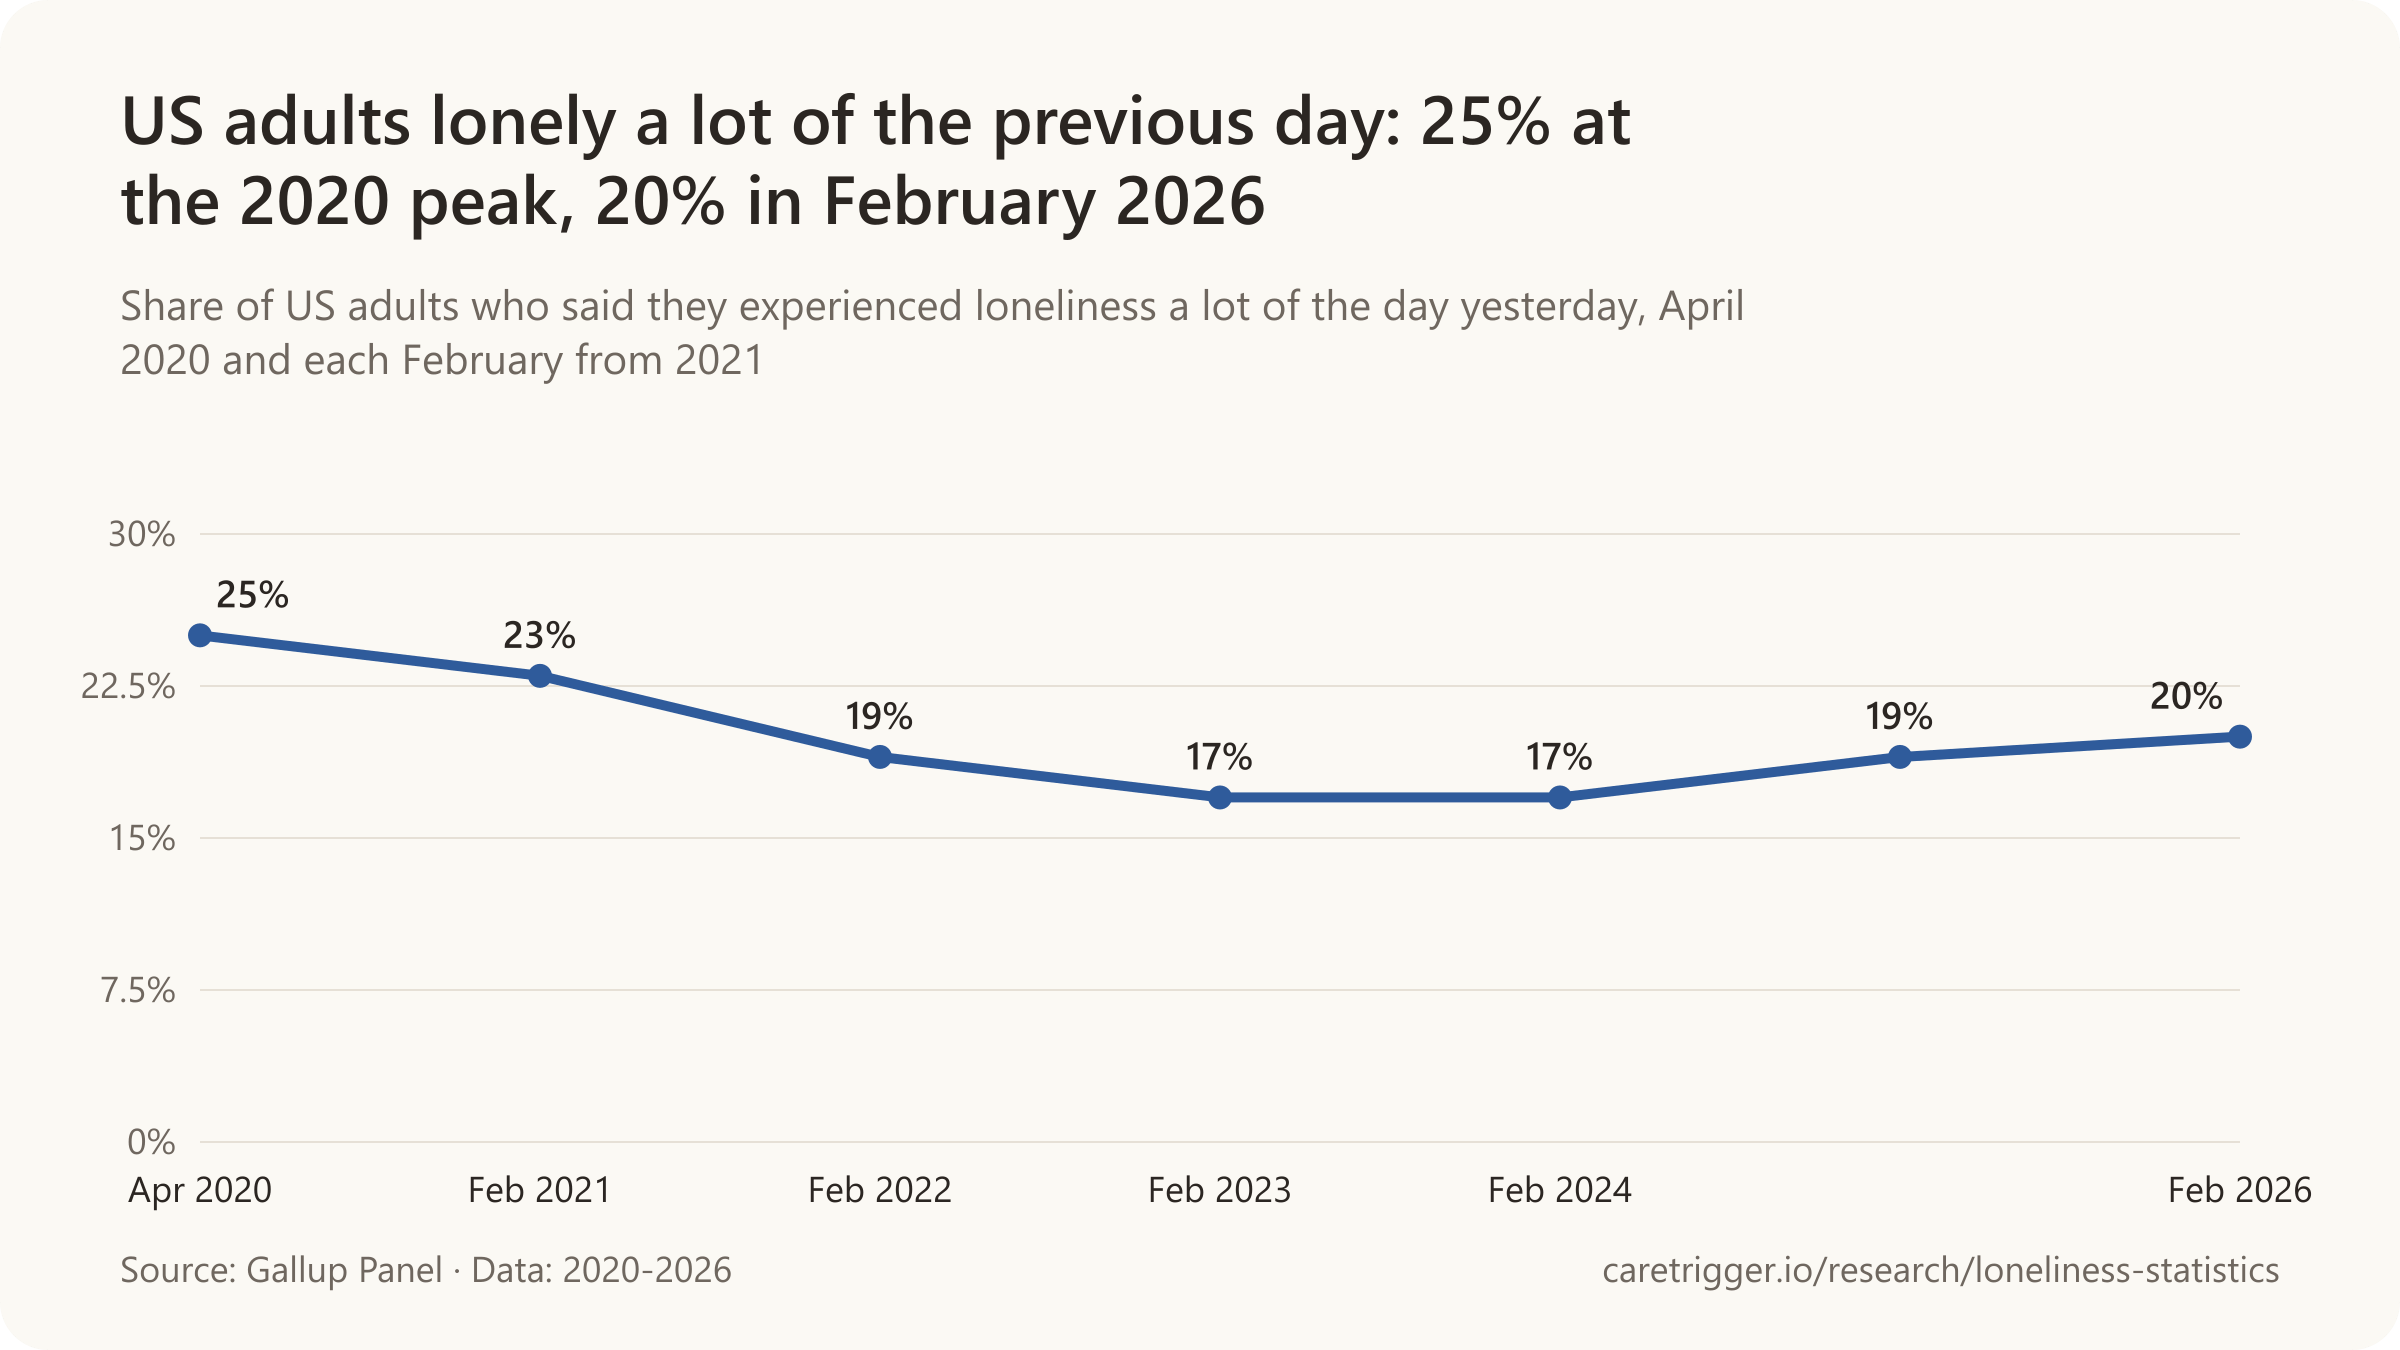
20% of US adults felt lonely a lot of the previous day in February 2026, below the 25% peak of April 2020 (Gallup).

- Feeling isolated jumped to 55.7% of Americans aged 50 to 80 in June 2020, from 26.6% in 2018, then fell back to 29.2% by 2024.
- 10% of US adults felt lonely or isolated all or most of the time in 2018, against 16% in 2024 (Pew Research Center).
- 15.5% of Americans 50 and older felt lonely much of the past week in 2018, down from 20.1% in 1998 (Health and Retirement Study).
- Americans 15 and older spent 333 minutes a day alone in 2020, up from 285 in 2003 (American Time Use Survey).
The surveys show a spike in 2020 that has mostly settled, flat series for later life in England, Japan and the US, rising shares in some polls, and more time spent alone. "Epidemic" is the searchers' and the Surgeon General's word; the data show a common, lasting condition rather than a sudden outbreak.
Sources: Gallup; JAMA; Pew Research Center; Cabinet Office of Japan; Journals of Gerontology: Series B; SSM - Population Health
More statistics (81)
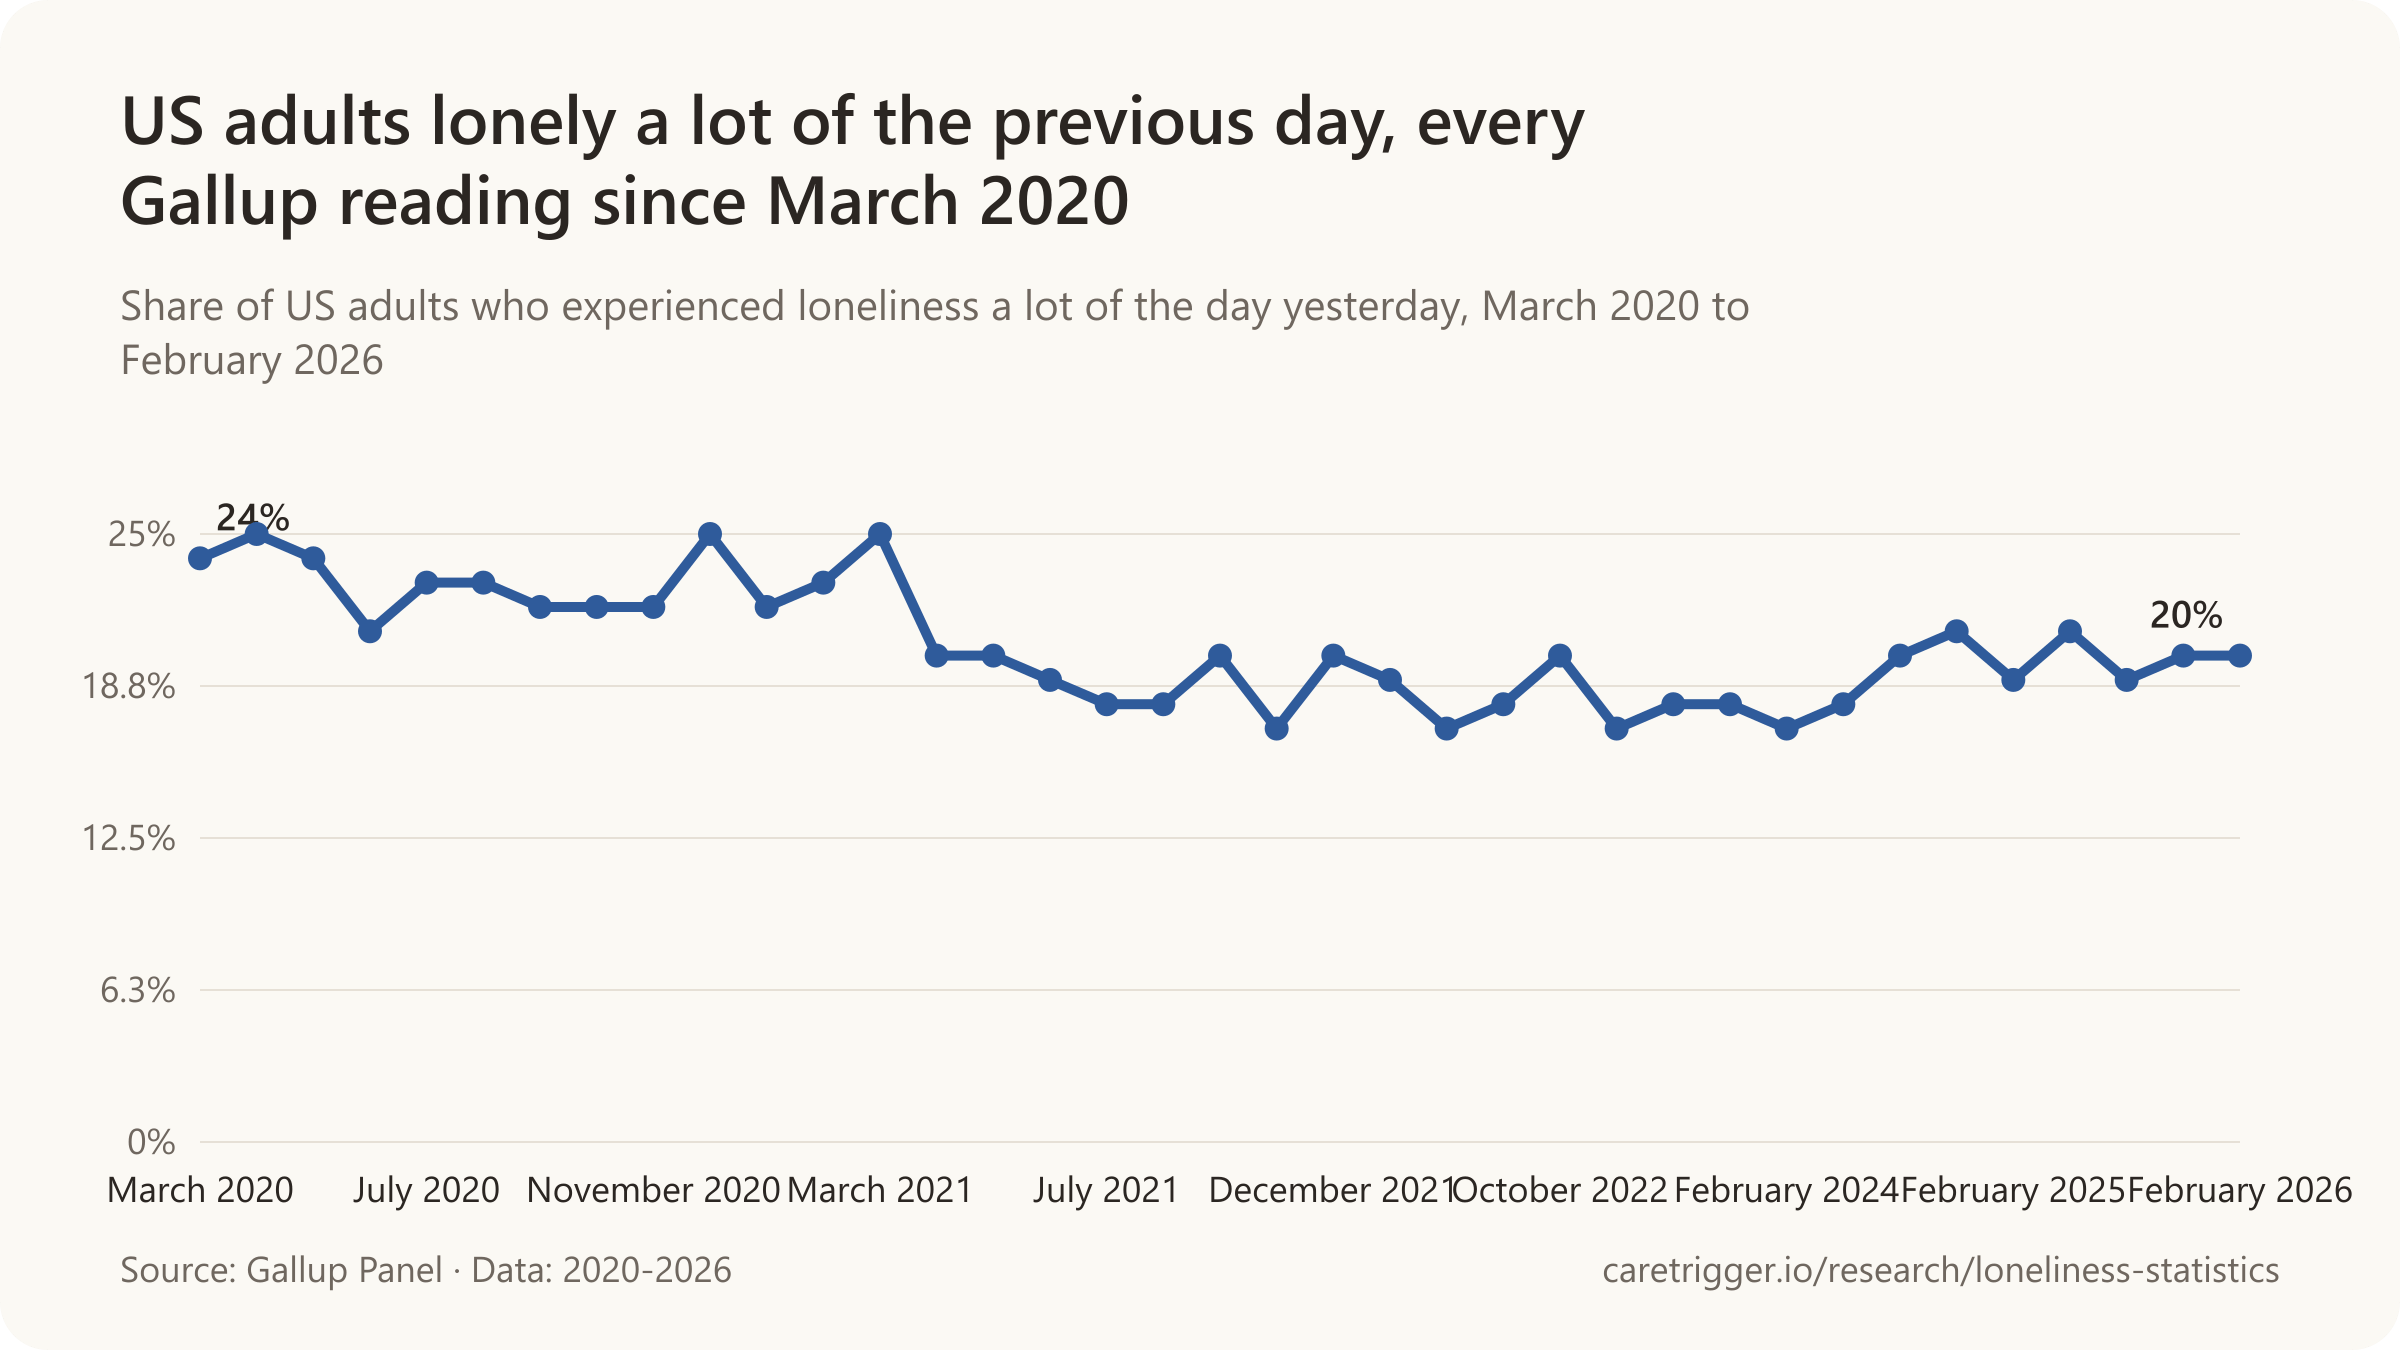
20% of US adults said they experienced loneliness a lot of the day yesterday in February 2026 (Gallup Panel, Gallup, 2026).
A series is only a trend if the question stayed the same. The charts below each follow one survey with one question; figures from different surveys are not joined.

- 52 million adults in the US, an estimated 20% of the adult population, felt loneliness a lot of the day yesterday in late summer 2024 (Gallup Panel, Gallup, 2024).
- 17% of US adults, an estimated 44 million people, felt loneliness a lot of the day yesterday in February 2023 (Gallup Panel, Gallup, 2023).
- 20% of US adults living in big cities felt loneliness a lot of the day yesterday in February 2023, against 12% in rural areas (Gallup Panel, Gallup, 2023).
- 20% of adults in New England felt loneliness a lot of the day yesterday in February 2023, the highest of 9 US census divisions, against 14% in the Mountain states (Gallup Panel, Gallup, 2023).
- 21% of US adults felt loneliness a lot of the day yesterday in May-June 2025, the highest reading since March 2021 (Gallup Panel, Gallup, 2025).
United States
- 10% of US adults said they feel lonely or isolated from those around them all or most of the time in 2018, against 16% in 2024 (Pew Research Center, 2018).
- 15.5% of Americans aged 50 and over felt lonely much of the past week in 2018, down from 20.1% in 1998, in the Health and Retirement Study (Surkalim et al., Journals of Gerontology: Series B, 2023).
- 333 minutes a day were spent alone by the average American aged 15 and older in 2020 (American Time Use Survey analysis, Kannan & Veazie, SSM Population Health, 2023).
- 33% of US adults aged 45 and older said they feel lonely or isolated always or sometimes in 2025, against 33% in 2010 and 31% in 2018 (AARP Research, 2025).
- 36% of US adults aged 45 and older attended religious services monthly or more often in 2025, down from 44% in 2010, while volunteering fell from 44% to 34% (AARP Research, 2025).
- 35% of US adults aged 45 and older were lonely on the UCLA Loneliness Scale in 2018, unchanged from 2010 (AARP Research, 2018).
- 31% of US adults aged 45 and older said they feel lonely or isolated always or sometimes in 2018 (AARP Research, 2018).
- 35% of US adults aged 45 and older were lonely on the UCLA Loneliness Scale in 2010, AARP's first loneliness survey (Wilson & Moulton, AARP, 2010).
- 5.8% of US adults said they always or usually feel lonely in March 13-30, 2026, our calculation from Census Bureau tables (Household Trends and Outlook Pulse Survey, Census Bureau, 2026).
- 9.0% of US adults said they always or usually feel lonely in July 15-August 3, 2026, our calculation from Census Bureau tables (Household Trends and Outlook Pulse Survey, Census Bureau, 2026).
- 9.6% of widowed, divorced or separated US adults said they always or usually feel lonely in September 9-October 12, 2026, our calculation from Census Bureau tables (Household Trends and Outlook Pulse Survey, Census Bureau, 2026).
- 13.0% of never-married US adults said they always or usually feel lonely in September 9-October 12, 2026, our calculation from Census Bureau tables (Household Trends and Outlook Pulse Survey, Census Bureau, 2026).
- 2.9% of married US adults said they always or usually feel lonely in September 9-October 12, 2026, our calculation from Census Bureau tables (Household Trends and Outlook Pulse Survey, Census Bureau, 2026).
- 11.0% of US adults living alone said they always or usually feel lonely in September 9-October 12, 2026, our calculation from Census Bureau tables (Household Trends and Outlook Pulse Survey, Census Bureau, 2026).
- 5.3% of US adults in two-person households said they always or usually feel lonely in September 9-October 12, 2026, our calculation from Census Bureau tables (Household Trends and Outlook Pulse Survey, Census Bureau, 2026).
- 19.3% of US adults who identify as gay, lesbian, bisexual or another non-straight term said they always or usually feel lonely in September 9-October 12, 2026, our calculation from Census Bureau tables (Household Trends and Outlook Pulse Survey, Census Bureau, 2026).
- 14.3% of US adults with household incomes under $35,000 said they always or usually feel lonely in September 9-October 12, 2026, our calculation from Census Bureau tables (Household Trends and Outlook Pulse Survey, Census Bureau, 2026).
- 1.7% of US adults with household incomes of $150,000 or more said they always or usually feel lonely in September 9-October 12, 2026, our calculation from Census Bureau tables (Household Trends and Outlook Pulse Survey, Census Bureau, 2026).
- 1.46 million adults aged 65 and older in the US said they always or usually feel lonely in September-October 2026 (Household Trends and Outlook Pulse Survey, Census Bureau, 2026).
- 25% of US adults in an online convenience sample recalled feeling seriously lonely in the two months before the pandemic, against 36% in October 2020 (Making Caring Common, Harvard, 2021).
- 285 minutes a day were spent alone by the average American aged 15 and older in 2003 (American Time Use Survey analysis, Kannan & Veazie, SSM Population Health, 2023).
- 309 minutes a day were spent alone by the average American aged 15 and older in 2019 (American Time Use Survey analysis, Kannan & Veazie, SSM Population Health, 2023).
- 12% of US adults said they have no close friends in May 2021, against 3% in a 1990 Gallup poll (Survey Center on American Life, 2021).
- 2.08 confidants on average were named by US adults in the 2004 General Social Survey, down from 2.94 in 1985 (McPherson, Smith-Lovin & Brashears, American Sociological Review, 2006).
- 17% of US adults said they have no close friends in 2024, up from 12% in 2021 (Survey Center on American Life, 2024).
- 3% of US adults said they had no close friends in a 1990 Gallup telephone poll (Gallup 1990, reported by the Survey Center on American Life, 2021).
The UK and Ireland




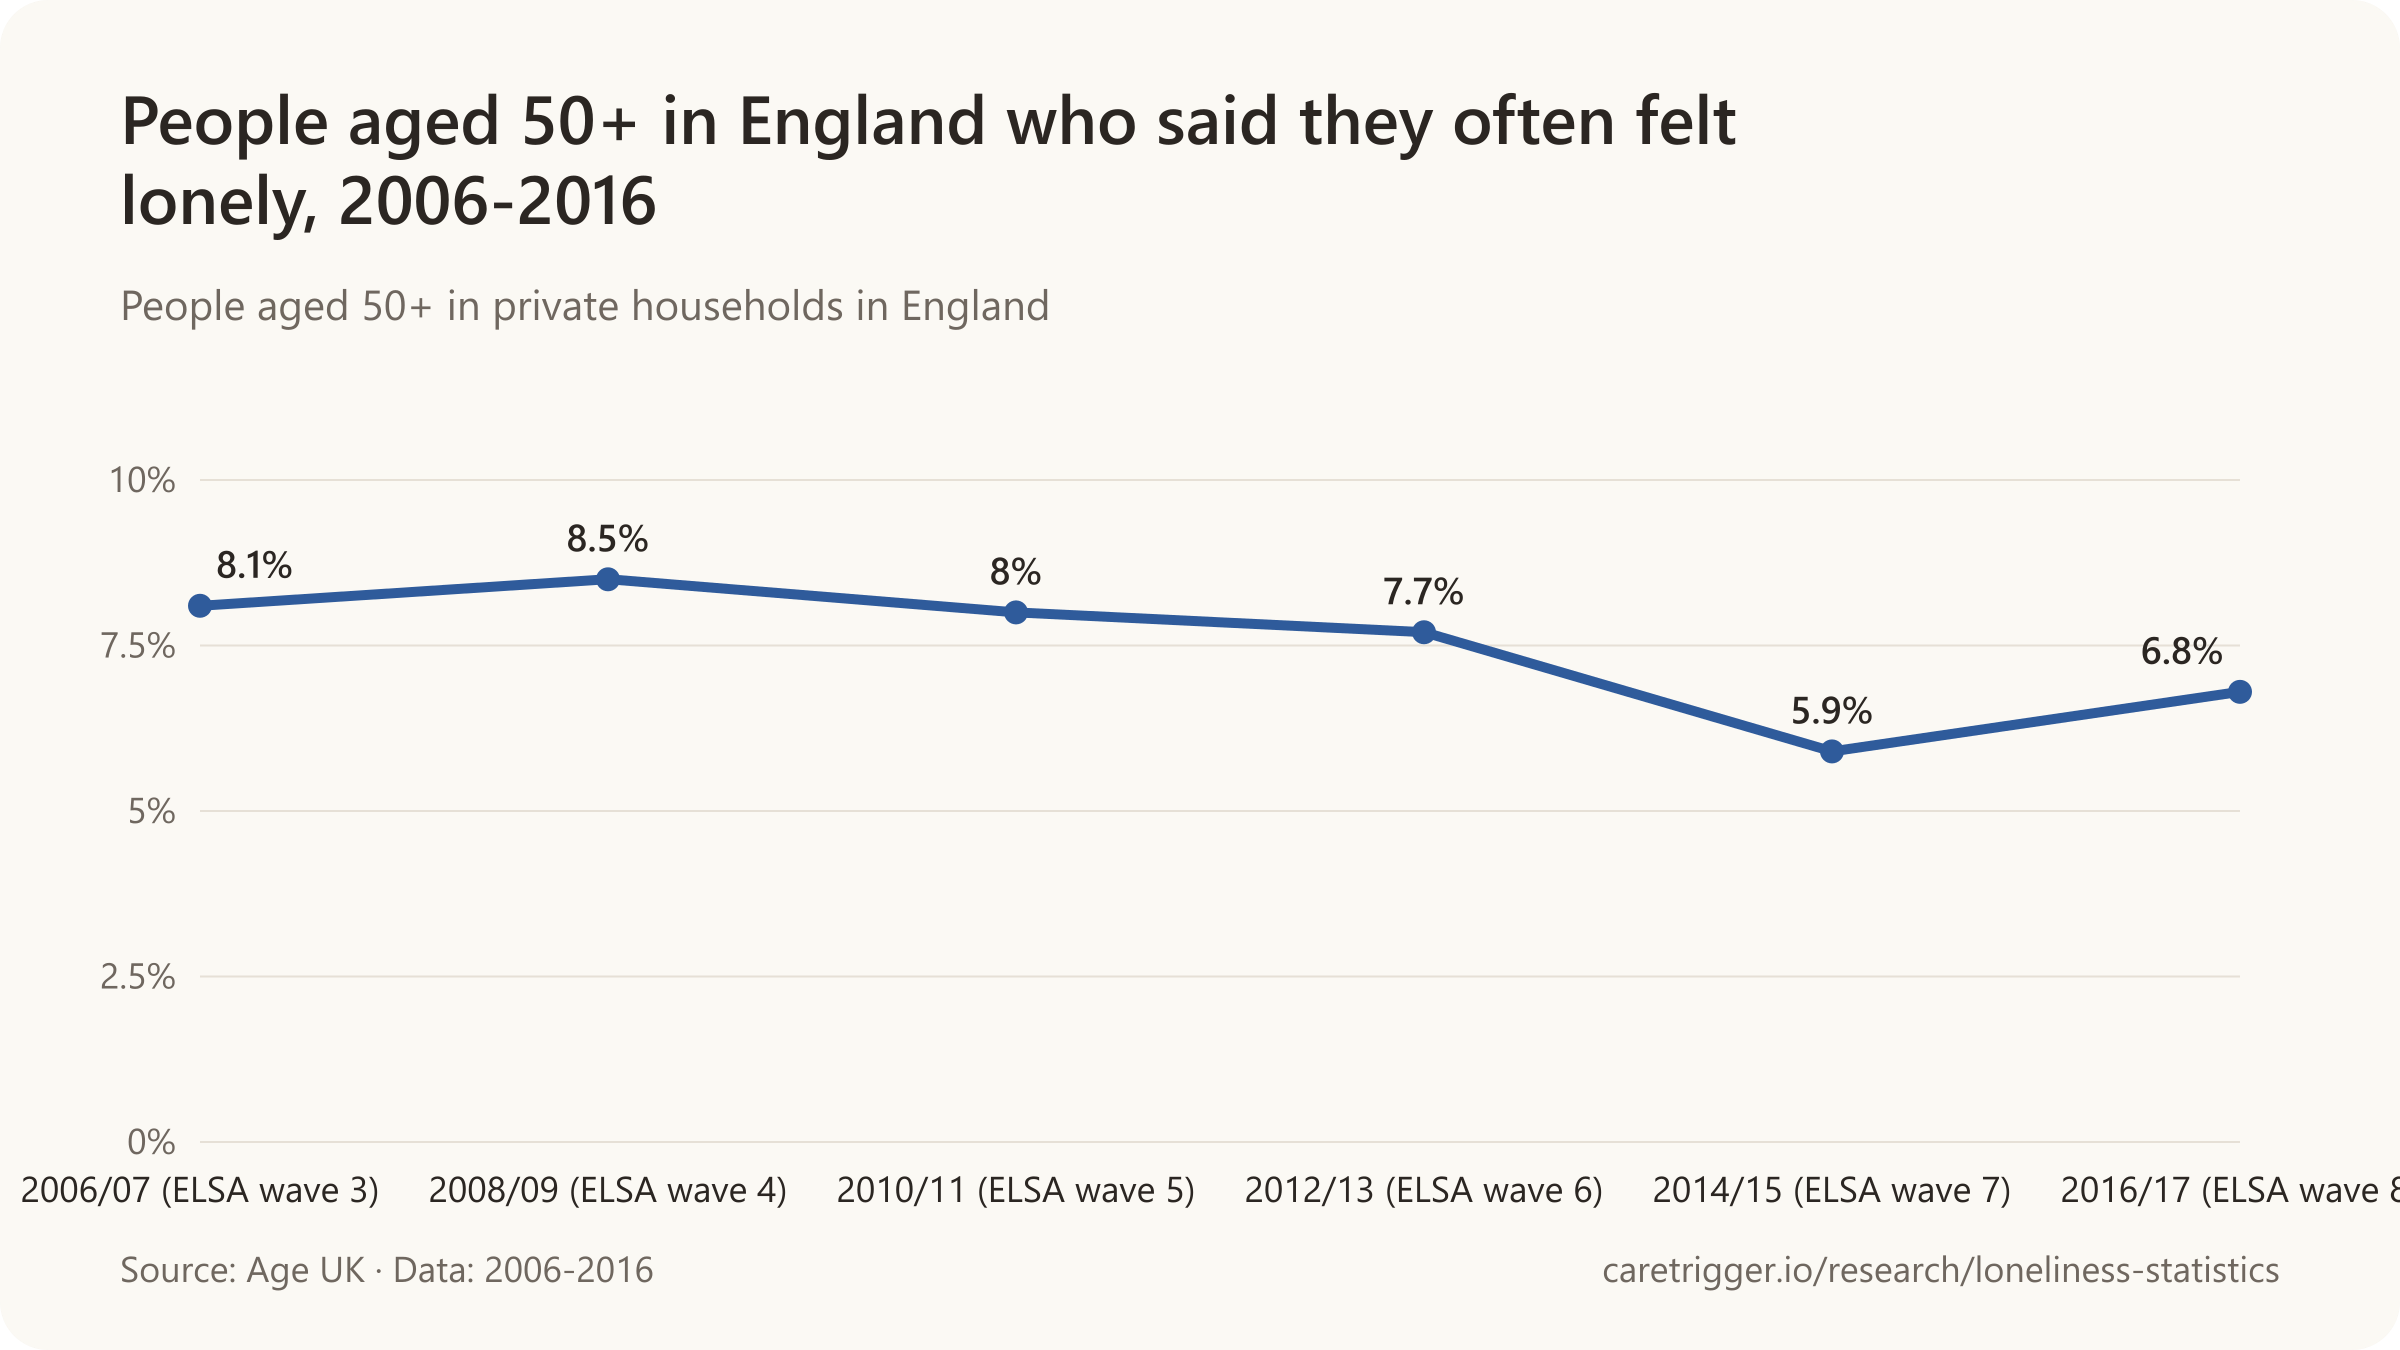

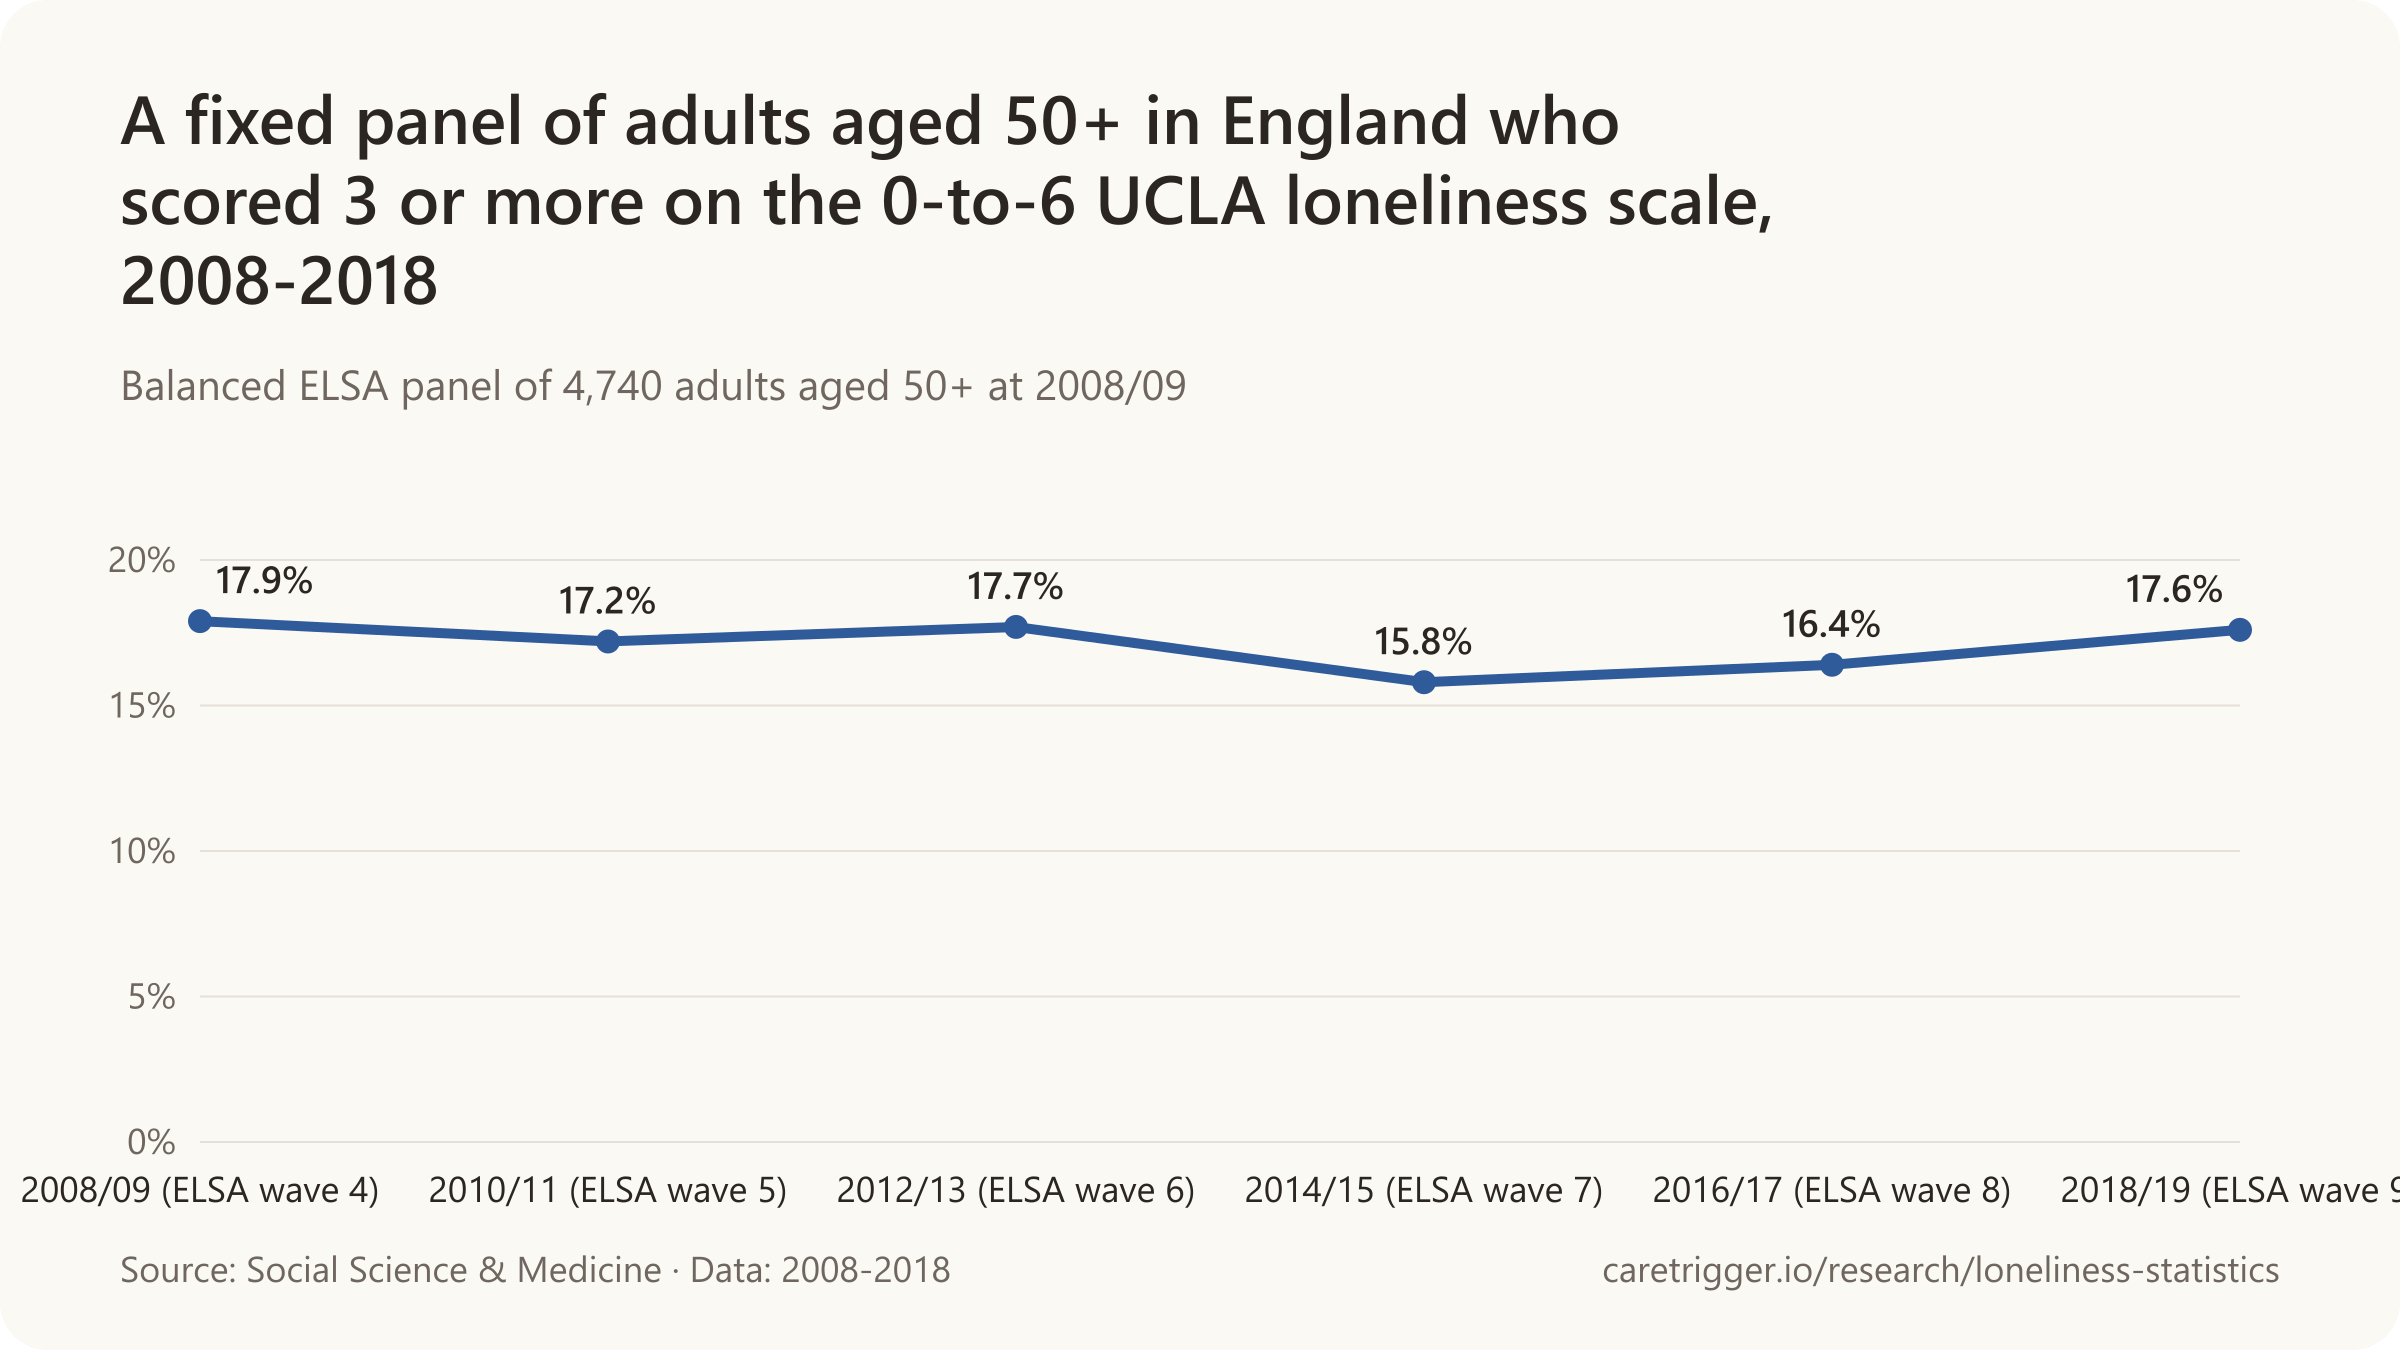
- Around 1.4 million people aged 50+ in England, one in twelve (about 7.5% on the 2006/07-2016/17 average), are often lonely, and Age UK projected the number would reach 2 million by 2025/26 if nothing changed (Age UK, All the Lonely People, 2018).
- 9% of people aged 16+ in England scored 8 or 9 on the 3-to-9 indirect loneliness scale in 2025/26, built from how often they lack companionship, feel left out and feel isolated (DCMS Community and Engagement Survey, 2026).
- 4.9% to 5.6% of adults aged 16+ in England felt lonely often or always each year from 2013/14 to 2017/18, below the 6.6% of 2024/25 (DCMS Community Life Survey, 2025).
- 6% of people aged 75 and over in England felt lonely often or always in 2023/24 (DCMS Community Life Survey data tables, 2025).
- 5% of people aged 75 and over in England felt lonely often or always in 2024/25 (DCMS Community Life Survey, 2025).
- 3% of people aged 75 and over in England felt lonely often or always in 2017/18 (DCMS Community Life Survey: Focus on Loneliness, 2019).
- 11.3% of children aged 10 to 15 in Great Britain said they often felt lonely in 2018, more among 10-to-12-year-olds (14.0%) than 13-to-15-year-olds (8.6%) (ONS analysis of the Good Childhood Index Survey, 2018).
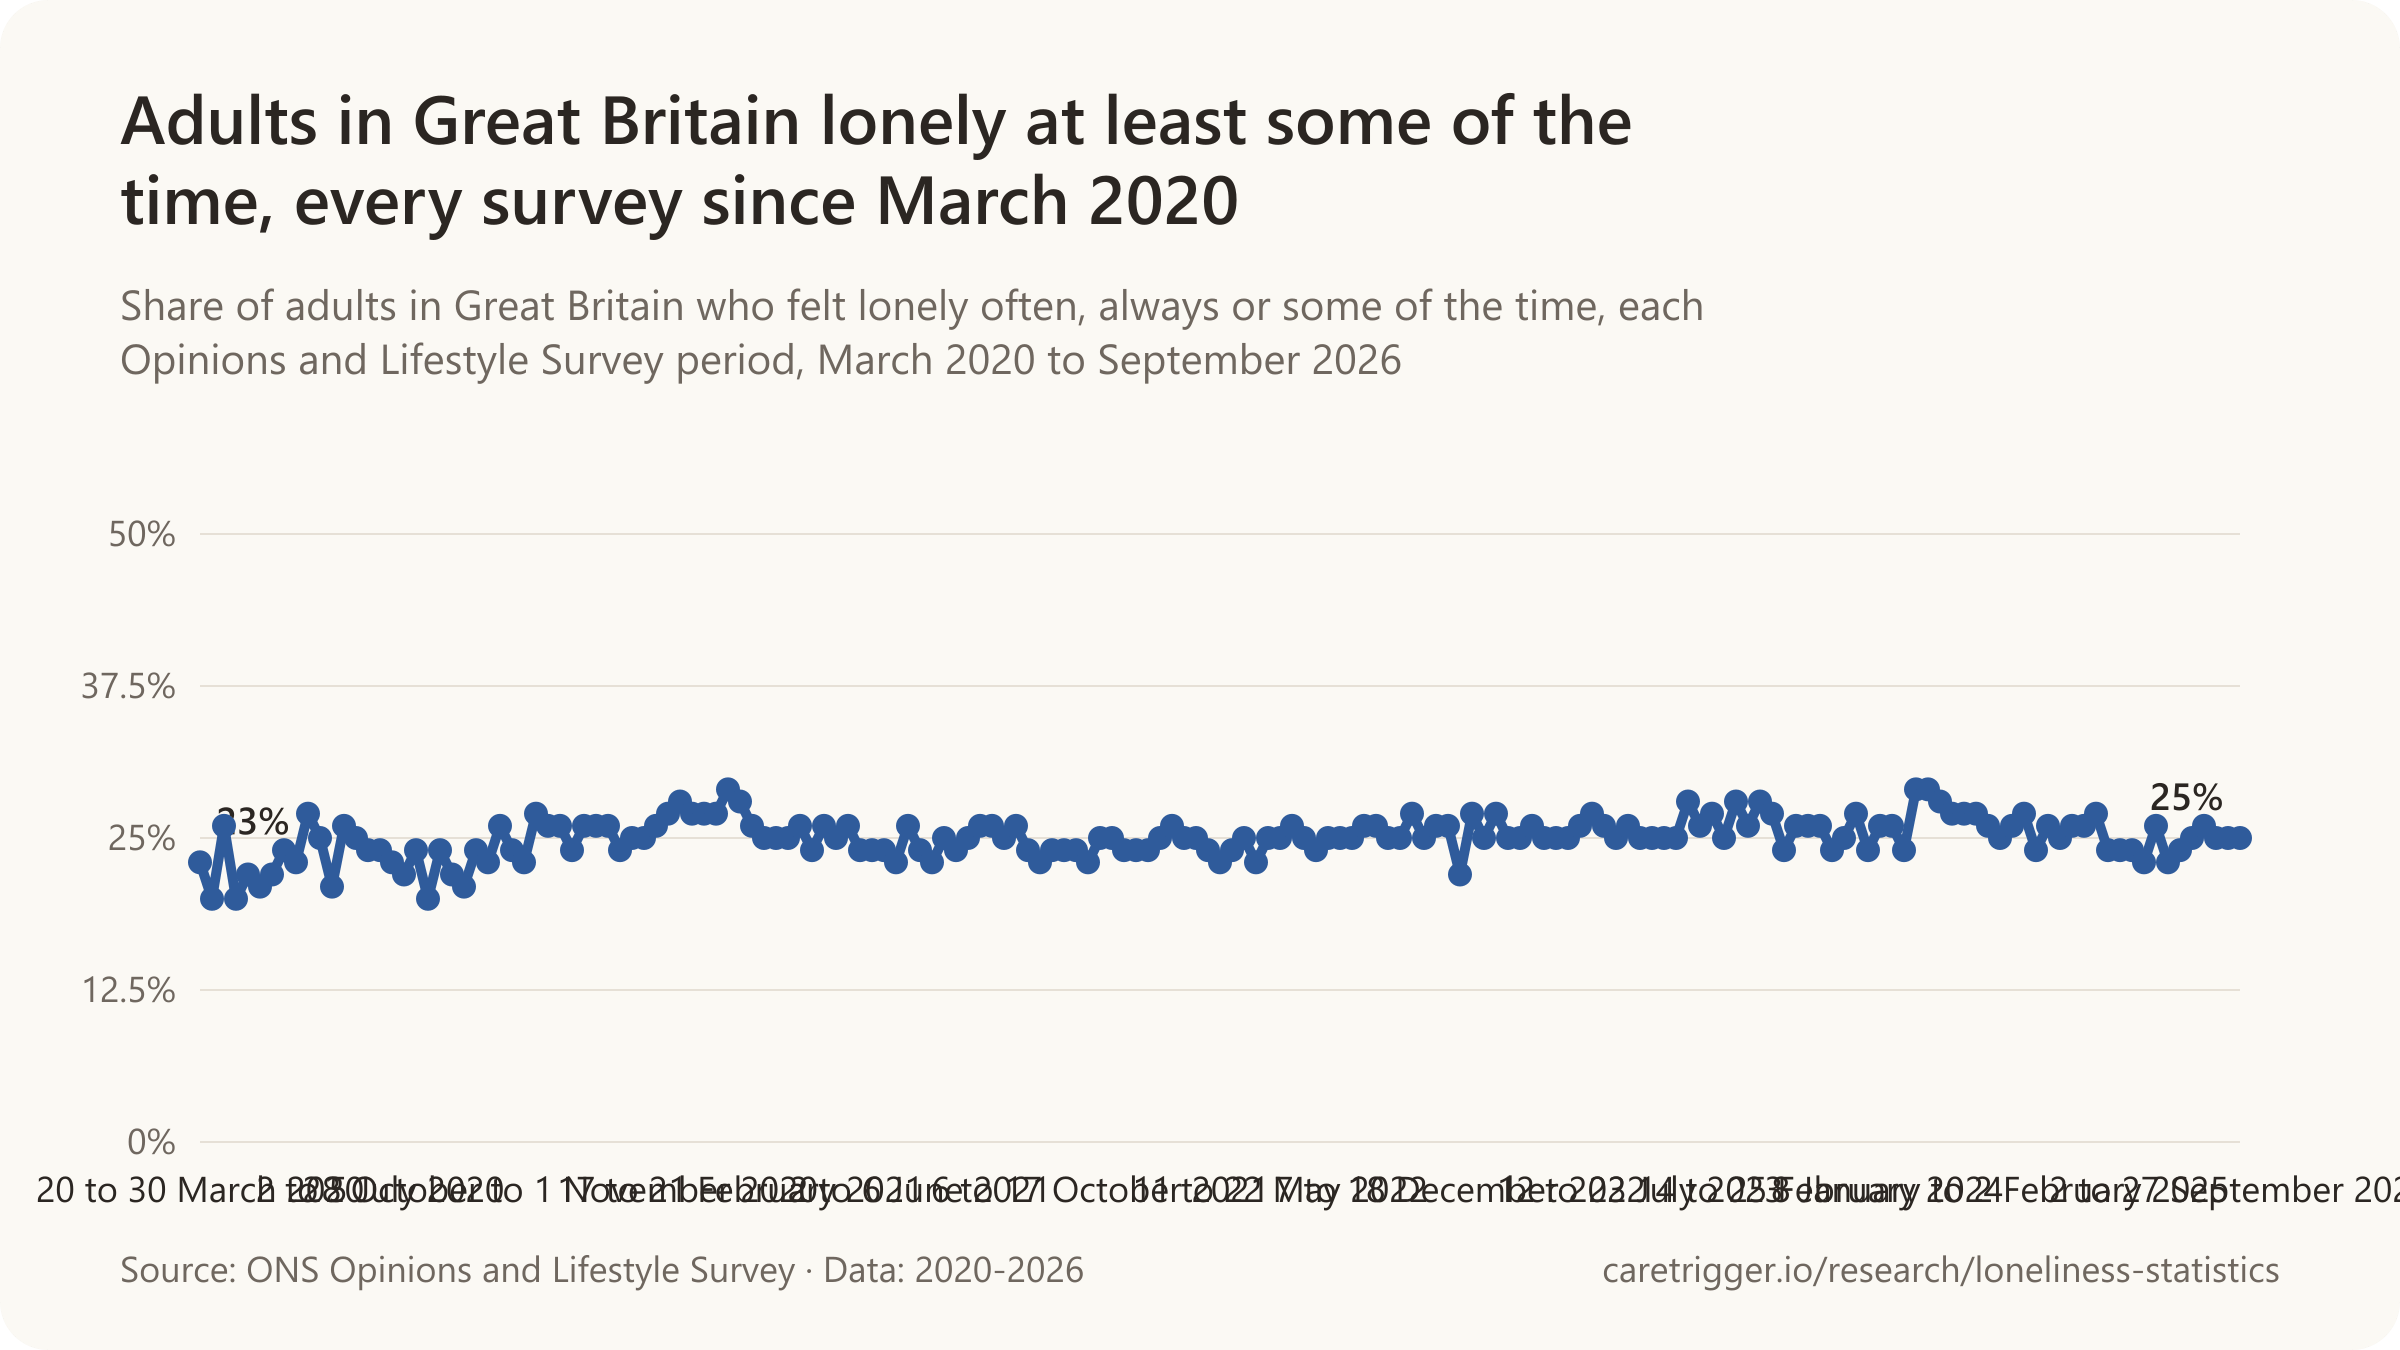
- 38.6% of adults in Great Britain whose well-being was affected by the pandemic, about 10.5 million people, said it was because they felt lonely, from October 2020 to February 2021 (ONS Opinions and Lifestyle Survey, 2021).
- Almost 10 times the odds of 'lockdown loneliness' were found for adults in Great Britain who had no one to talk to, compared with those who did, from October 2020 to February 2021 (ONS Opinions and Lifestyle Survey, 2021).
- 3 to 9 is the range of the three-item UCLA loneliness score used in UK surveys, with each item scored 1 to 3 and no standard cut-off at which a person counts as lonely (ONS measuring loneliness guidance, 2018).
- 12.7% of adults aged 50+ in England became lonely during the COVID-19 pandemic (2016 to December 2020), one of four loneliness trajectories in the English Longitudinal Study of Ageing (Joshi et al., Sociology of Health & Illness, 2025).
- 6.8% of adults aged 50+ in England were lonely both before and during the pandemic (2016 to December 2020), one of four loneliness trajectories in the English Longitudinal Study of Ageing (Joshi et al., Sociology of Health & Illness, 2025).
- 6.9% of adults aged 50+ in England moved out of loneliness during the pandemic (2016 to December 2020), one of four loneliness trajectories in the English Longitudinal Study of Ageing (Joshi et al., Sociology of Health & Illness, 2025).
- 73.5% of adults aged 50+ in England were not lonely before or during the pandemic (2016 to December 2020), one of four loneliness trajectories in the English Longitudinal Study of Ageing (Joshi et al., Sociology of Health & Illness, 2025).
- The mean loneliness score of adults aged 50+ in England rose only slightly during the pandemic, from 5.50 to 5.75 by November-December 2020, while depressive symptoms rose from 12.5% to 28.5% (Zaninotto et al., JAMA Psychiatry, 2022).
- 7% of people aged 65+ living in their own homes in Great Britain were severely lonely in 2001, little changed from studies over the previous five decades (Victor et al., Ageing & Society, 2005).
- 35% of adults in Scotland felt lonely at least some of the time in the past week in 2020, a pandemic-year telephone survey that is not comparable with other years (Scottish Government, Recovering our Connections, 2023).
- 5% of adults aged 70+ in Ireland often felt lonely and 24.0% some of the time before the pandemic, while 71% hardly ever or never did (TILDA and ALONE, 2020).
- 66% of adults aged 50+ in Ireland said they had rarely or never felt lonely in the previous week during the 2020 COVID-19 survey wave, against roughly 80% before and after the pandemic (TILDA, Trinity College Dublin, 2025).
- 24.5% of adults aged 50+ in Ireland followed a path of consistently higher loneliness over 14 years of follow-up, against 42.2% with low but rising loneliness and 33.3% with low loneliness that spiked in the pandemic (TILDA, Trinity College Dublin, 2025).
Germany, the Netherlands, Switzerland and the Nordics

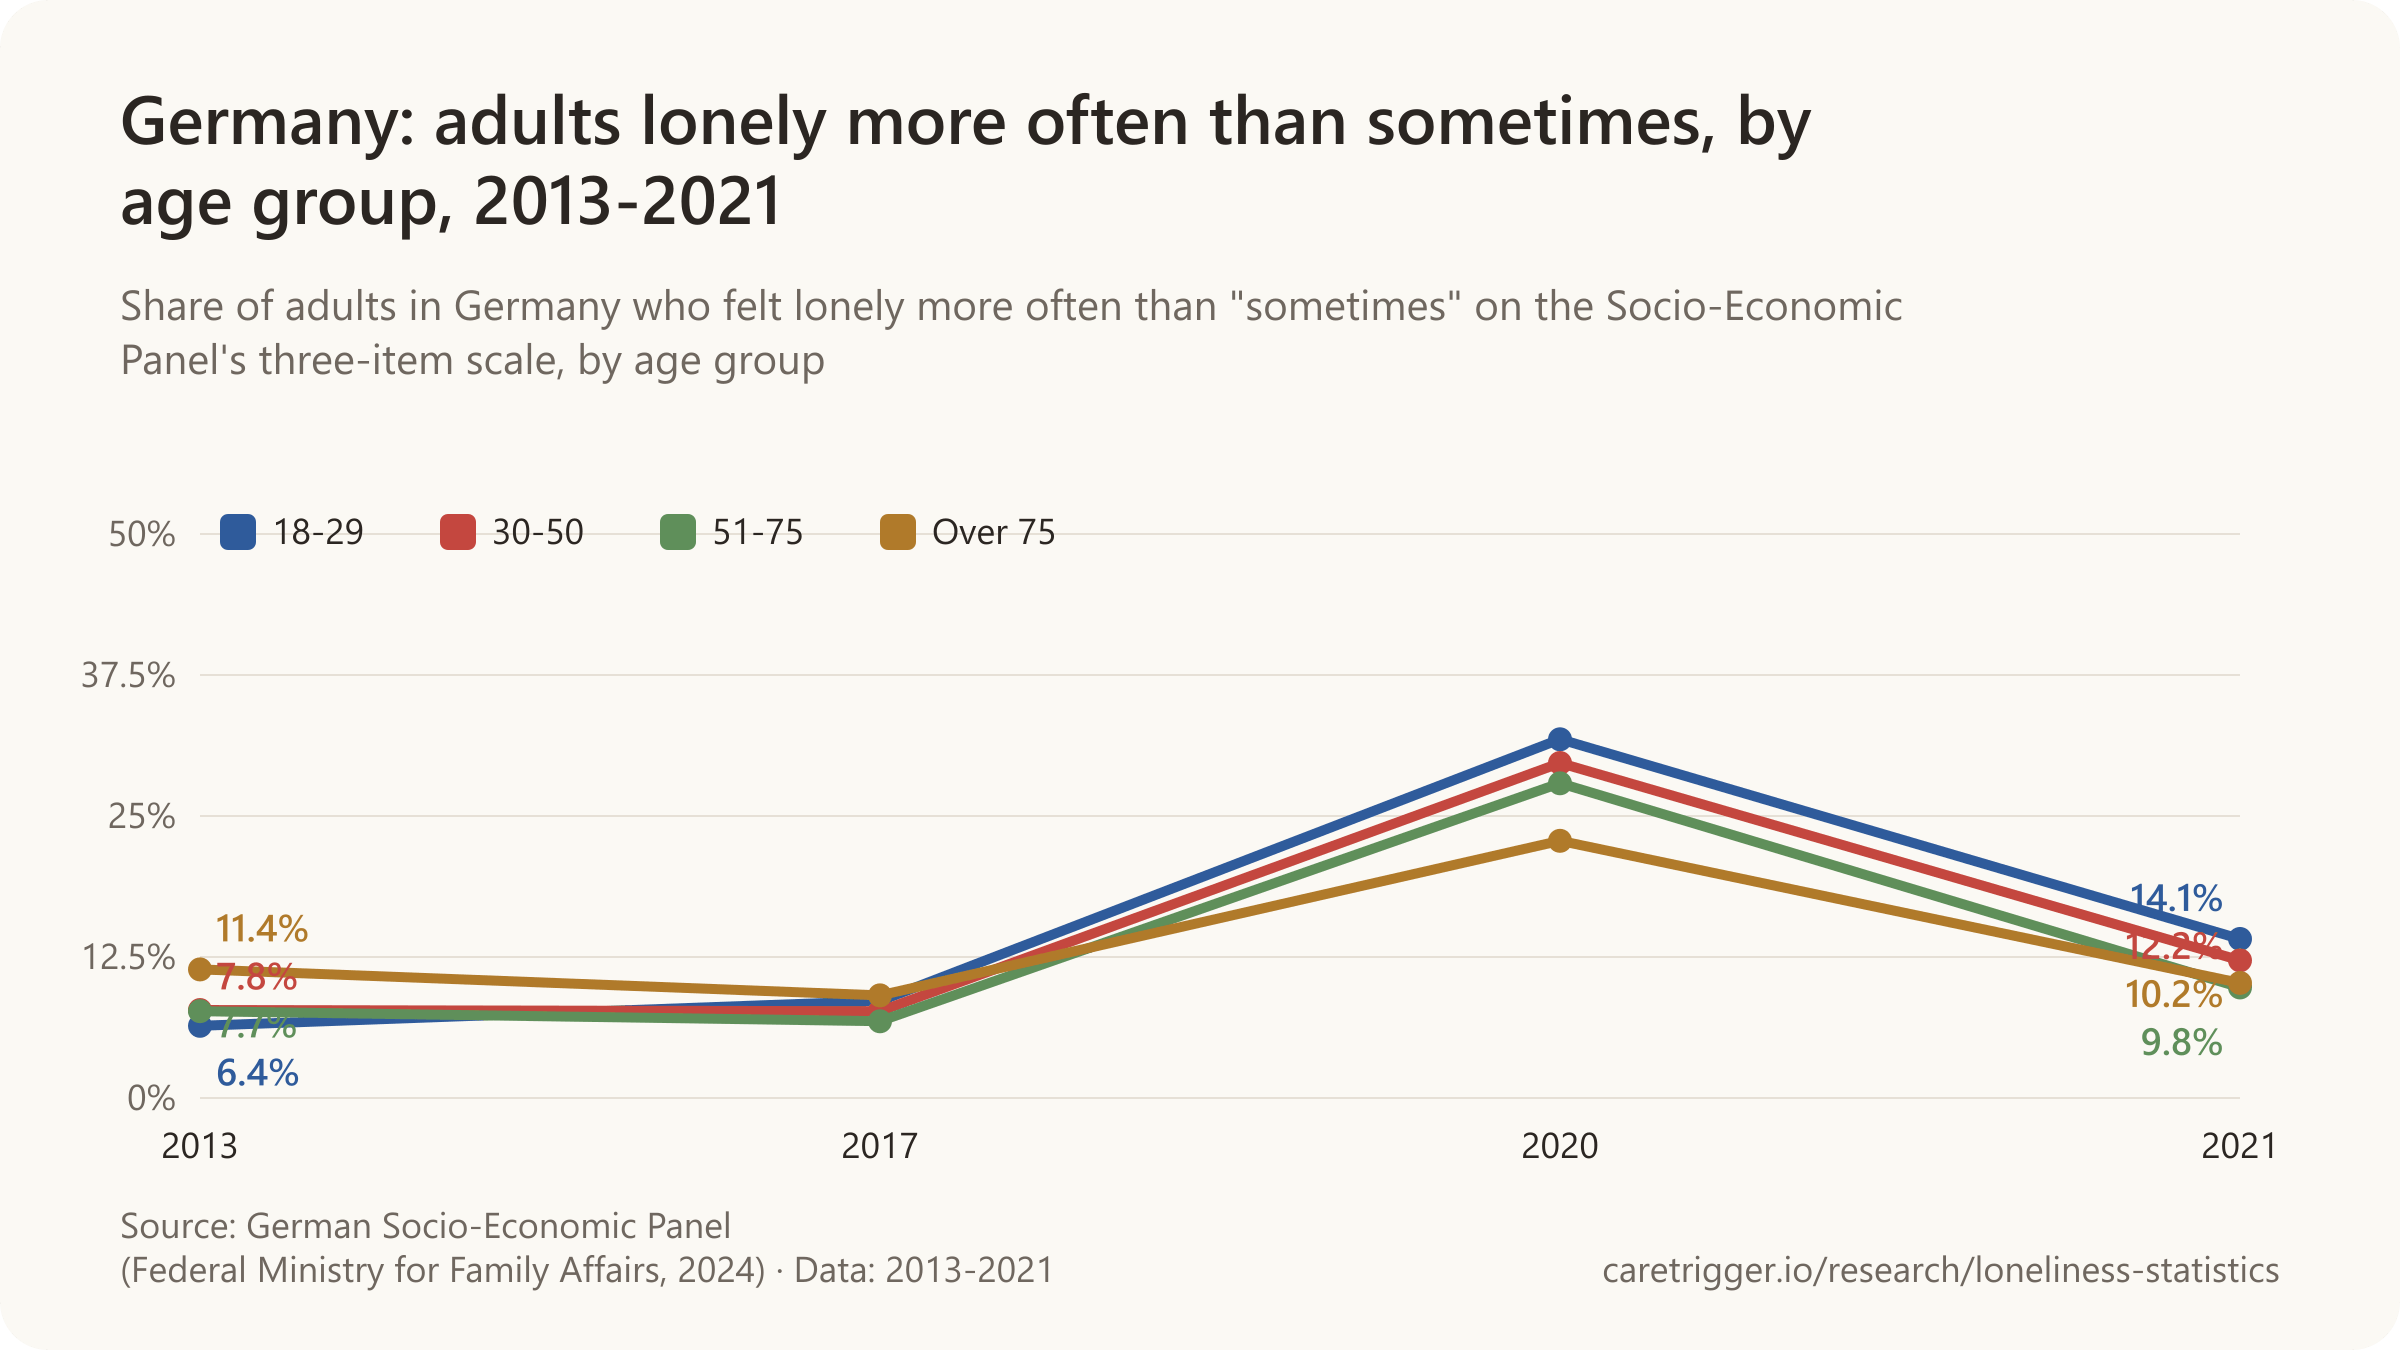

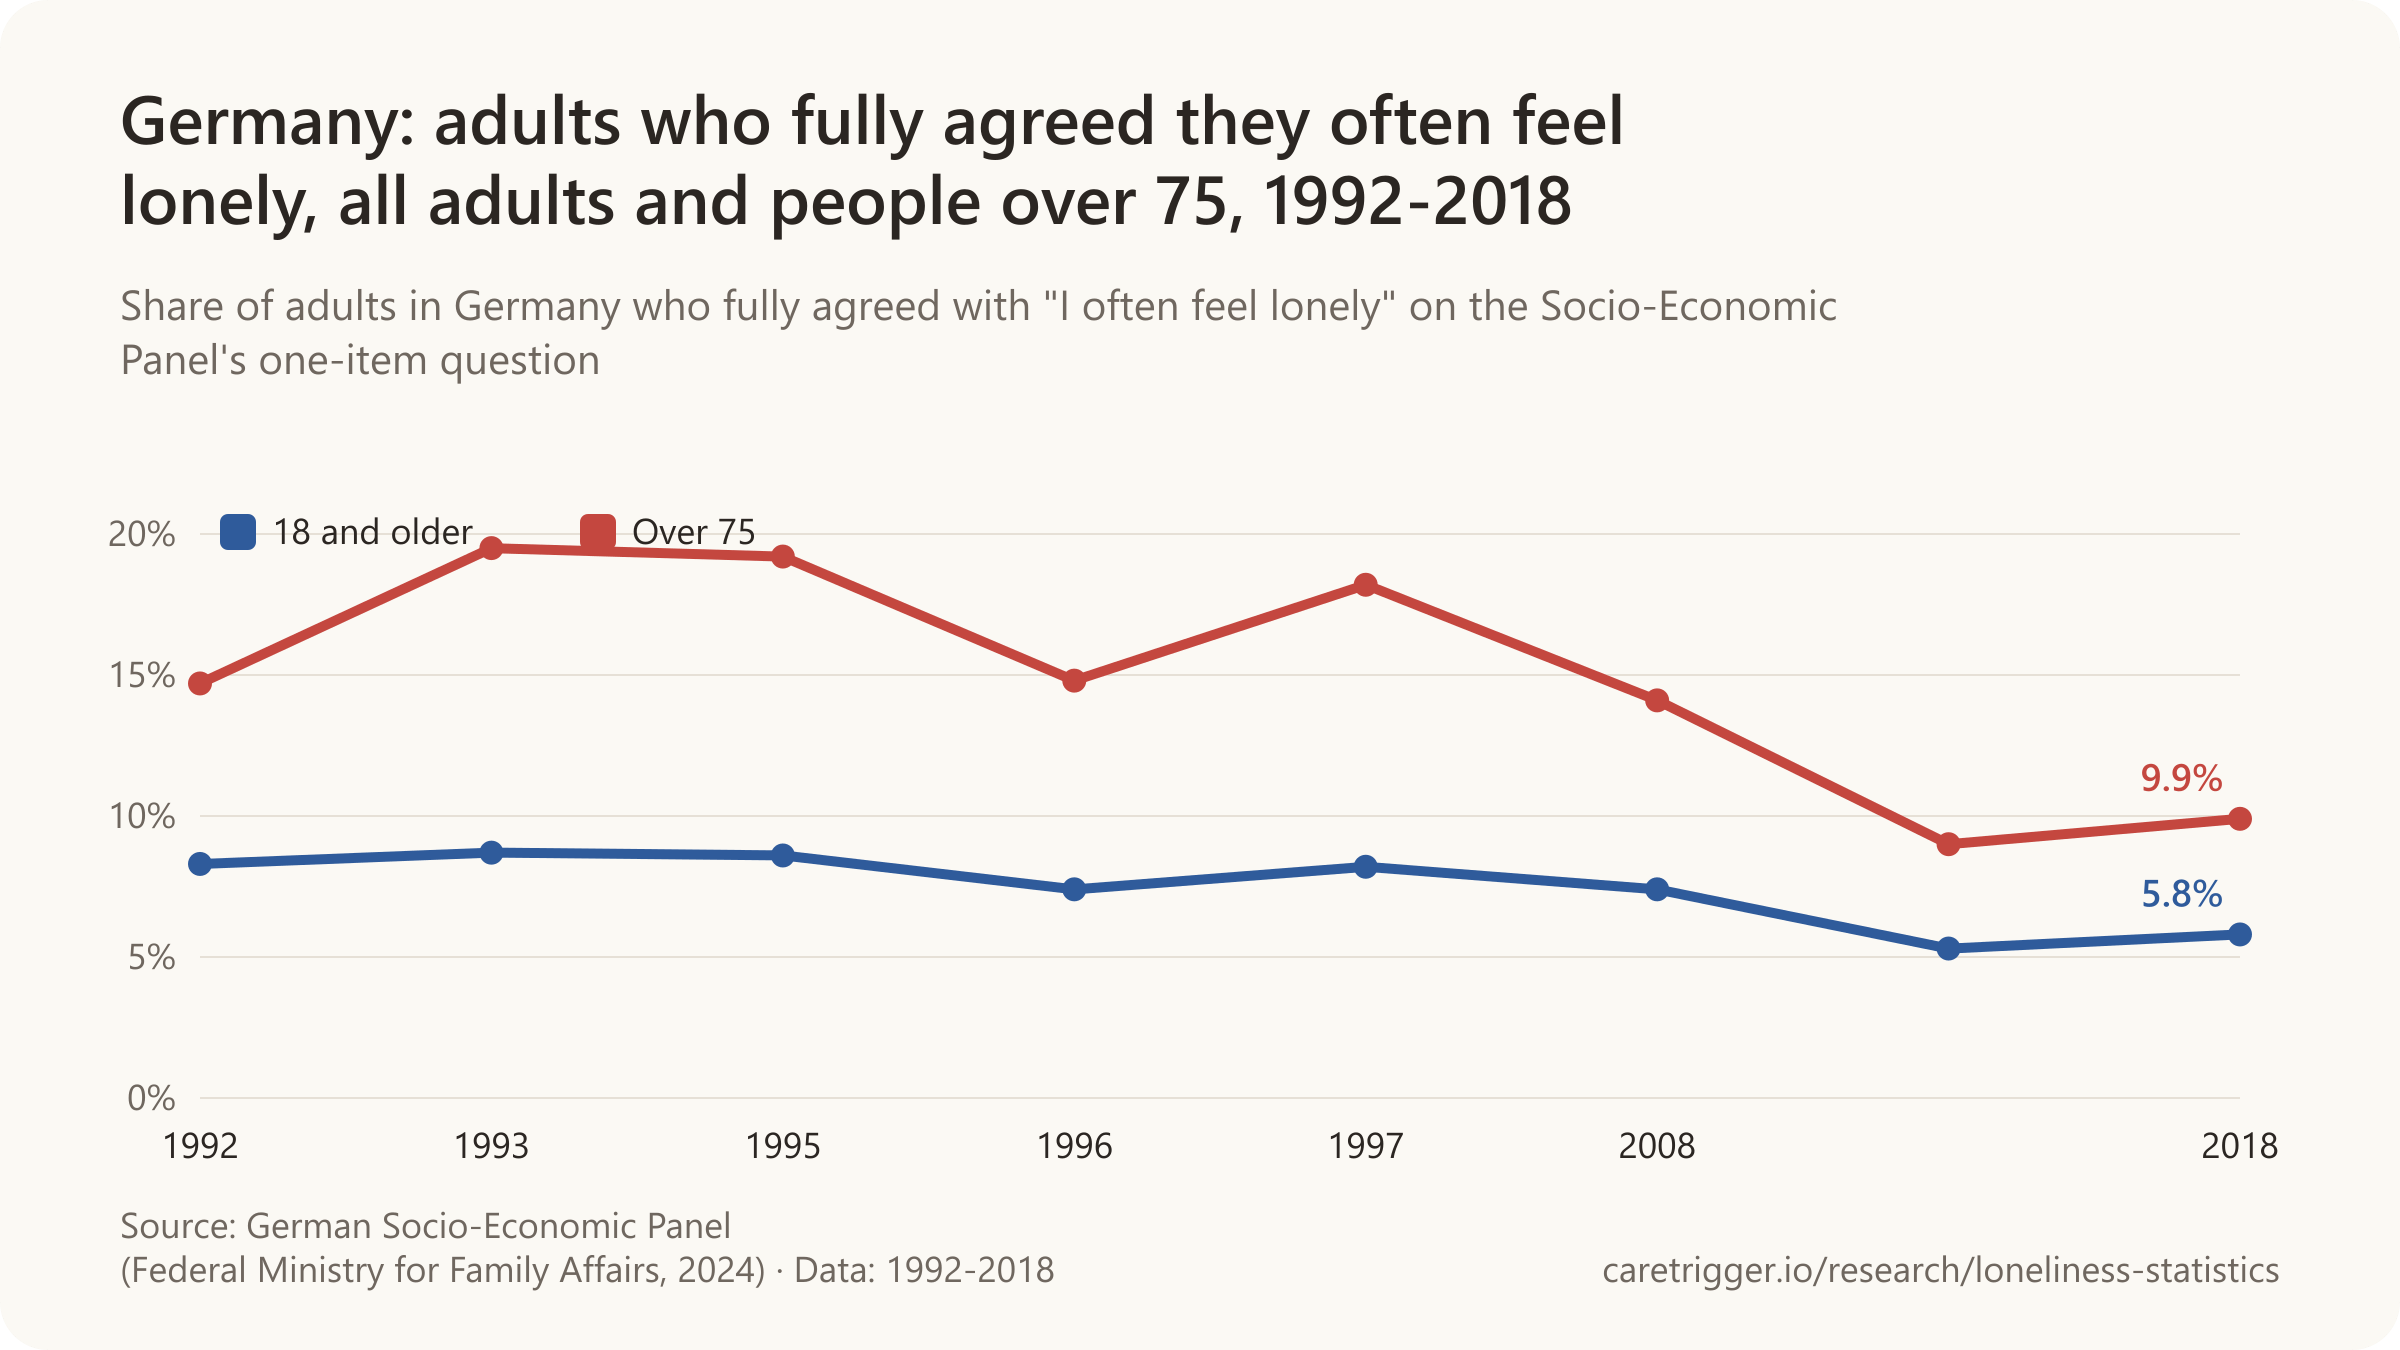


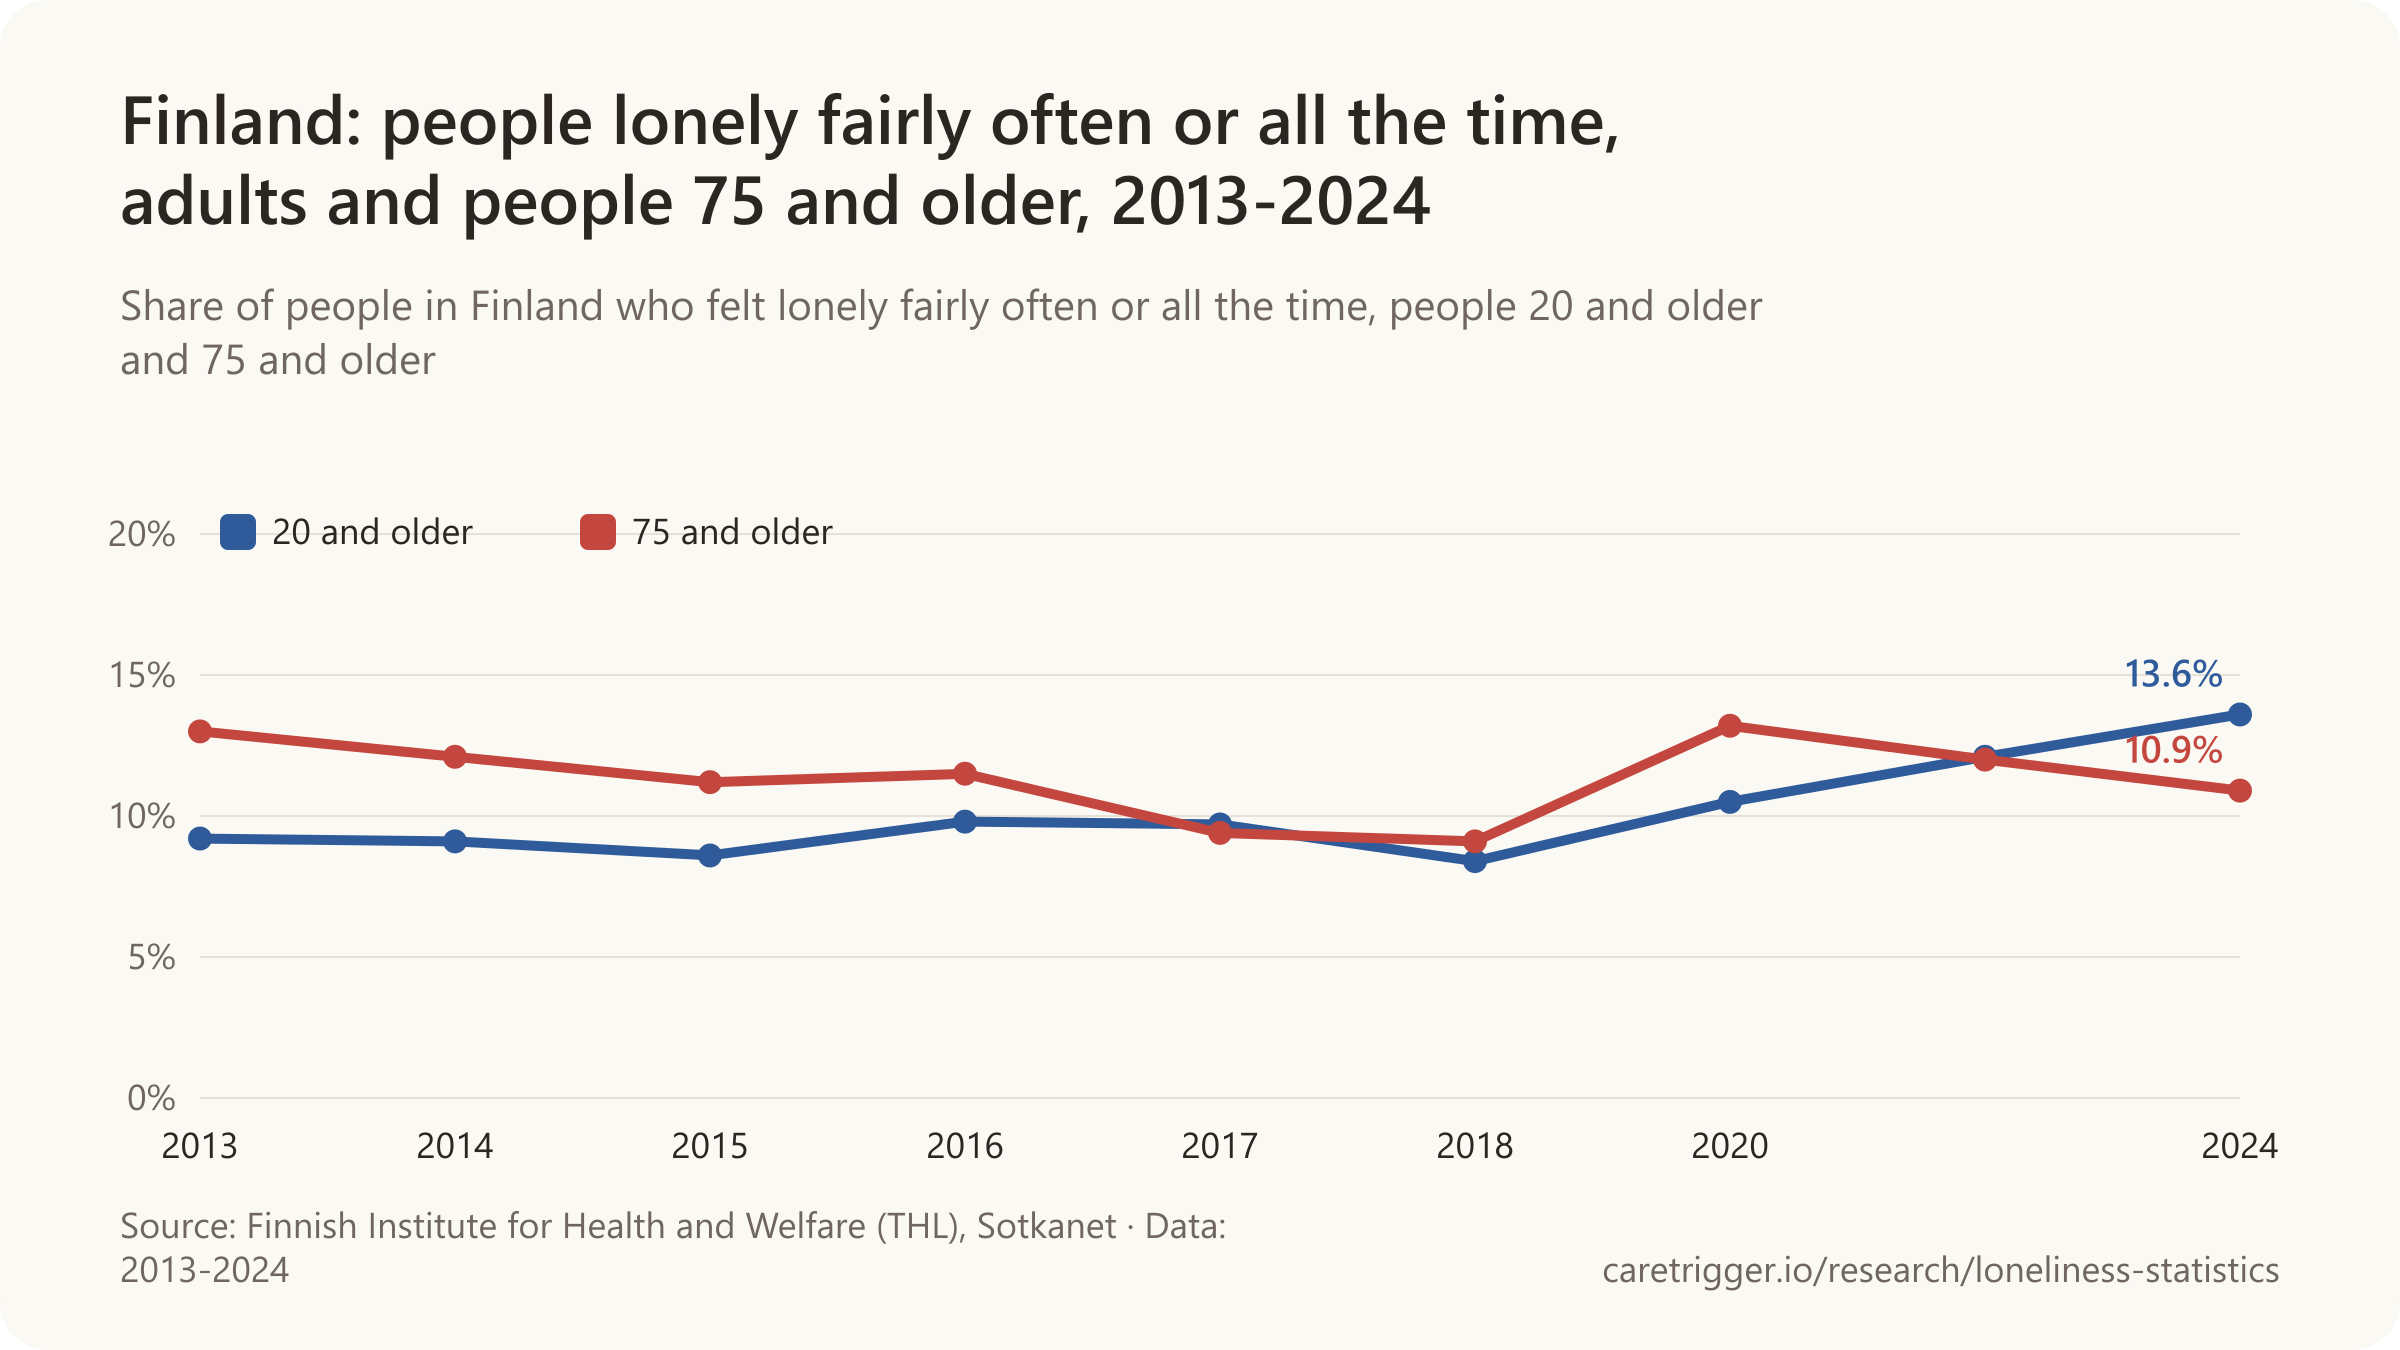
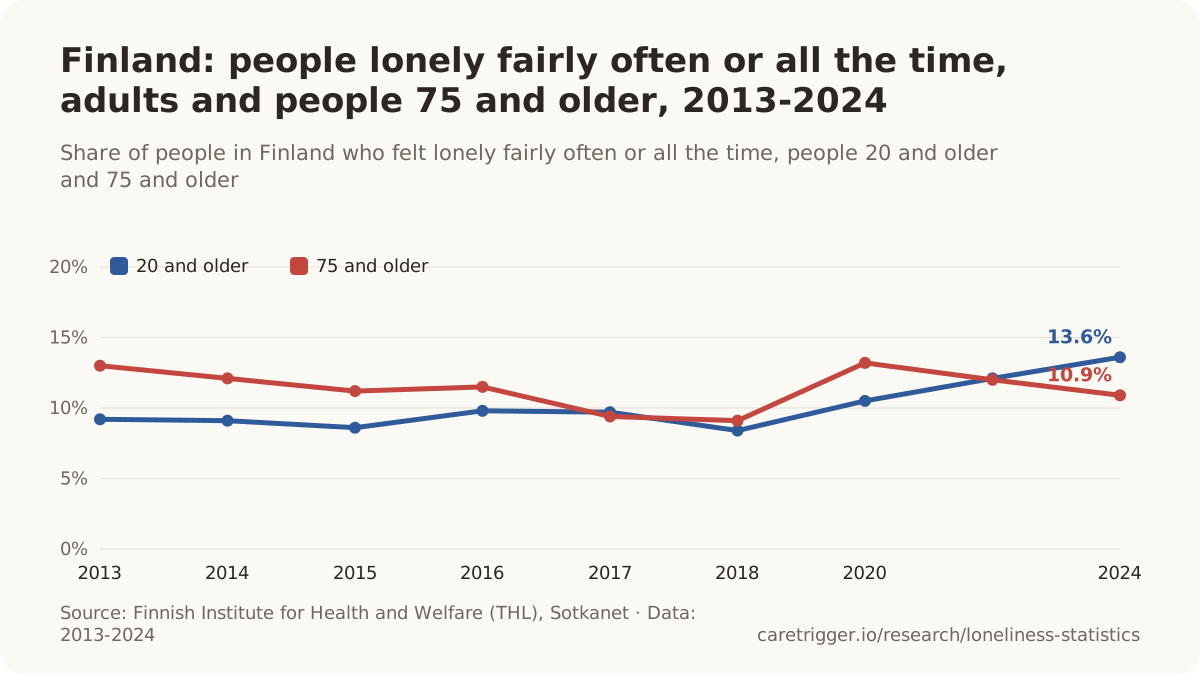

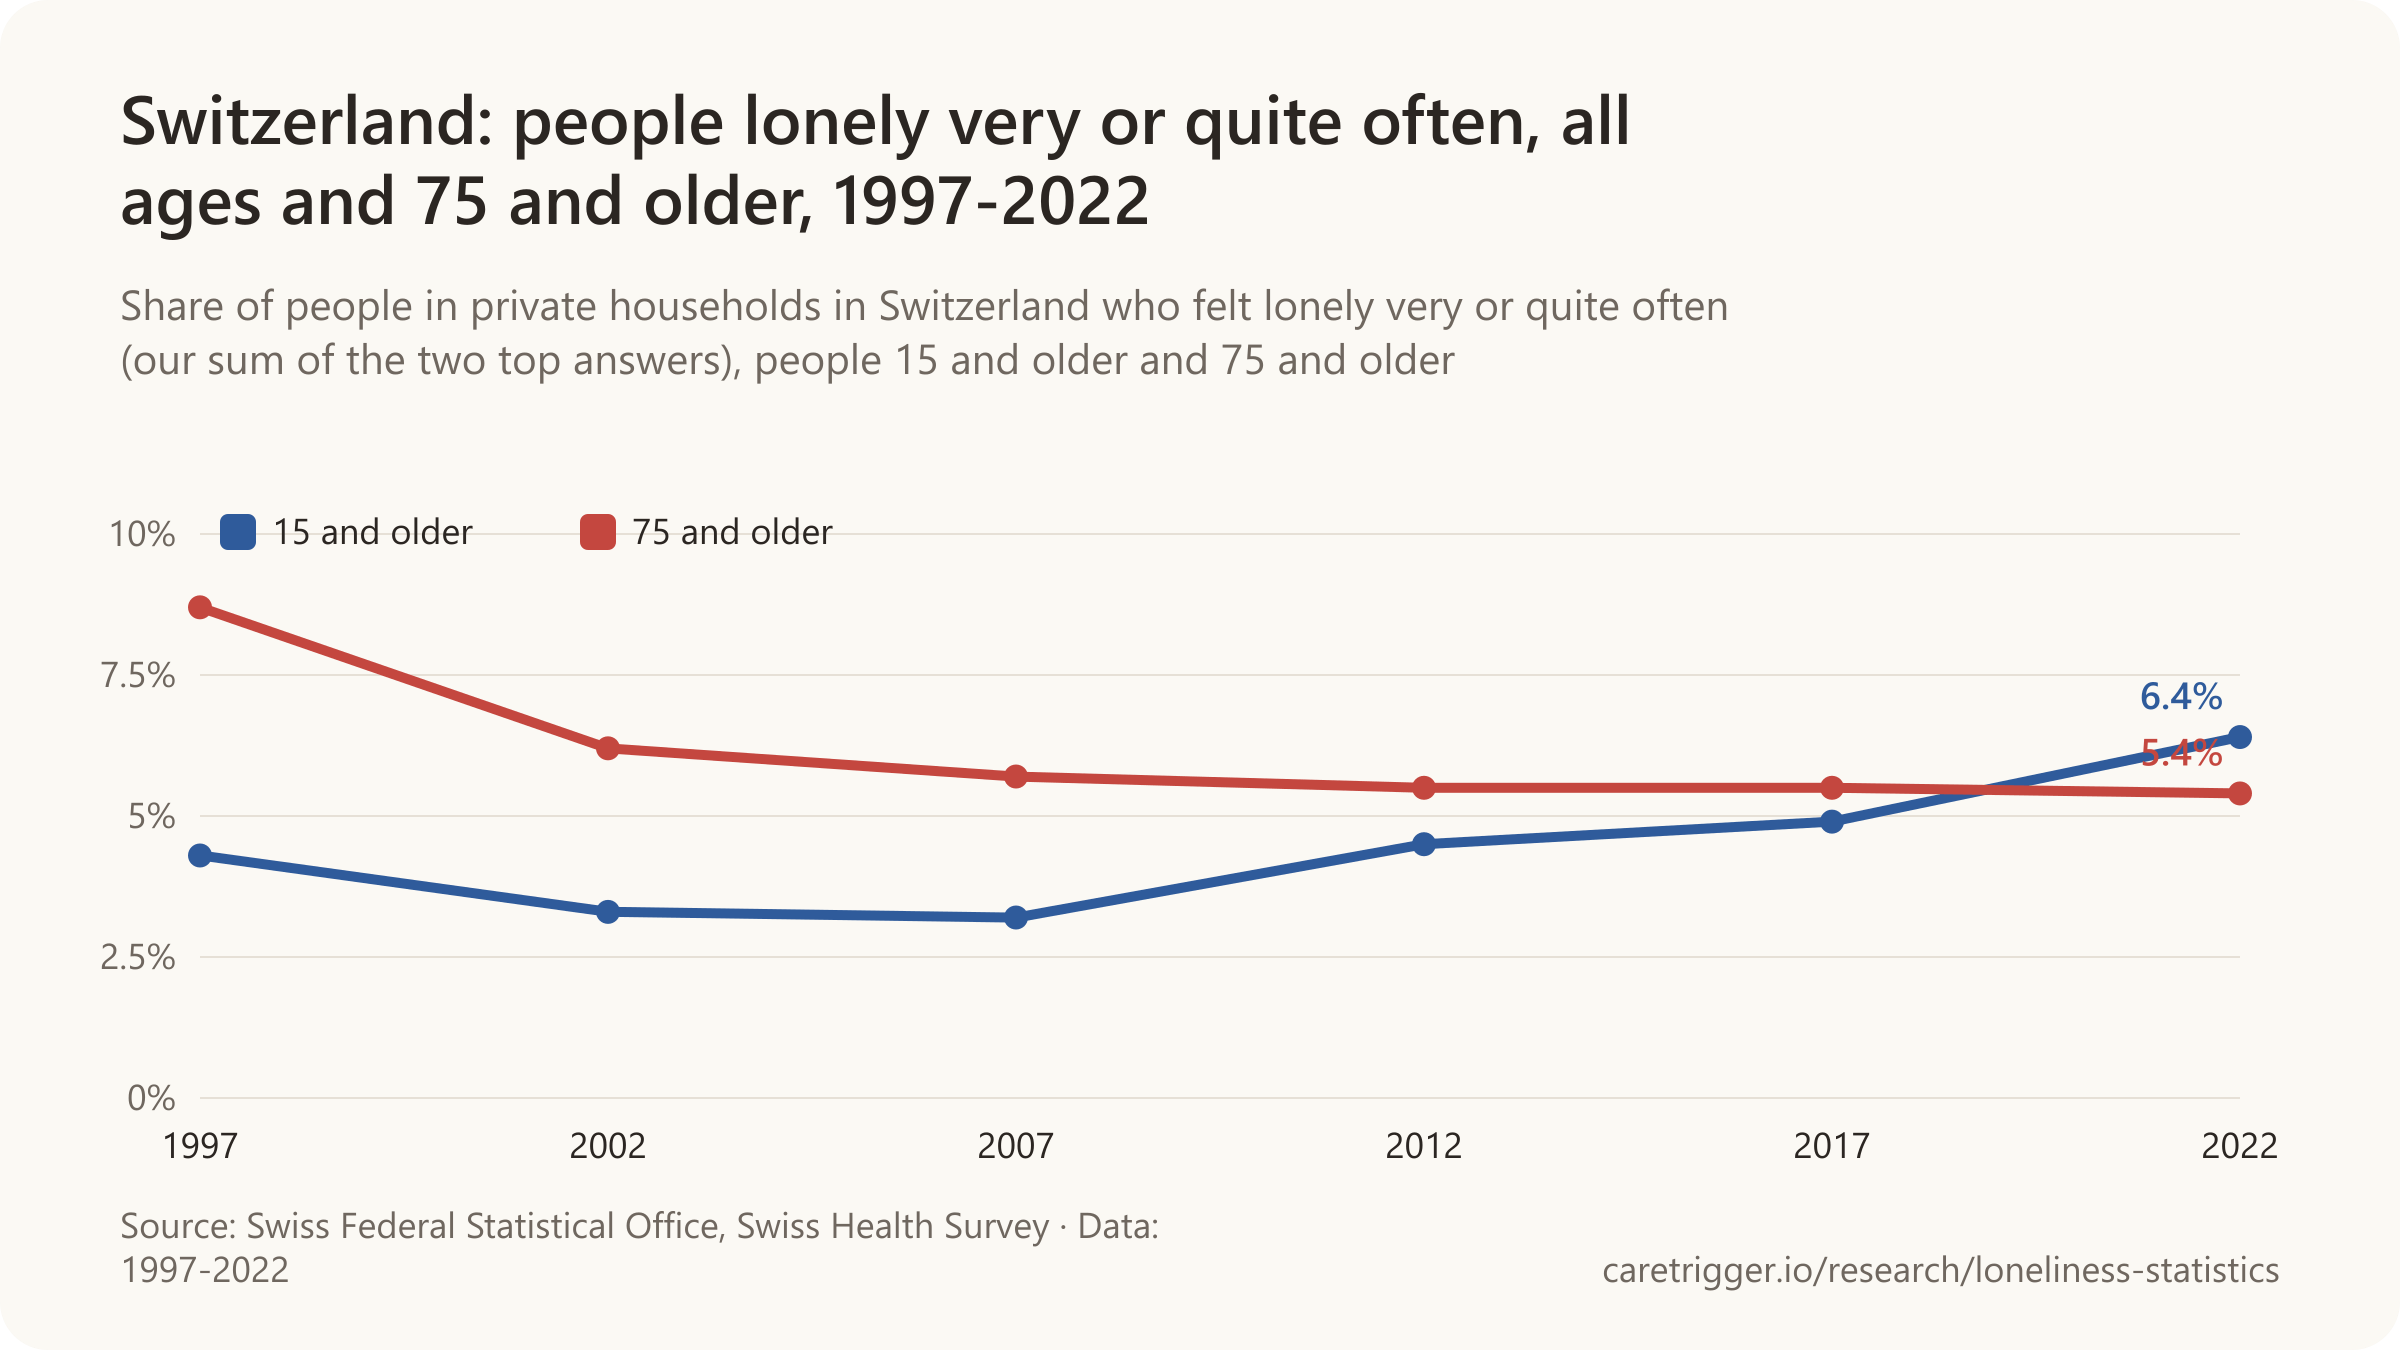
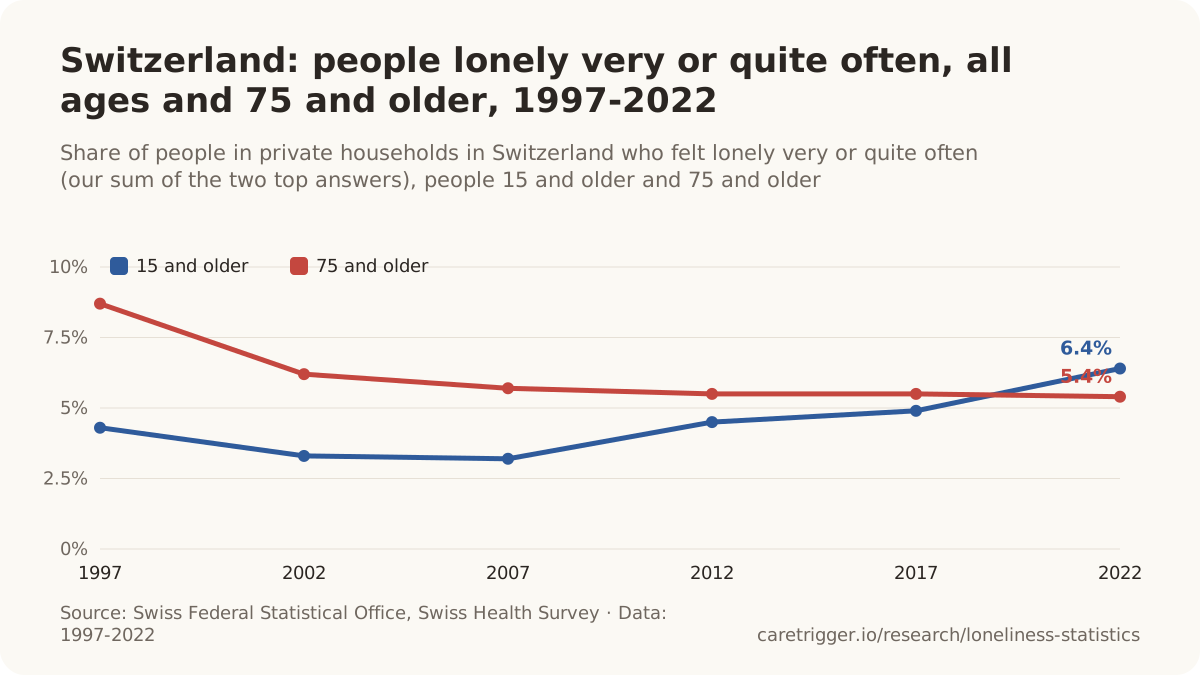

- 8.3% of adults aged 18+ in Germany often felt lonely in 1992, falling to 5.3% by 2013 on the Socio-Economic Panel's one-item question, a long decline that the pandemic broke (BMFSFJ, Einsamkeitsbarometer 2024).
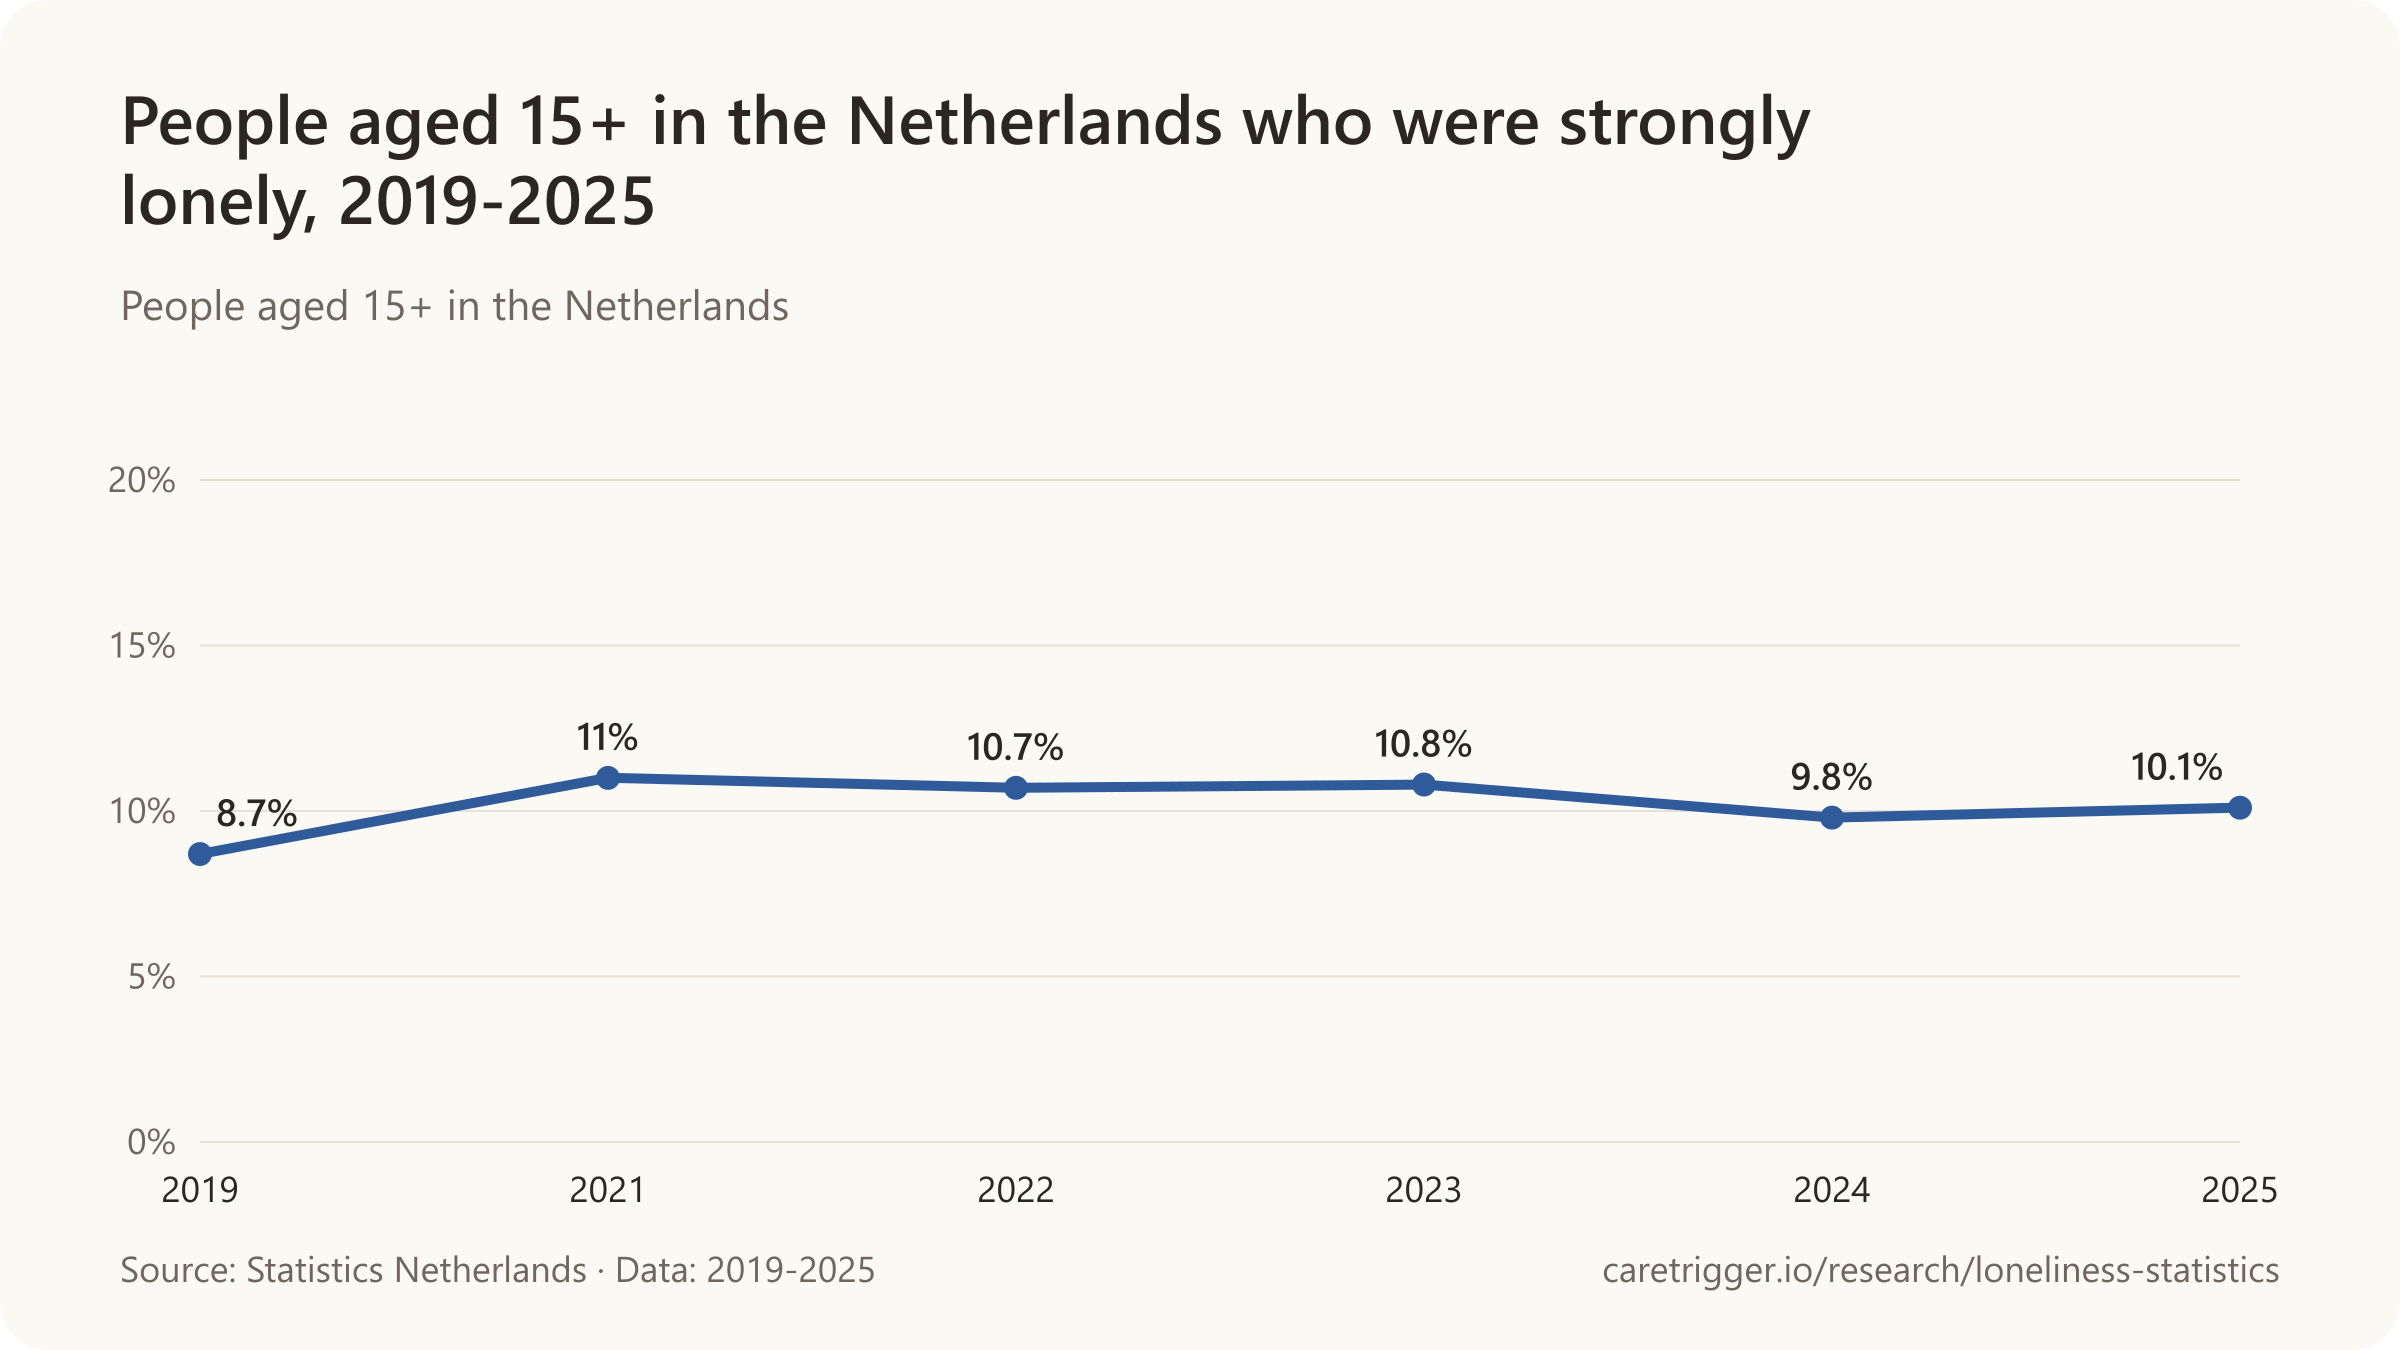
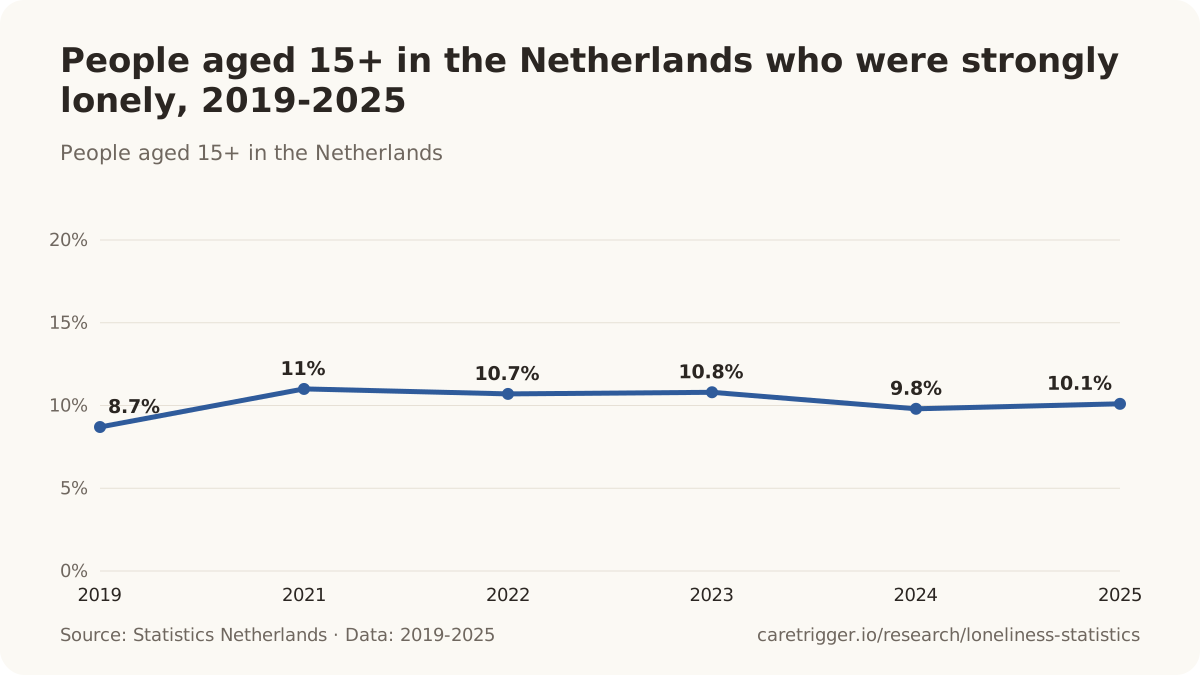
- 46% of adults aged 18+ in the Netherlands were lonely in 2024, 33% moderately and 13% strongly, on the 11-item De Jong Gierveld scale in the national health monitor (RIVM, VZinfo, 2026).
- 39% of adults in the Netherlands were lonely in 2012, rising to 49% in 2022 before easing to 46% in 2024, on the 11-item De Jong Gierveld scale (RIVM, VZinfo, 2026).
- 15% of adults aged 18+ in Norway, about 680,000 people, were quite or very much bothered by loneliness in the past 14 days in 2026 (Statistics Norway, Quality of Life Survey).
- 12% of adults in Norway were quite or very much bothered by loneliness in March 2020, rising to 16% in 2021 (Statistics Norway, Quality of Life Survey).
- 5% to 7% of adults in Norway said they were lonely from the late 1990s to the early 2010s in earlier surveys using the same question, below today's level, though SSB says comparability is uncertain (Statistics Norway, 2026).
- Nearly 30% of non-heterosexual adults in Norway were quite or very much bothered by loneliness in 2026, against nearly 14% of heterosexual adults (Statistics Norway, Quality of Life Survey).
France, Italy, Belgium and Spain
- 30% of people aged 60+ in France felt lonely at least from time to time in 2025 (Petits Frères des Pauvres barometer, 2025).
- 36% of people aged 60+ in France felt lonely at least from time to time in 2021 (Petits Frères des Pauvres barometer, 2025).
- 31% of people aged 60+ in France felt lonely at least from time to time in 2017 (Petits Frères des Pauvres barometer, 2025).
- 33% of people aged 16+ in France felt lonely sometimes, most of the time or all the time in the four weeks before the 2022 survey, up from 27% in 2018 (INSEE, France portrait social, 2025).
- 27% of people aged 16+ in France said they felt lonely in 2018, before rising to 33% in 2022 (INSEE, France portrait social, 2025).
- 26.8% of people aged 16+ in Italy felt lonely at least part of the time in the past four weeks in 2021, 8.5 points more than in 2018 (18.3%) (ISTAT, BES 2022).
- 18.3% of people aged 16+ in Italy felt lonely at least part of the time in the past four weeks in 2018, before rising to 26.8% in 2021 (ISTAT, BES 2022).
- 57% of adults in Belgium have felt moderately or severely lonely since June 2023, after peaks of up to seven in ten during the COVID-19 lockdowns (Sciensano, Healthy Belgium).
Europe-wide
- 20.0% of lesbian, gay, bisexual and other non-heterosexual people in the EU felt lonely most or all of the time in 2022, against 12.4% of heterosexual people (Berlingieri et al., Loneliness in Europe, 2024).
- 22 percentage points or more was the rise in frequent loneliness among people living alone in the EU between 2016 and the first months of the pandemic, against 9 points for those living with a partner or children (European Commission Joint Research Centre, 2021).
- 6% of people in northern Europe felt lonely more than half of the time before the pandemic, the lowest of any European region (European Commission Joint Research Centre, 2021).
- 22% to 26% of people in every European region felt lonely more than half of the time in the first months of the pandemic, erasing the pre-pandemic north-south gap (European Commission Joint Research Centre, 2021).
Asia, Canada, Australia and Latin America



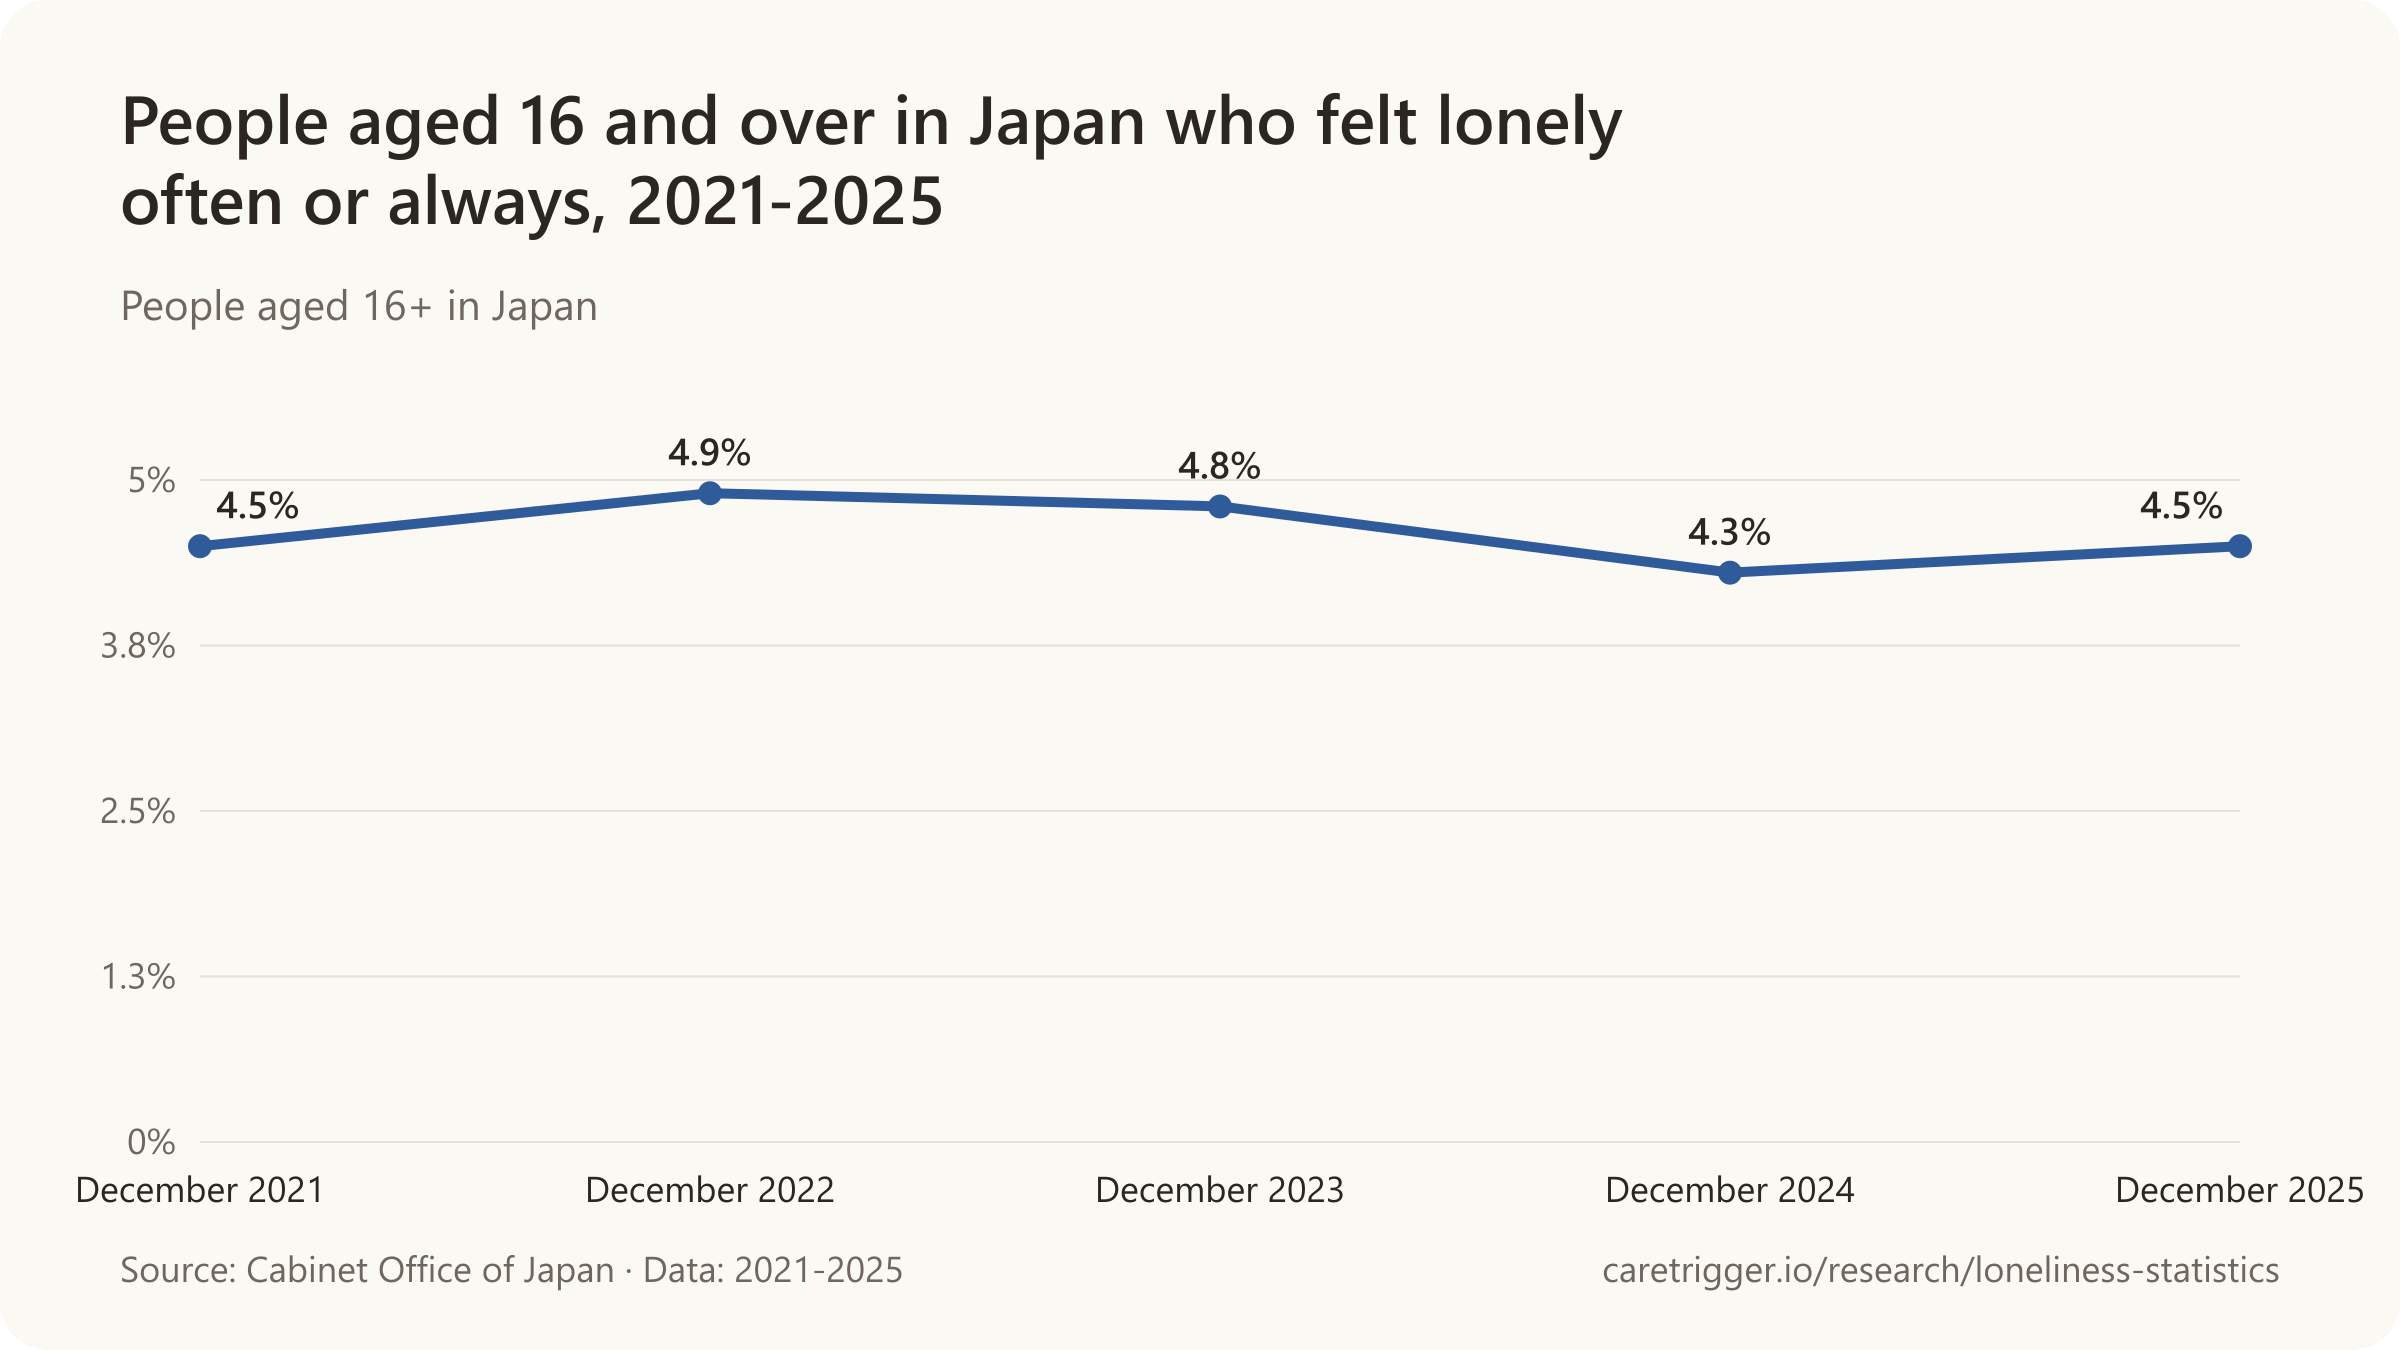
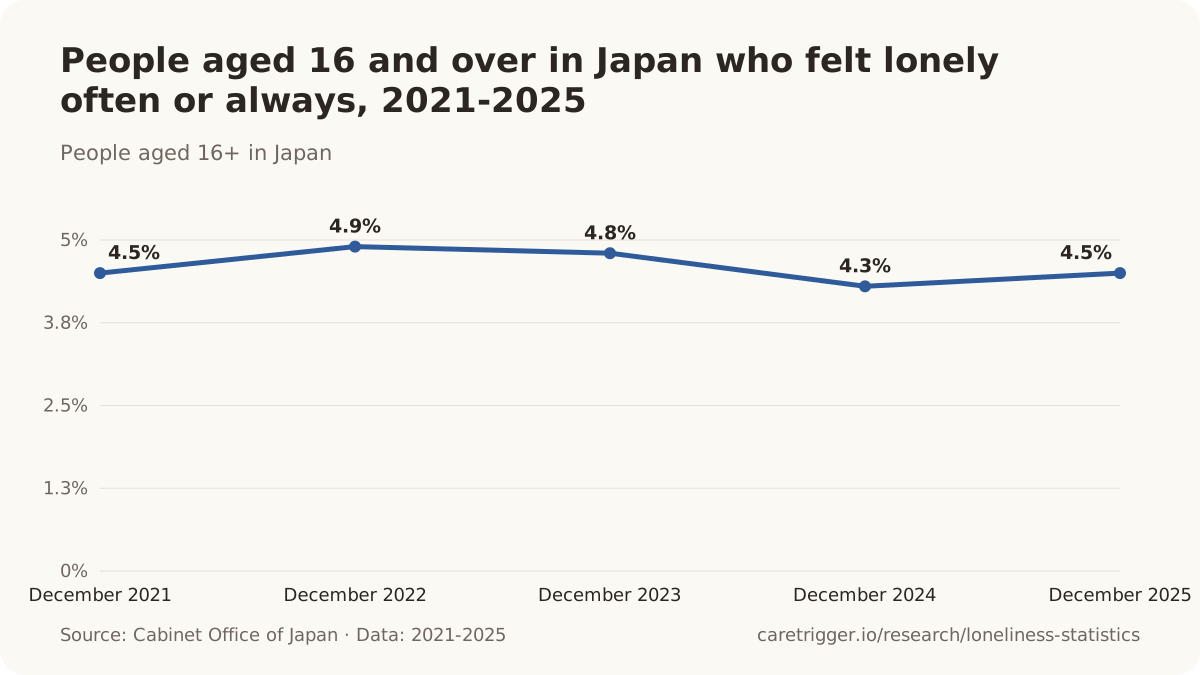

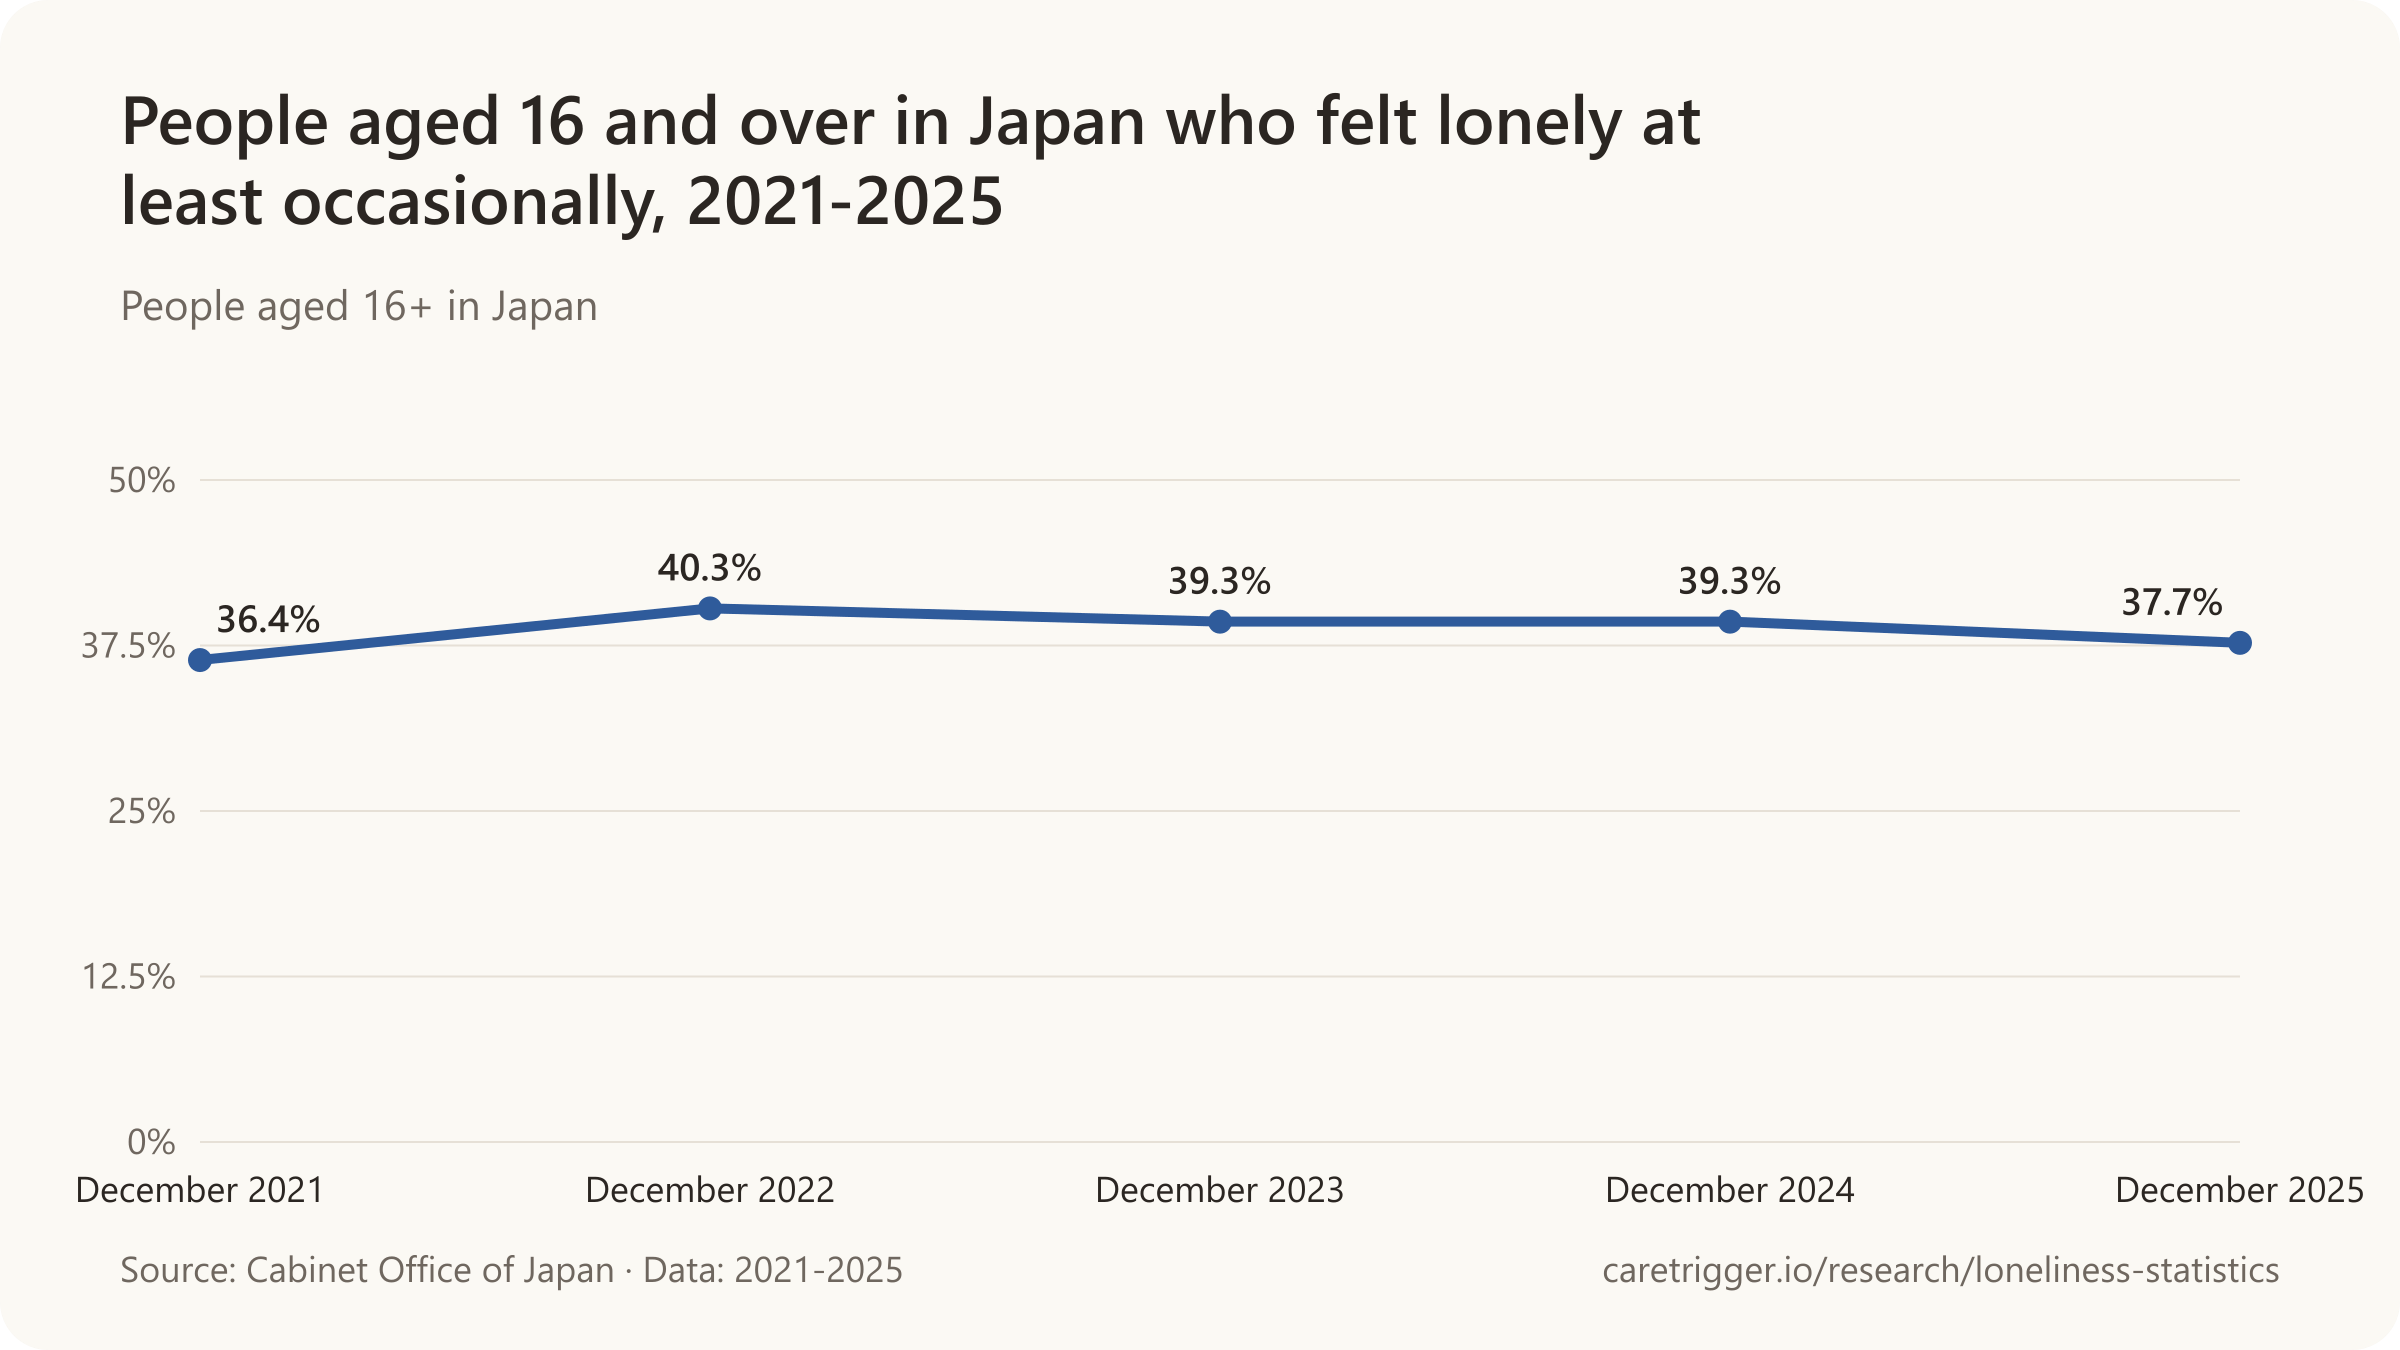
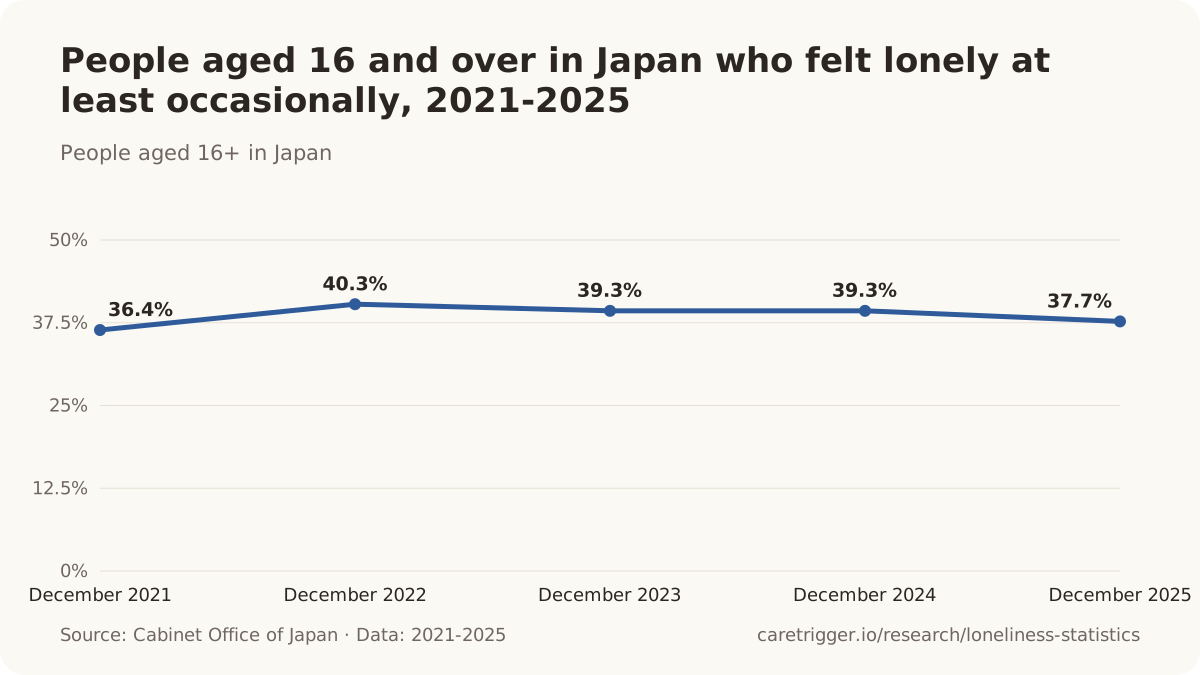

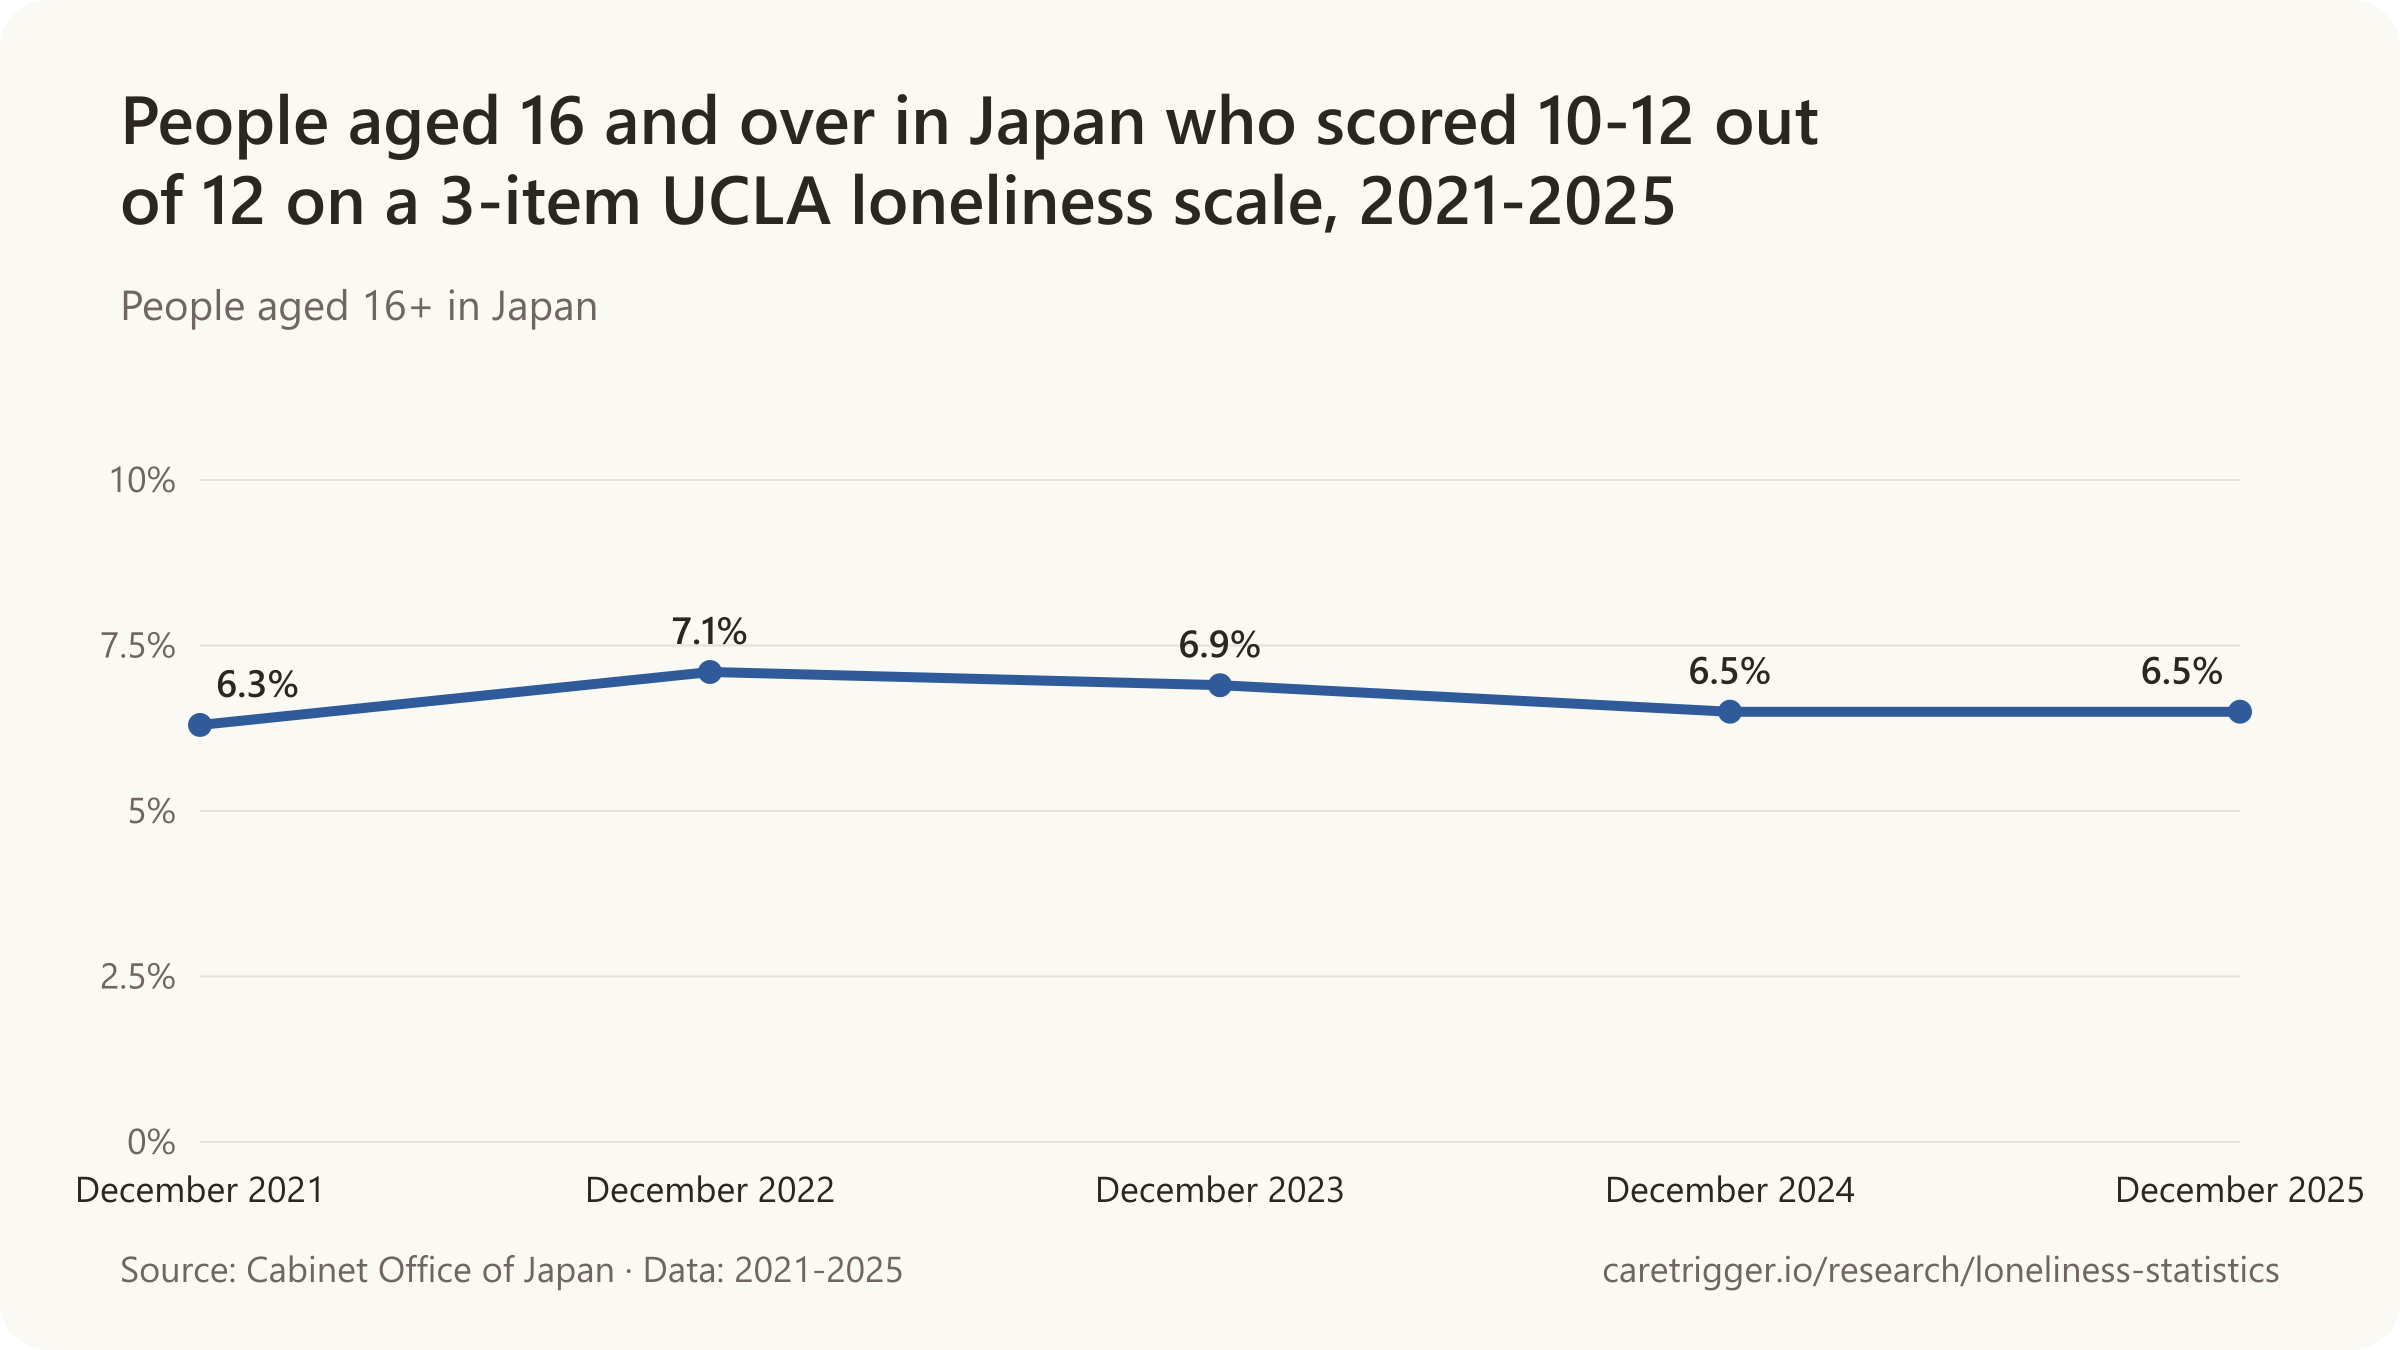
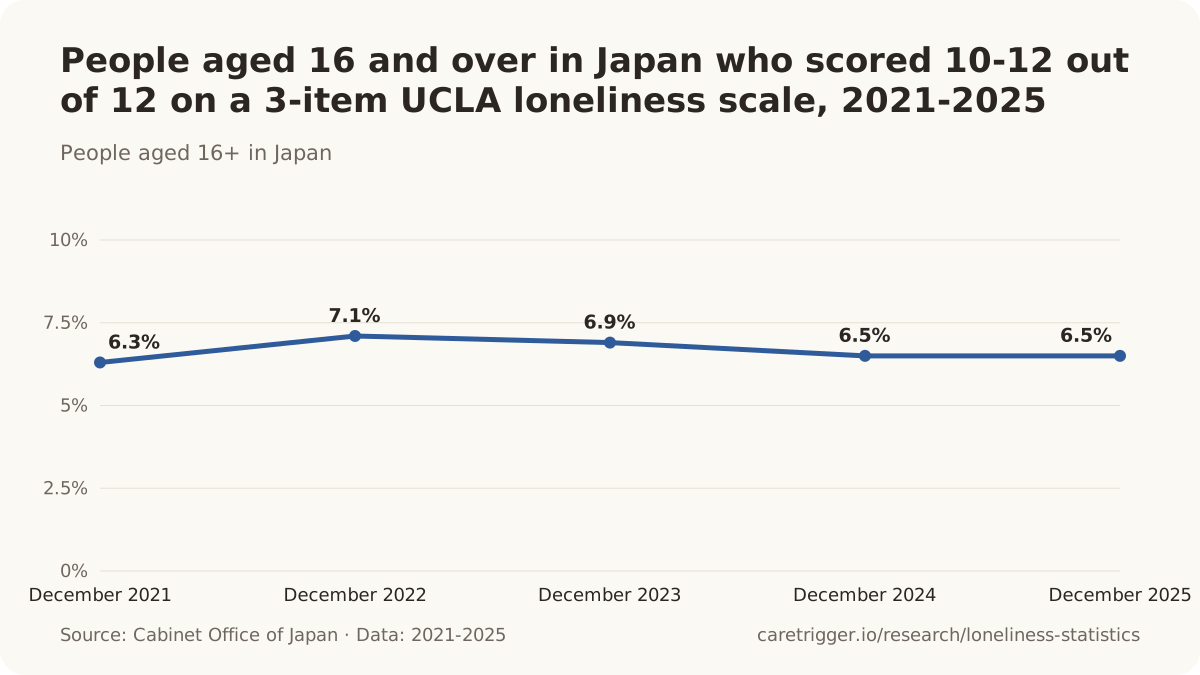
- 4.5% of people aged 16 and over in Japan felt lonely often or always in December 2025 (Cabinet Office of Japan, national loneliness survey 2025).
- 29.9% of Australians who identify as gay, lesbian or bisexual agreed that they often feel very lonely in 2025, against 16.9% of heterosexual people (Australian Bureau of Statistics, General Social Survey 2025).
- 20.5% of Australians were chronically socially isolated (two or more consecutive years) in 2023, double the 10.3% in 2002, in the HILDA survey (Hagani et al., International Journal of Epidemiology, 2026).
- 3.8% to 66.4% is the range of loneliness prevalence among older Indians across 11 studies, too varied to pool because the studies used different scales and cut-offs (Muralidharan et al., Indian Journal of Medical Research, 2026).
- 9.6% of Chileans aged 18 and over felt lonely always or almost always in the past four weeks in 2025, statistically unchanged from 9.3% in 2023 (Ministry of Social Development and Family, Encuesta de Bienestar Social 2025).
- 9.3% of Chileans aged 18 and over felt lonely always or almost always in the past four weeks in 2023, the first time the national well-being survey asked (Ministry of Social Development and Family, Encuesta de Bienestar Social 2023).
Other figures
- The share of US adults aged 50-80 feeling isolated from others some of the time or often jumped from 26.6% in 2018 to 55.7% in June 2020 and had fallen back to 29.2% by March 2024 (Malani et al., JAMA, 2025).
Sources: Gallup (2023-2026); Pew Research Center; Journals of Gerontology: Series B; SSM - Population Health; AARP Research (2018, 2025); AARP; U.S. Census Bureau (2026); Making Caring Common, Harvard Graduate School of Education; Survey Center on American Life (2021, 2024); American Sociological Review; The Executive Office, Programme for Government Analytics (2026); Department for Digital, Culture, Media and Sport (2019, 2020, 2021); Department for Culture, Media and Sport (2025); Department for Culture, Media and Sport and Ministry of Housing, Communities and Local Government; Office for National Statistics (2018, 2021, 2026); Age UK (2018); Social Science & Medicine; Sociology of Health & Illness; JAMA Psychiatry; Ageing & Society; Scottish Government; The Irish Longitudinal Study on Ageing and ALONE; The Irish Longitudinal Study on Ageing, Trinity College Dublin; Federal Ministry for Family Affairs, Senior Citizens, Women and Youth (2024); German Centre of Gerontology; Finnish Institute for Health and Welfare, Sotkanet statistics service (2025); Swiss Federal Statistical Office, Swiss Health Survey; Statistics Netherlands; RIVM, VZinfo, data; Statistics Norway; Petits Frères des Pauvres, survey by CSA Research; INSEE; ISTAT; Sciensano / Healthy Belgium; Springer; European Commission, Joint Research Centre; Statistics Canada; Ministry of Data and Statistics, South Korea; Cabinet Office of Japan (2022-2026); Australian Bureau of Statistics; International Journal of Epidemiology; Indian Journal of Medical Research; Ministry of Social Development and Family, Chile (2024, 2026); Central Bureau of Statistics, Israel (2023, 2024, 2025); JAMA
03 / Age
What age group is the loneliest?
Worldwide, people 60 and older are the least lonely age group, 11.8%, against 20.9% of 13- to 17-year-olds (WHO, 2025).

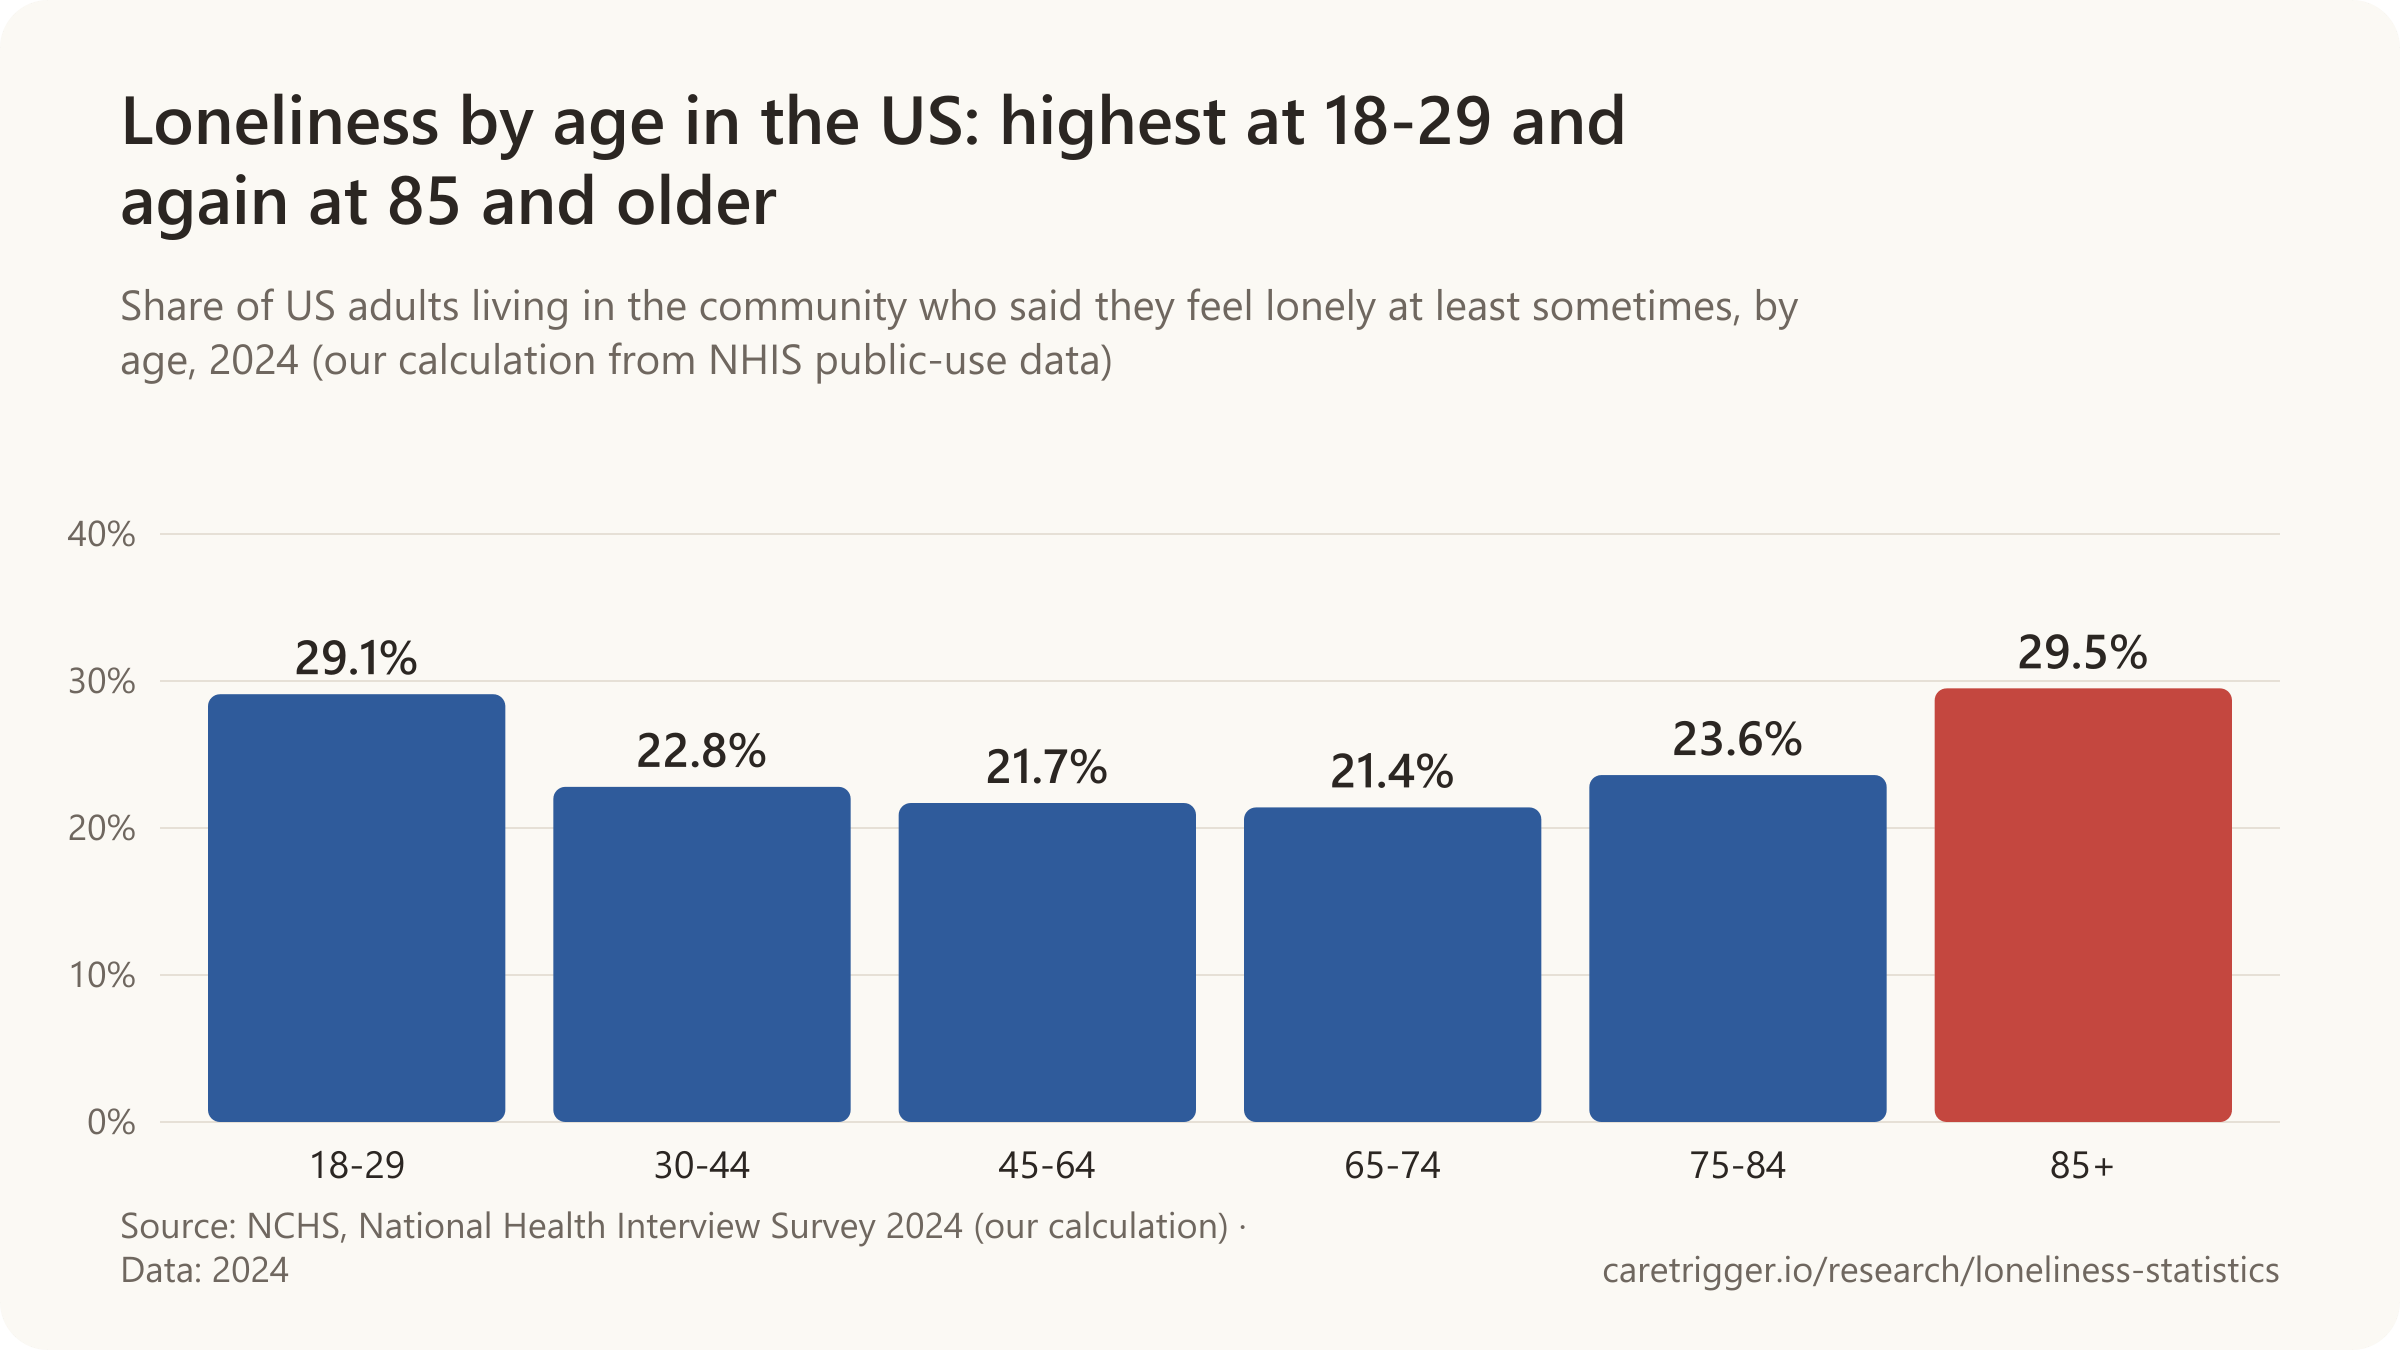
- 29.5% of Americans 85 and older living at home feel lonely at least sometimes, as many as at 18 to 29 (2024).
- In England, 9% of 16- to 24-year-olds felt lonely often or always in 2025/26, the most of any age group.
- In 23 European countries, people 65 and older were the loneliest age group: 8.4% lonely most or all of the time (2022).
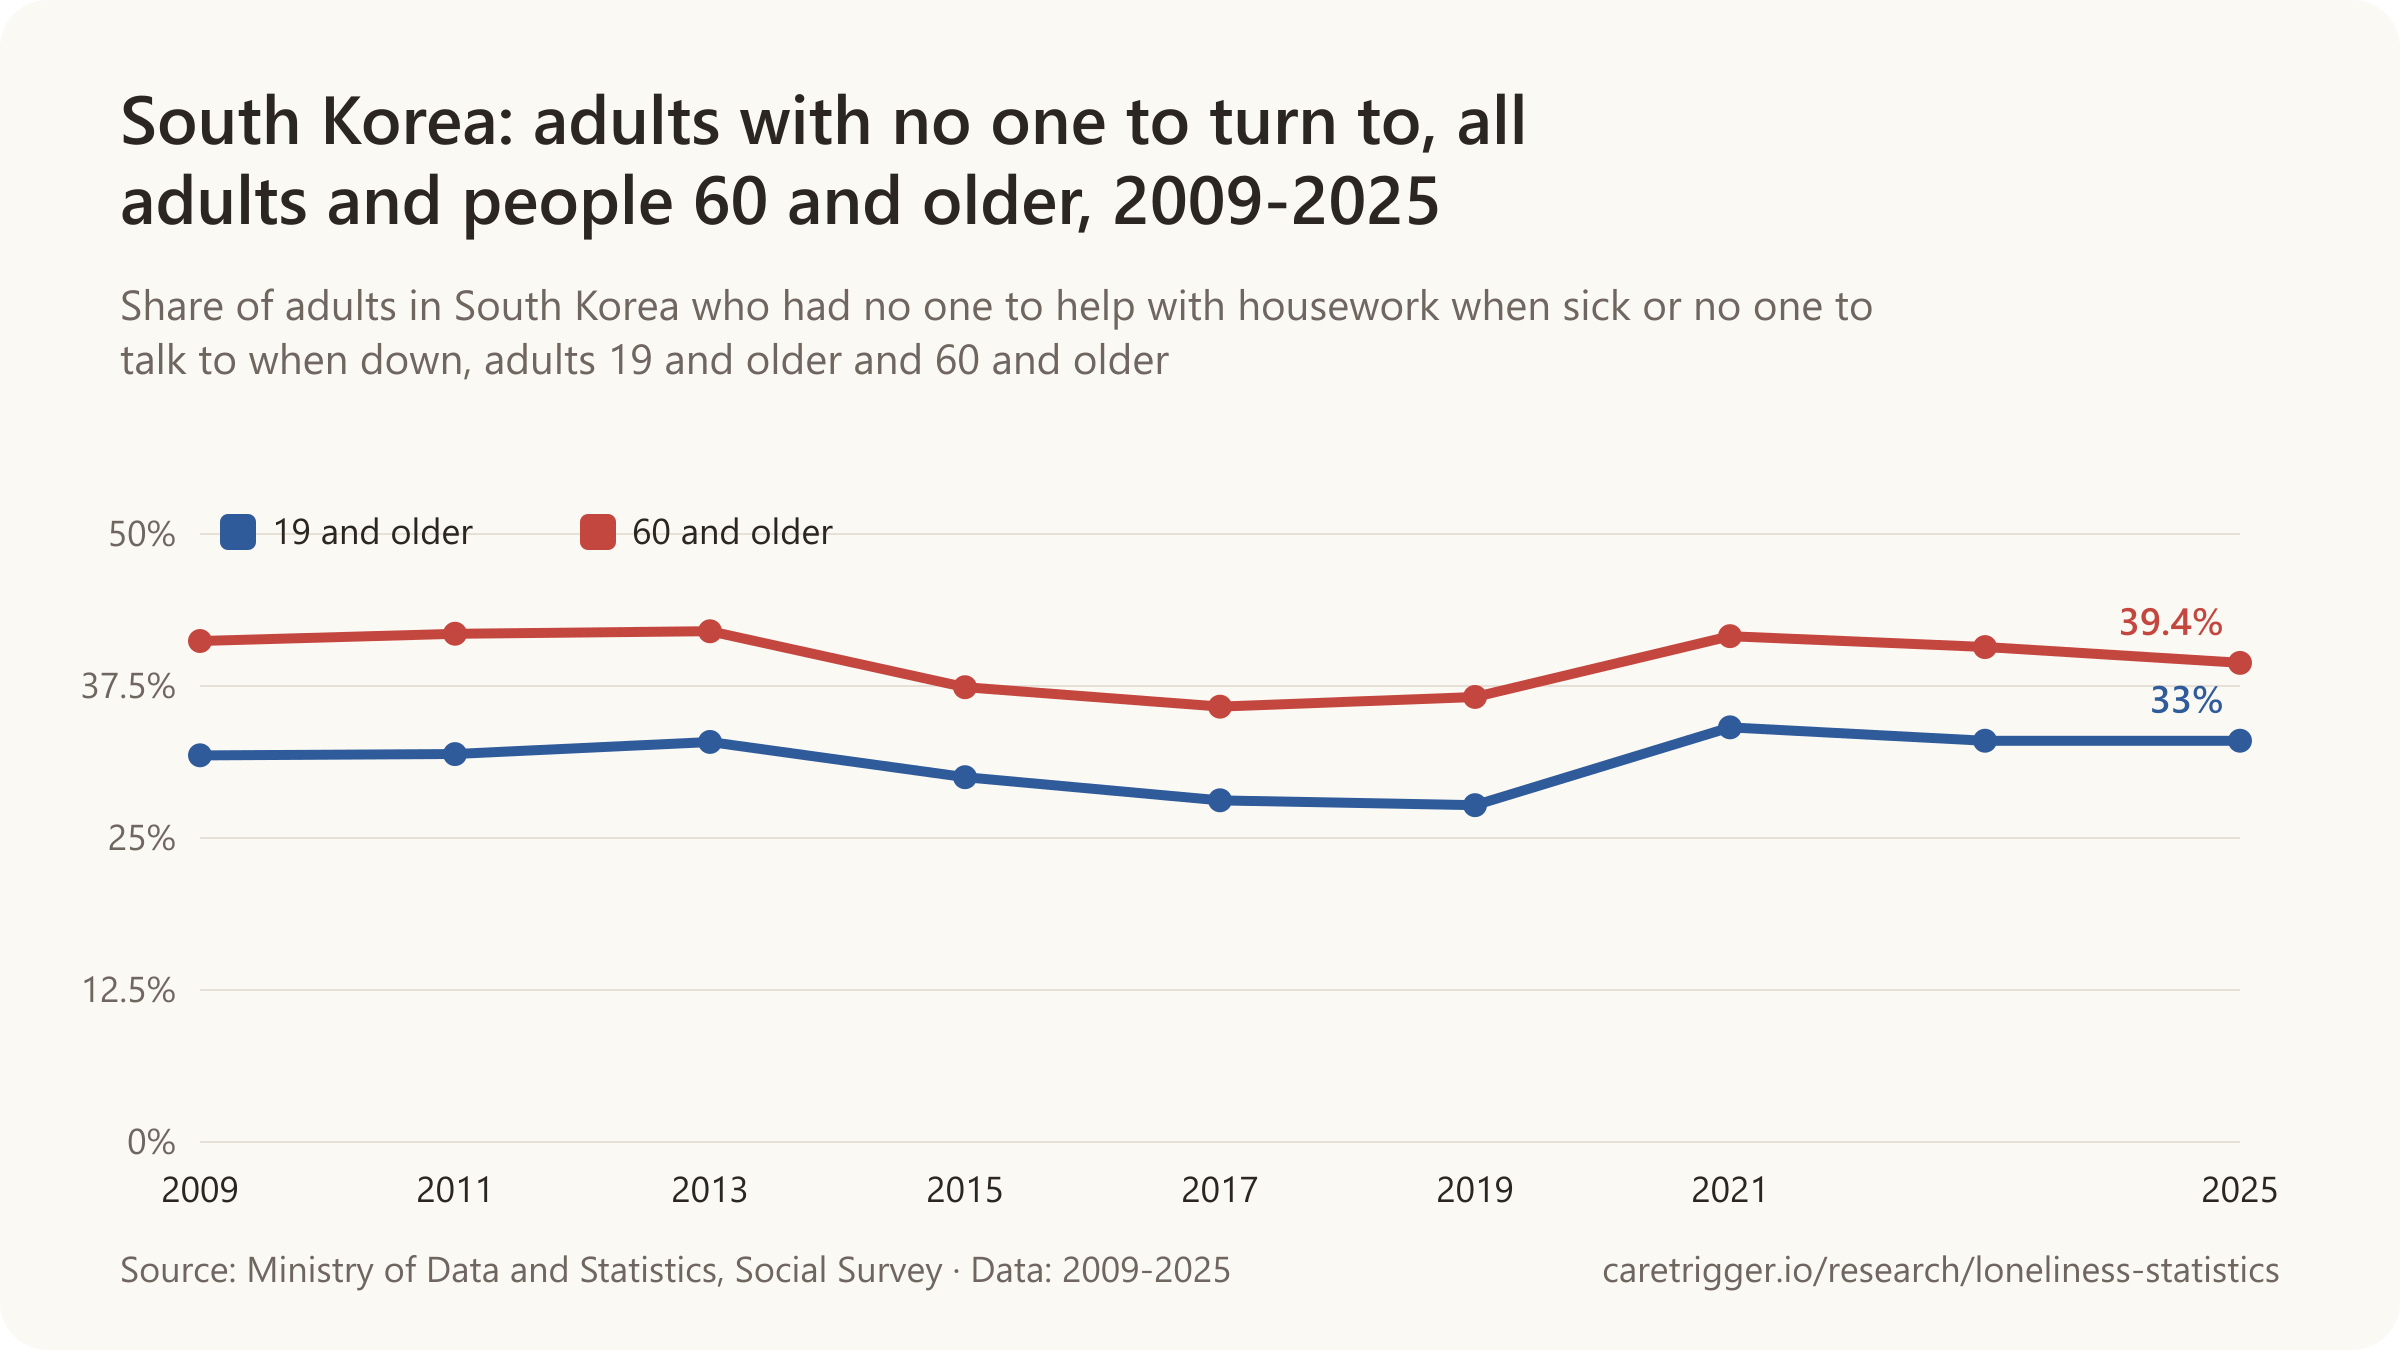
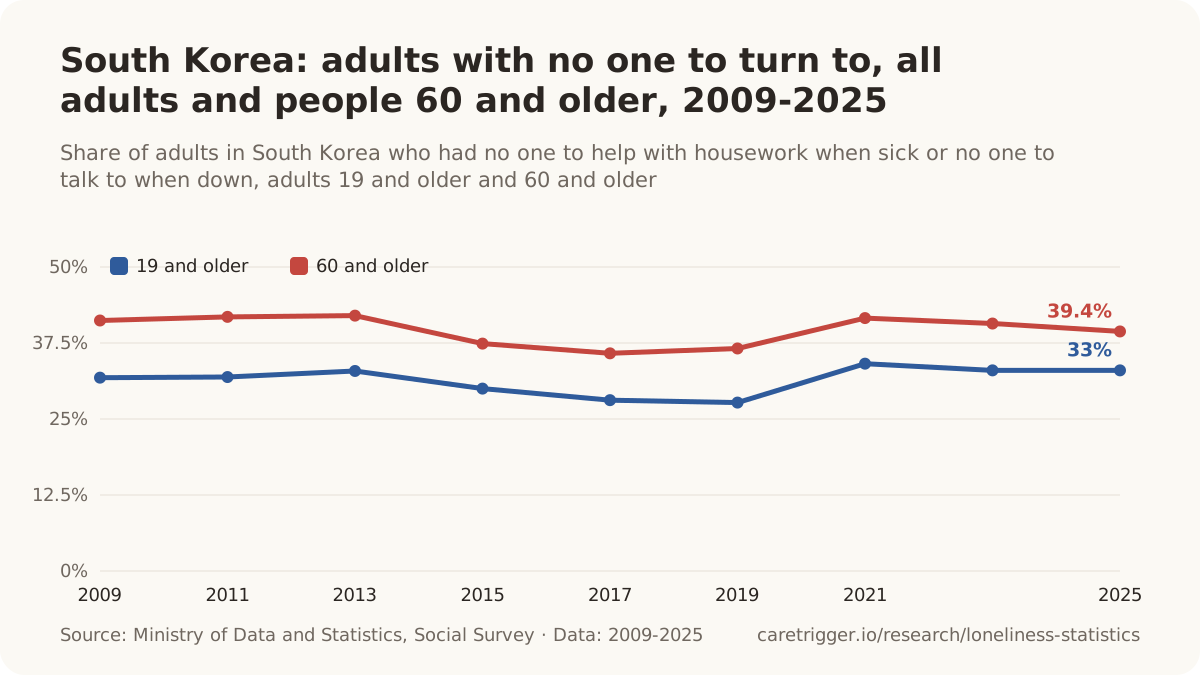
- In South Korea, 52.1% of people 80 and older feel lonely often or sometimes in daily life, more than any younger age group (2025).
- 27% of 19- to 29-year-olds in 142 countries felt very or fairly lonely, against 17% of people 65 and older (Meta-Gallup).
On most surveys young adults are the loneliest, loneliness dips through middle age, and it rises again among the oldest. It is not true everywhere: in the European Union's official survey, in Italy and in South Korea, older people report more loneliness than the young.
Sources: World Health Organization; National Center for Health Statistics; Department for Culture, Media and Sport and Ministry of Housing, Communities and Local Government; OECD; Ministry of Data and Statistics; Gallup
More statistics (202)
11.8% of people aged 60 and over worldwide experience loneliness, the lowest rate of any age group (women 13.0%, men 9.9%), against 20.9% of 13-17-year-olds (WHO Commission on Social Connection, 2025).
- 29.5% of US adults aged 85 and older living in the community said they feel lonely at least sometimes in 2024 (our calculation from NHIS 2024 public-use data, NCHS, 2025).
- 27% of young adults aged 19-29 in 142 countries felt very or fairly lonely, the highest of any age group (Meta-Gallup Global State of Social Connections, a Gallup survey for Meta, 2023).
- 20.9% of adolescents aged 13-17 worldwide were lonely, the highest rate of any age group (95% uncertainty interval 15.6-28.5%), on average in 2014-2023 (WHO Commission on Social Connection, 2025).
- 17.4% of young adults aged 18-29 worldwide were lonely (95% uncertainty interval 13.2-23.6%), on average in 2014-2023 (WHO Commission on Social Connection, 2025).
- 15.1% of adults aged 30-59 worldwide were lonely (95% uncertainty interval 11.0-21.2%), on average in 2014-2023 (WHO Commission on Social Connection, 2025).
- 80 and over is the age at which loneliness may rise again, the WHO Commission says, consistent with the U-shape in earlier studies, but its estimates put everyone aged 60 and over in one group and cannot show it (WHO Commission on Social Connection, 2025).
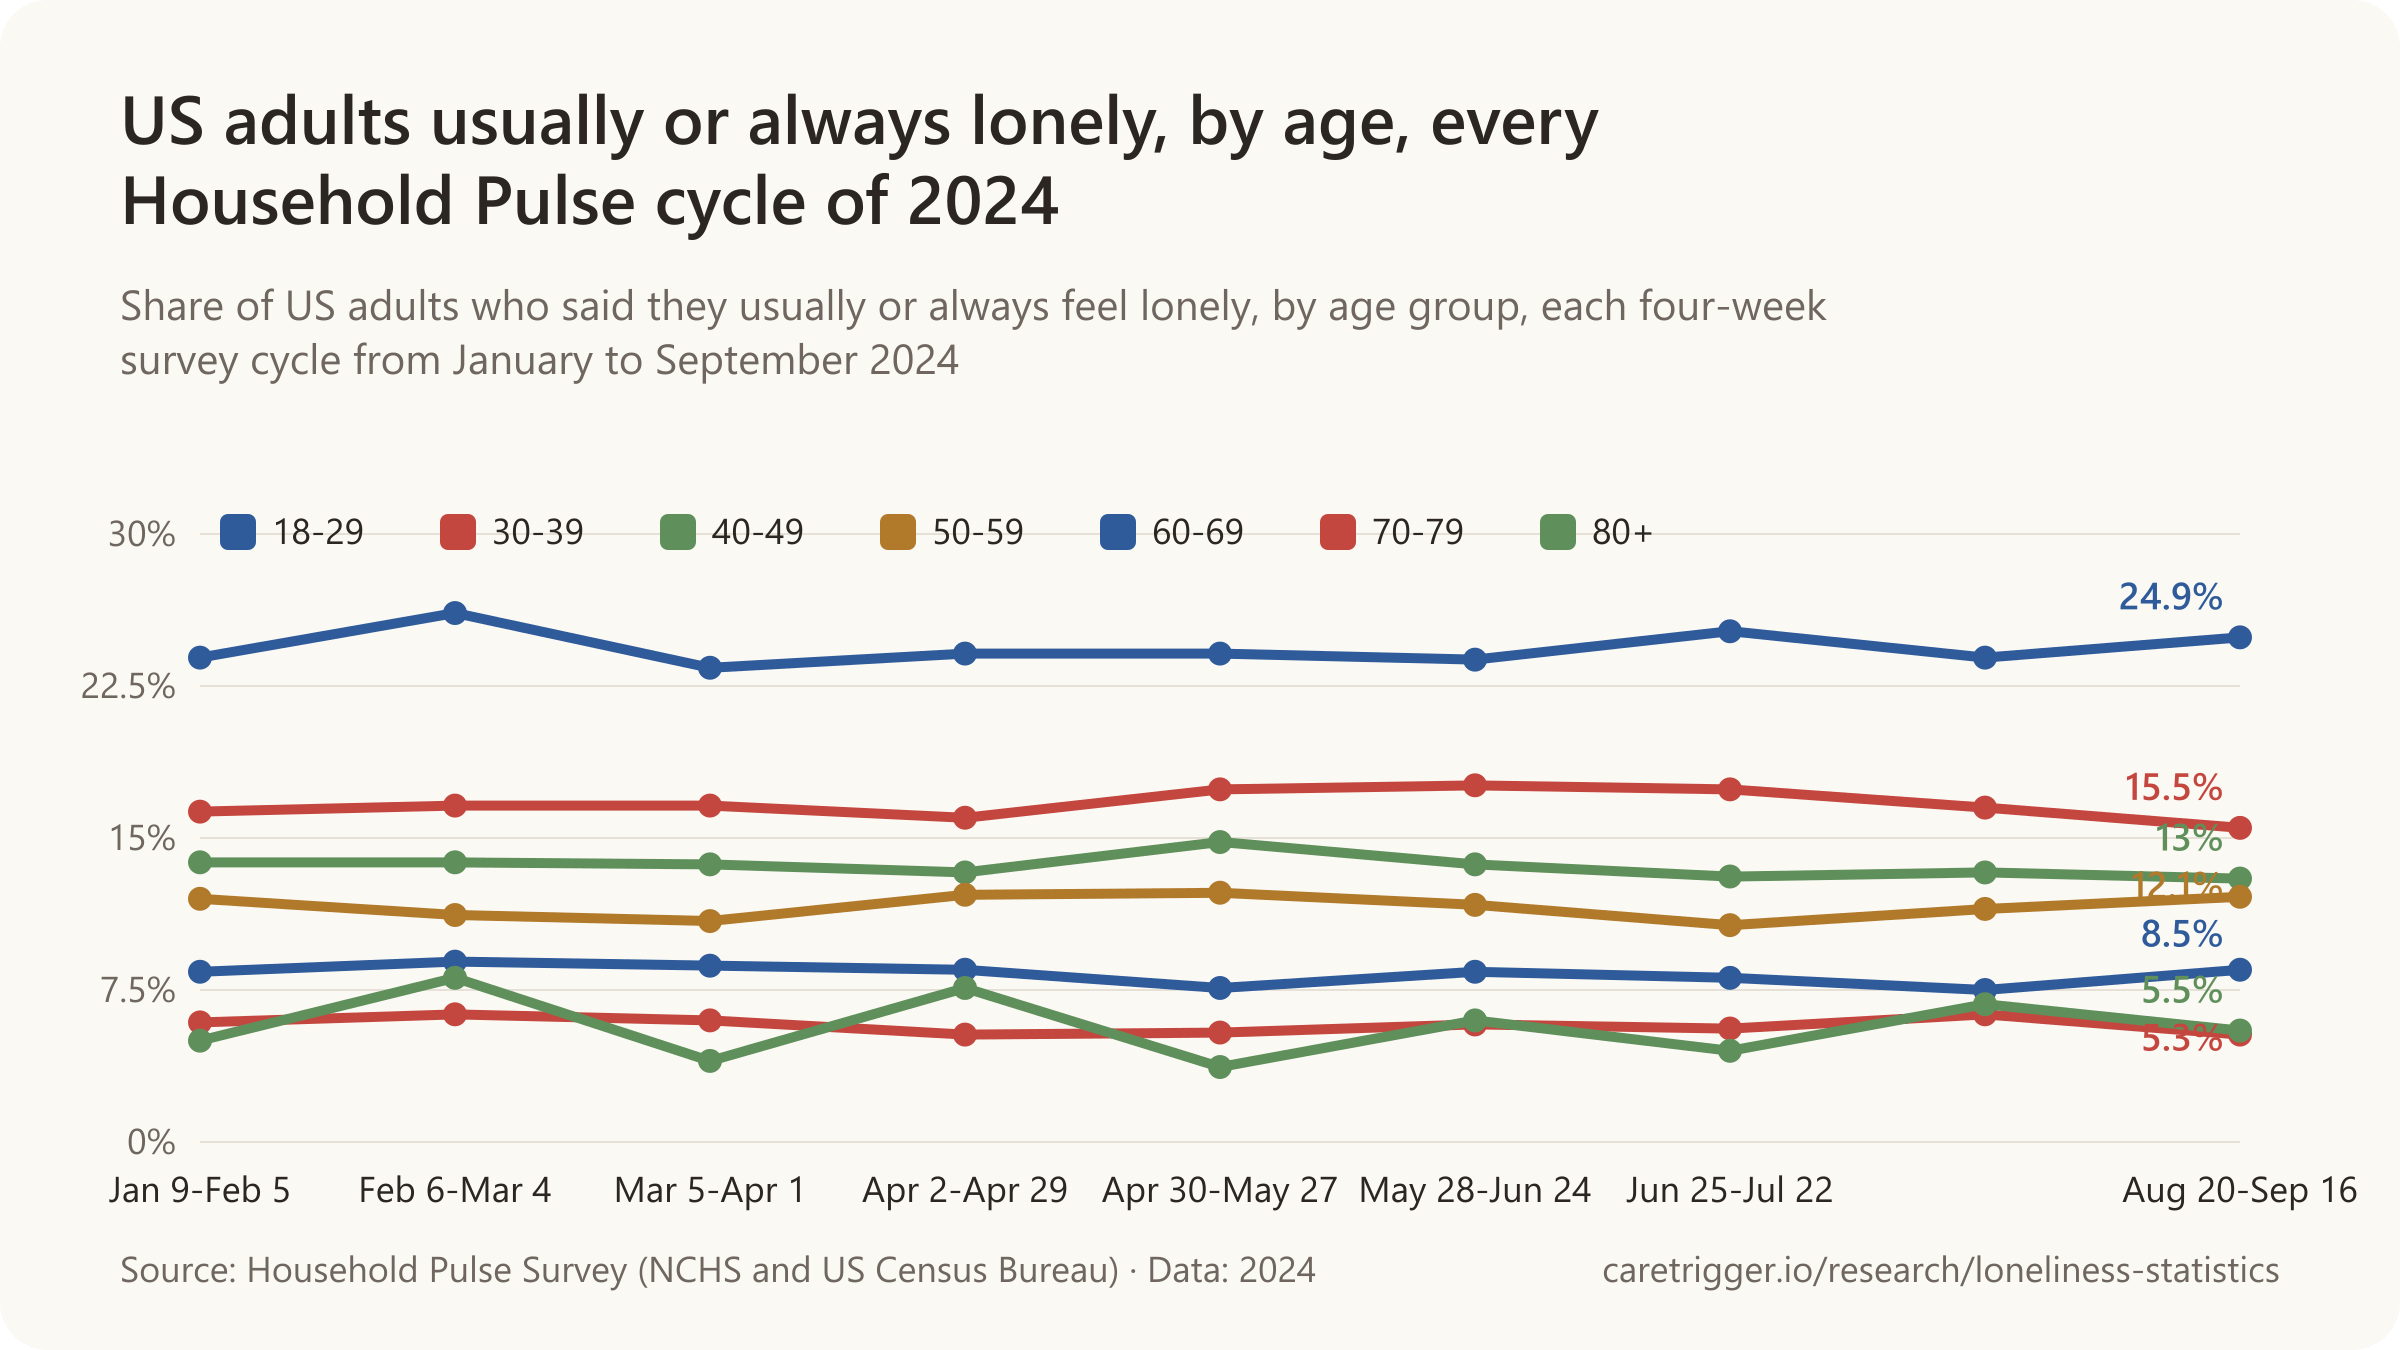
- 3.9% of US adults aged 65-74 living in the community said they usually or always feel lonely in 2024 (our calculation from NHIS 2024 public-use data, NCHS, 2025).
- 3.8% of US adults aged 75-84 living in the community said they usually or always feel lonely in 2024 (our calculation from NHIS 2024 public-use data, NCHS, 2025).
- 5.4% of US adults aged 85 and older living in the community said they usually or always feel lonely in 2024 (our calculation from NHIS 2024 public-use data, NCHS, 2025).
| Age | Very or fairly lonely | Scope |
|---|---|---|
| 15-18 | 25% | People aged 15-18 in 142 countries and areas · 142 countries and areas (excluding China) · June 2022 to February 2023 |
| 19-29 | 27% | People aged 19-29 in 142 countries and areas · 142 countries and areas (excluding China) · June 2022 to February 2023 |
| 30-44 | 25% | People aged 30-44 in 142 countries and areas · 142 countries and areas (excluding China) · June 2022 to February 2023 |
| 45-64 | 22% | People aged 45-64 in 142 countries and areas · 142 countries and areas (excluding China) · June 2022 to February 2023 |
| 65+ | 17% | People aged 65+ in 142 countries and areas · 142 countries and areas (excluding China) · June 2022 to February 2023 |
United States

- 24% of US adults aged 70 and older were lonely on the UCLA Loneliness Scale in 2018, against 46% of adults aged 45-49 (AARP Research, 2018).
- 43% of US adults aged 45-49 were lonely on the UCLA Loneliness Scale in 2010, against 41% of those aged 50-59 and 32% of those aged 60-69 (Wilson & Moulton, AARP, 2010).
- 19.1% of adults aged 65 and older in 26 US states said they get the social and emotional support they need only sometimes, rarely or never in 2022, against 29.7% of adults aged 18-34 (Bruss et al., MMWR, 2024).
- 24% of US adults under 30 felt loneliness a lot of the day yesterday in February 2023, against 13% of adults aged 65 and older (Gallup Panel, Gallup, 2023).
- 38% of US adults under 30 felt loneliness a lot of the day yesterday in December 2020, at the pandemic peak, against 22% of adults aged 65 and older (Gallup Panel, Gallup, 2023).
- 13% of US adults aged 65 and older felt loneliness a lot of the day yesterday in February 2023, the least lonely age group (Gallup Panel, Gallup, 2023).
- 27% of US adults in households earning under $24,000 a year felt loneliness a lot of the day yesterday in February 2023, against 10% of those earning $180,000 or more (Gallup Panel, Gallup, 2023).
- 29% of US adults aged 18-29 felt loneliness a lot of the day yesterday in mid-2025, higher than any other age group (Gallup Panel, Gallup, 2025).
- 15% of US adults aged 65 and older felt loneliness a lot of the day yesterday in mid-2025, statistically unchanged since early 2023 while every younger age group rose (Gallup Panel, Gallup, 2025).
- 25% of US men aged 15-34 felt lonely a lot of the previous day in 2023-2024 against 17% of all other US adults, the largest such gap of any OECD country (Gallup World Poll, Gallup, 2025).
- 10% of US adults aged 65 and older said they felt lonely frequently or almost all of the time in the past 30 days in May 2024, against 29% of those aged 30-44 (Making Caring Common, Harvard, 2024).
- 24% of US adults aged 18-29 said they felt lonely frequently or almost all of the time in the past 30 days in May 2024 (Making Caring Common, Harvard, 2024).
- 61% of 18-25-year-olds in an online convenience sample said they felt lonely frequently or almost all the time in the prior four weeks in October 2020, against 24% of those aged 55-65 (Making Caring Common, Harvard, 2021).
- 51% of mothers with young children in an online convenience sample said they felt lonely frequently or almost all the time in the prior four weeks in October 2020 (Making Caring Common, Harvard, 2021).
- 67% of Gen Z adults and 44% of baby boomers classified as lonely in an insurer's 2024 online survey (The Cigna Group, Loneliness in America 2025).
- 19 was the age at which loneliness peaked before declining steadily into late life, in 4,885 US volunteers aged 10-97 (Shovestul et al., PLOS ONE, 2020).
- 6.3% of US adults aged 18-29 said they usually or always feel lonely in 2024 (Sikder, NHIS 2024 analysis, medRxiv preprint, 2026).
- 4.6% of US adults aged 30-44 said they usually or always feel lonely in 2024 (Sikder, NHIS 2024 analysis, medRxiv preprint, 2026).
- 4.9% of US adults aged 45-64 said they usually or always feel lonely in 2024 (Sikder, NHIS 2024 analysis, medRxiv preprint, 2026).
- 4.0% of US adults aged 65 and older said they usually or always feel lonely in 2024, the lowest of any age group (Sikder, NHIS 2024 analysis, medRxiv preprint, 2026).
- 49% of US adults aged 65 and older said they have five or more close friends in July 2023, against 32% of adults under 30 (Pew Research Center, 2023).
| Age | Lonely | Scope |
|---|---|---|
| 45-49 | 49% | US adults aged 45-49; UCLA-20 score 44+ · United States · August 4-19, 2025 |
| 50-59 | 45% | US adults aged 50-59; UCLA-20 score 44+ · United States · August 4-19, 2025 |
| 60-69 | 41% | US adults aged 60-69; UCLA-20 score 44+ · United States · August 4-19, 2025 |
| 70+ | 28% | US adults aged 70 and older; UCLA-20 score 44+ · United States · August 4-19, 2025 |
| Age | Felt isolated | Scope |
|---|---|---|
| 18-34 | 43.3% | adults aged 18-34 in 26 US states; felt socially isolated from others always, usually or sometimes · United States (26 states) · 2022 |
| 35-49 | 31.9% | adults aged 35-49 in 26 US states; felt socially isolated from others always, usually or sometimes · United States (26 states) · 2022 |
| 50-64 | 27.8% | adults aged 50-64 in 26 US states; felt socially isolated from others always, usually or sometimes · United States (26 states) · 2022 |
| 65+ | 23.8% | adults aged 65 and older in 26 US states; felt socially isolated from others always, usually or sometimes · United States (26 states) · 2022 |
| Age | Lack support | Scope |
|---|---|---|
| 18-29 | 50.8% | US adults aged 18-29, living in households; sometimes, rarely or never get the social and emotional support they need · United States · Aug 20-Sep 16, 2024 |
| 30-39 | 45.5% | US adults aged 30-39, living in households; sometimes, rarely or never get the social and emotional support they need · United States · Aug 20-Sep 16, 2024 |
| 40-49 | 47.4% | US adults aged 40-49, living in households; sometimes, rarely or never get the social and emotional support they need · United States · Aug 20-Sep 16, 2024 |
| 50-59 | 43.6% | US adults aged 50-59, living in households; sometimes, rarely or never get the social and emotional support they need · United States · Aug 20-Sep 16, 2024 |
| 60-69 | 33.3% | US adults aged 60-69, living in households; sometimes, rarely or never get the social and emotional support they need · United States · Aug 20-Sep 16, 2024 |
| 70-79 | 25% | US adults aged 70-79, living in households; sometimes, rarely or never get the social and emotional support they need · United States · Aug 20-Sep 16, 2024 |
| 80+ | 22.8% | US adults aged 80 and older, living in households; sometimes, rarely or never get the social and emotional support they need · United States · Aug 20-Sep 16, 2024 |
| Age | At least sometimes | Scope |
|---|---|---|
| 18-29 | 58.8% | US adults aged 18-29, living in households; sometimes, usually or always feel lonely · United States · Aug 20-Sep 16, 2024 |
| 30-39 | 45.7% | US adults aged 30-39, living in households; sometimes, usually or always feel lonely · United States · Aug 20-Sep 16, 2024 |
| 40-49 | 41.2% | US adults aged 40-49, living in households; sometimes, usually or always feel lonely · United States · Aug 20-Sep 16, 2024 |
| 50-59 | 39.8% | US adults aged 50-59, living in households; sometimes, usually or always feel lonely · United States · Aug 20-Sep 16, 2024 |
| 60-69 | 31.8% | US adults aged 60-69, living in households; sometimes, usually or always feel lonely · United States · Aug 20-Sep 16, 2024 |
| 70-79 | 27.4% | US adults aged 70-79, living in households; sometimes, usually or always feel lonely · United States · Aug 20-Sep 16, 2024 |
| 80+ | 30.3% | US adults aged 80 and older, living in households; sometimes, usually or always feel lonely · United States · Aug 20-Sep 16, 2024 |
| Age | Under 3 times a week | Scope |
|---|---|---|
| 18-29 | 50.5% | US adults aged 18-29, living in households; talk on the telephone with family, friends or neighbors less than three times in a typical week · United States · Aug 20-Sep 16, 2024 |
| 30-39 | 50.7% | US adults aged 30-39, living in households; talk on the telephone with family, friends or neighbors less than three times in a typical week · United States · Aug 20-Sep 16, 2024 |
| 40-49 | 49.8% | US adults aged 40-49, living in households; talk on the telephone with family, friends or neighbors less than three times in a typical week · United States · Aug 20-Sep 16, 2024 |
| 50-59 | 46.2% | US adults aged 50-59, living in households; talk on the telephone with family, friends or neighbors less than three times in a typical week · United States · Aug 20-Sep 16, 2024 |
| 60-69 | 41.9% | US adults aged 60-69, living in households; talk on the telephone with family, friends or neighbors less than three times in a typical week · United States · Aug 20-Sep 16, 2024 |
| 70-79 | 37.3% | US adults aged 70-79, living in households; talk on the telephone with family, friends or neighbors less than three times in a typical week · United States · Aug 20-Sep 16, 2024 |
| 80+ | 33% | US adults aged 80 and older, living in households; talk on the telephone with family, friends or neighbors less than three times in a typical week · United States · Aug 20-Sep 16, 2024 |
| Age | Under 3 times a week | Scope |
|---|---|---|
| 18-29 | 80% | US adults aged 18-29, living in households; get together with friends or relatives less than three times in a typical week · United States · Aug 20-Sep 16, 2024 |
| 30-39 | 83% | US adults aged 30-39, living in households; get together with friends or relatives less than three times in a typical week · United States · Aug 20-Sep 16, 2024 |
| 40-49 | 80.9% | US adults aged 40-49, living in households; get together with friends or relatives less than three times in a typical week · United States · Aug 20-Sep 16, 2024 |
| 50-59 | 79.3% | US adults aged 50-59, living in households; get together with friends or relatives less than three times in a typical week · United States · Aug 20-Sep 16, 2024 |
| 60-69 | 73.8% | US adults aged 60-69, living in households; get together with friends or relatives less than three times in a typical week · United States · Aug 20-Sep 16, 2024 |
| 70-79 | 71.1% | US adults aged 70-79, living in households; get together with friends or relatives less than three times in a typical week · United States · Aug 20-Sep 16, 2024 |
| 80+ | 62.9% | US adults aged 80 and older, living in households; get together with friends or relatives less than three times in a typical week · United States · Aug 20-Sep 16, 2024 |
| Age | Always or usually | Scope |
|---|---|---|
| 18-34 | 12.9% | US adults aged 18-34; feel lonely always or usually; denominator excludes non-reporters · United States · September 9-October 12, 2026 |
| 35-49 | 6.4% | US adults aged 35-49; feel lonely always or usually; denominator excludes non-reporters · United States · September 9-October 12, 2026 |
| 50-64 | 4.1% | US adults aged 50-64; feel lonely always or usually; denominator excludes non-reporters · United States · September 9-October 12, 2026 |
| 65+ | 2.4% | US adults aged 65 and older; feel lonely always or usually; denominator excludes non-reporters · United States · September 9-October 12, 2026 |
The UK and Ireland

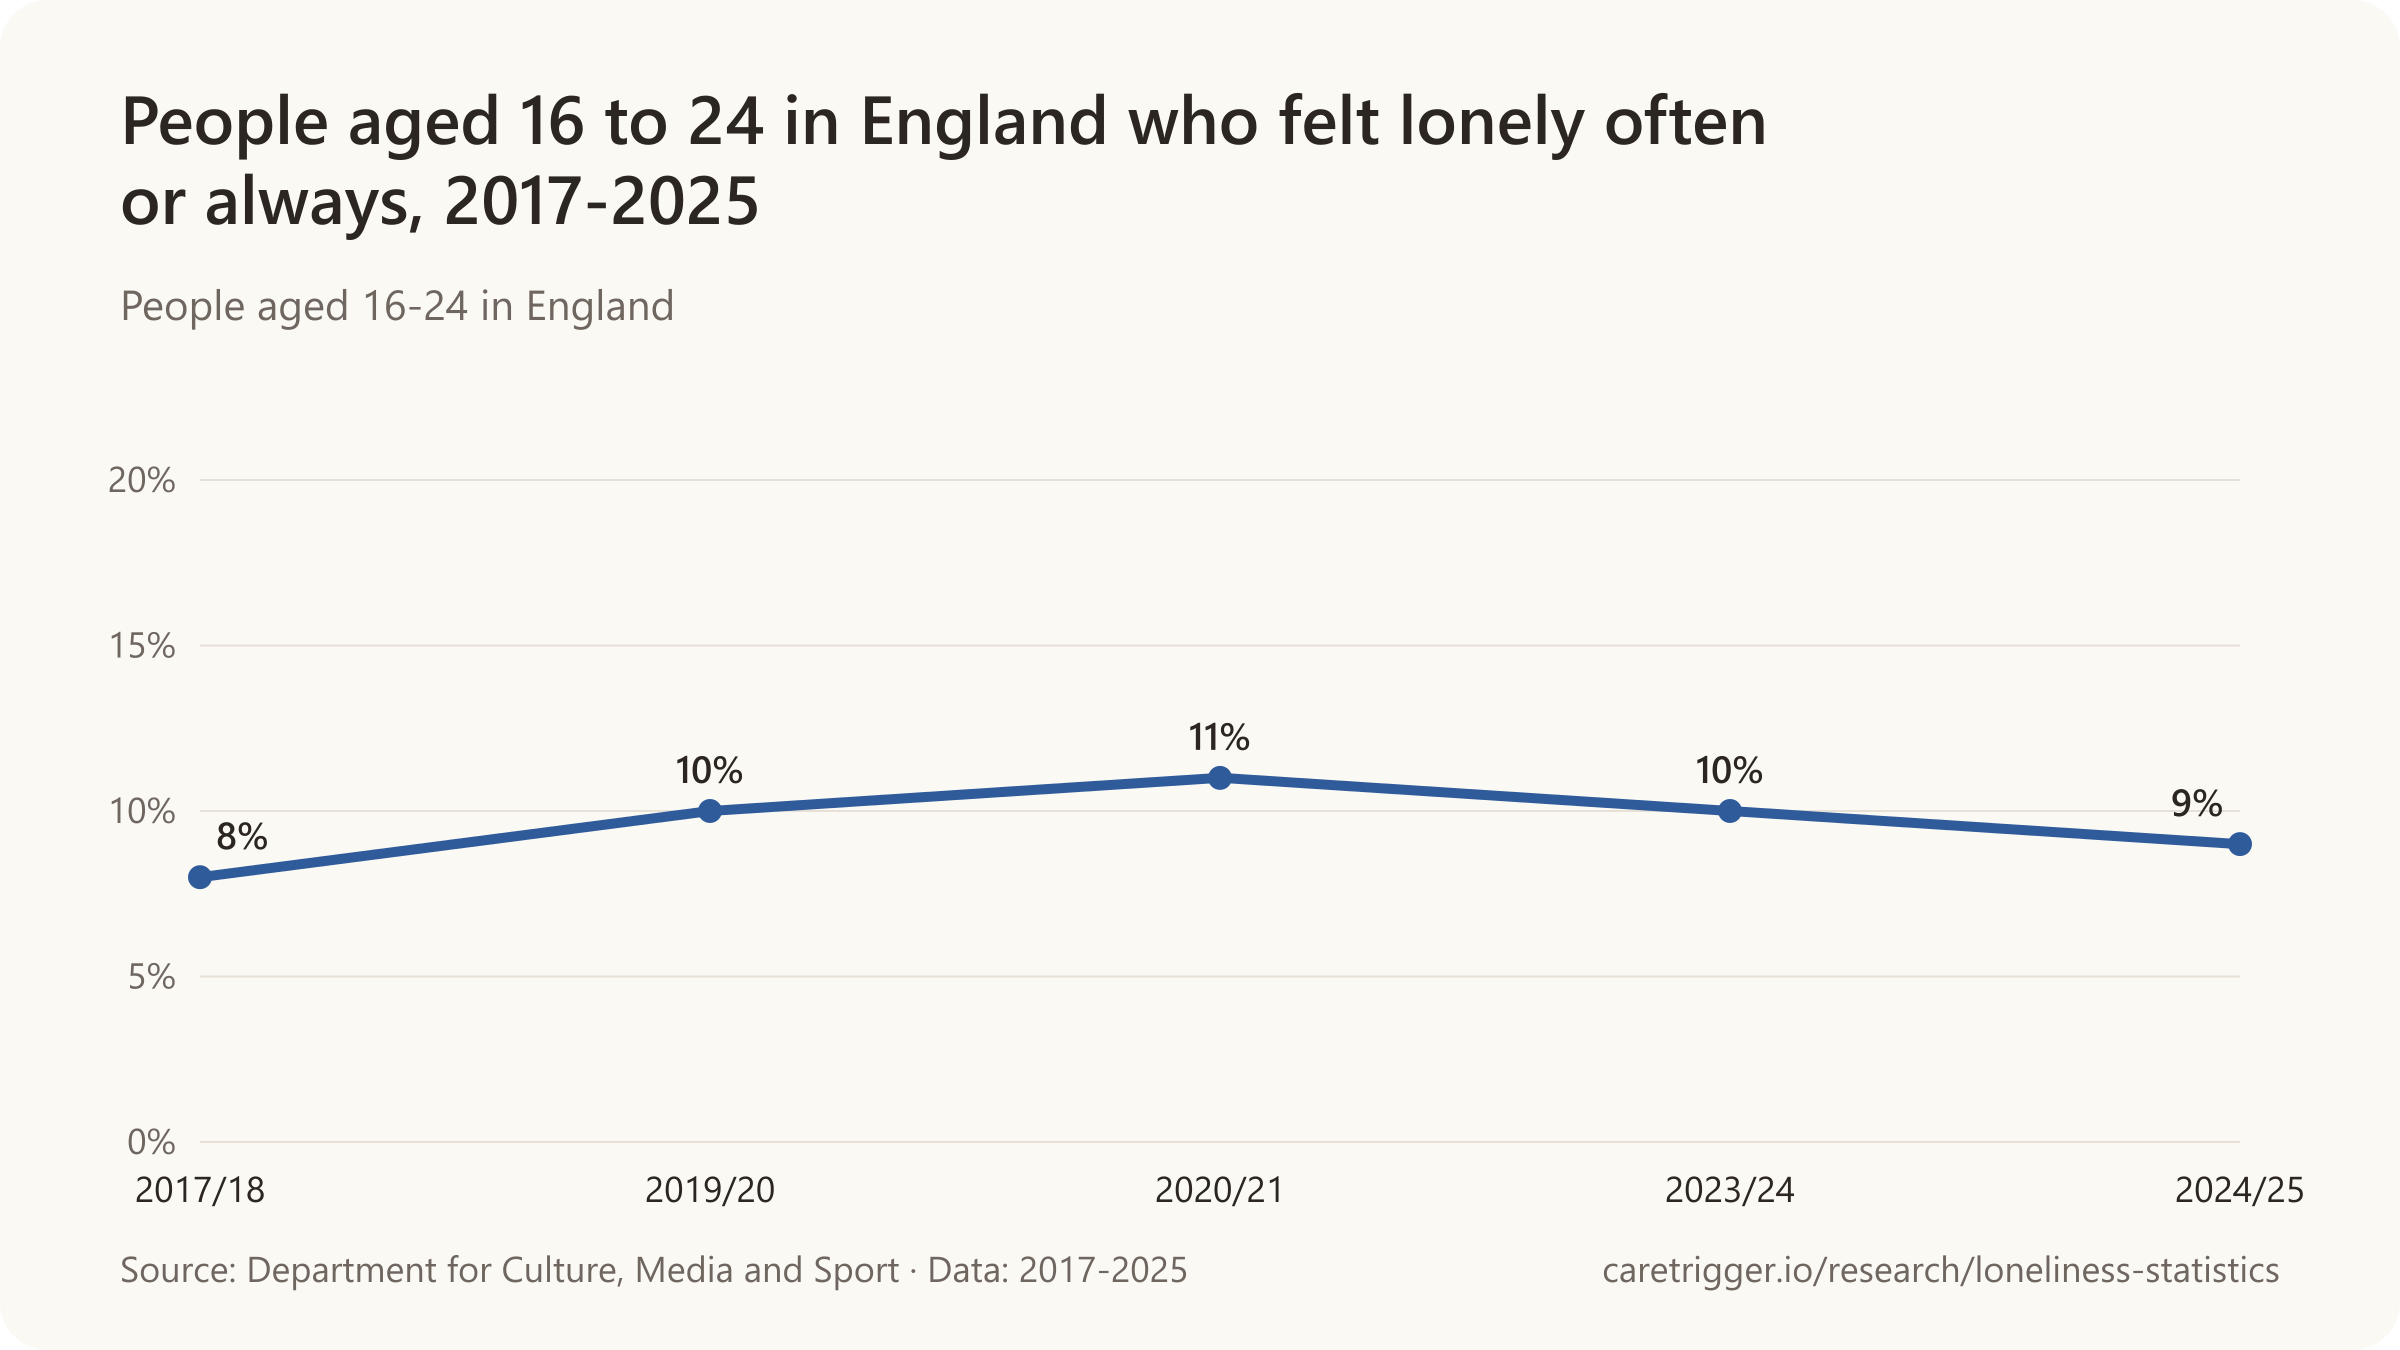
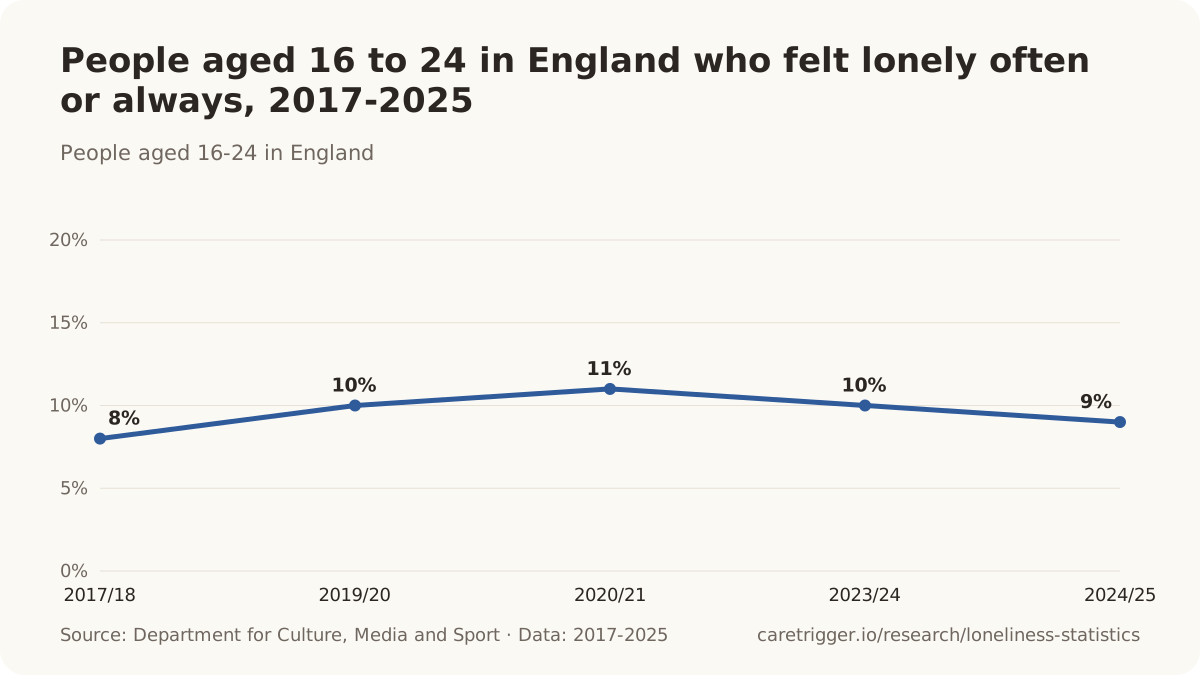
- 9% of people aged 16-24 in England felt lonely often or always in 2025/26, the highest of any age group (DCMS Community and Engagement Survey, 2026).
- 3 profiles of people at particular risk of loneliness were identified in England: widowed older homeowners living alone with long-term health conditions, unmarried middle-agers with long-term health conditions, and younger renters with little trust and sense of belonging to their area (ONS, 2018).
- 19% of adults aged 16 to 24 in Scotland felt lonely most or all of the time in the past week in 2023, against 5% to 6% of those aged 65 and over (Scottish Health Survey, 2024).
- 2 age groups, adults under 25 and over 65, reported the highest loneliness among UK adults aged 15 and over, a U-shaped pattern across the life course (Victor and Yang, Journal of Psychology, 2012).
- 46,054 people aged 16 to 99 in 237 countries and territories took part in the BBC Loneliness Experiment, a self-selected online survey, whose analysis found loneliness fell with age and was higher among men and in more individualistic cultures (Barreto et al., Personality and Individual Differences, 2021).
- 13% of young men aged 16 to 25 in the UK's Understanding Society study said they often felt lonely, while 2% of boys aged 10 to 15 said they felt lonely all the time (DCMS, 2026).
- 8% of boys and young men aged 11 to 25 in England said they felt lonely often or always in the NHS Mental Health of Children and Young People survey, and 45% felt lonely occasionally or some of the time (DCMS, 2026).
- 12% of young men aged 16 to 25 in Understanding Society said they often felt isolated from others, and a further 37% felt isolated some of the time (DCMS, 2026).
- About 1 in 3 young men aged 16 to 25 with mental distress said they often felt lonely, against 6% of those without, in Understanding Society (DCMS, 2026).
- 67 was the age at which loneliness was lowest among adults aged 50+ in Ireland: it fell from age 50 to 67 and rose in older age (TILDA, Trinity College Dublin, 2019).
| Age | Often or always | Scope |
|---|---|---|
| 16-24 | 9% | people aged 16-24 in England; direct question, often or always · England · October 2025 to March 2026 (survey year 2025/26) |
| 25-34 | 8% | people aged 25-34 in England; direct question, often or always · England · October 2025 to March 2026 (survey year 2025/26) |
| 35-49 | 7% | people aged 35-49 in England; direct question, often or always · England · October 2025 to March 2026 (survey year 2025/26) |
| 50-64 | 6% | people aged 50-64 in England; direct question, often or always · England · October 2025 to March 2026 (survey year 2025/26) |
| Age | Often or always | Scope |
|---|---|---|
| 16-29 | 9% | adults aged 16 to 29 in Great Britain; direct question, often or always · Great Britain · 2 to 27 September 2026 |
| 30-49 | 8% | adults aged 30 to 49 in Great Britain; direct question, often or always · Great Britain · 2 to 27 September 2026 |
| 50-69 | 7% | adults aged 50 to 69 in Great Britain; direct question, often or always · Great Britain · 2 to 27 September 2026 |
| 70+ | 3% | adults aged 70 and over in Great Britain; direct question, often or always · Great Britain · 2 to 27 September 2026 |
| Age | At least some of the time | Scope |
|---|---|---|
| 16-29 | 38% | adults aged 16 to 29 in Great Britain; direct question, often, always or some of the time · Great Britain · 2 to 27 September 2026 |
| 30-49 | 24% | adults aged 30 to 49 in Great Britain; direct question, often, always or some of the time · Great Britain · 2 to 27 September 2026 |
| 50-69 | 23% | adults aged 50 to 69 in Great Britain; direct question, often, always or some of the time · Great Britain · 2 to 27 September 2026 |
| 70+ | 17% | adults aged 70 and over in Great Britain; direct question, often, always or some of the time · Great Britain · 2 to 27 September 2026 |
| Age | Often or always | Scope |
|---|---|---|
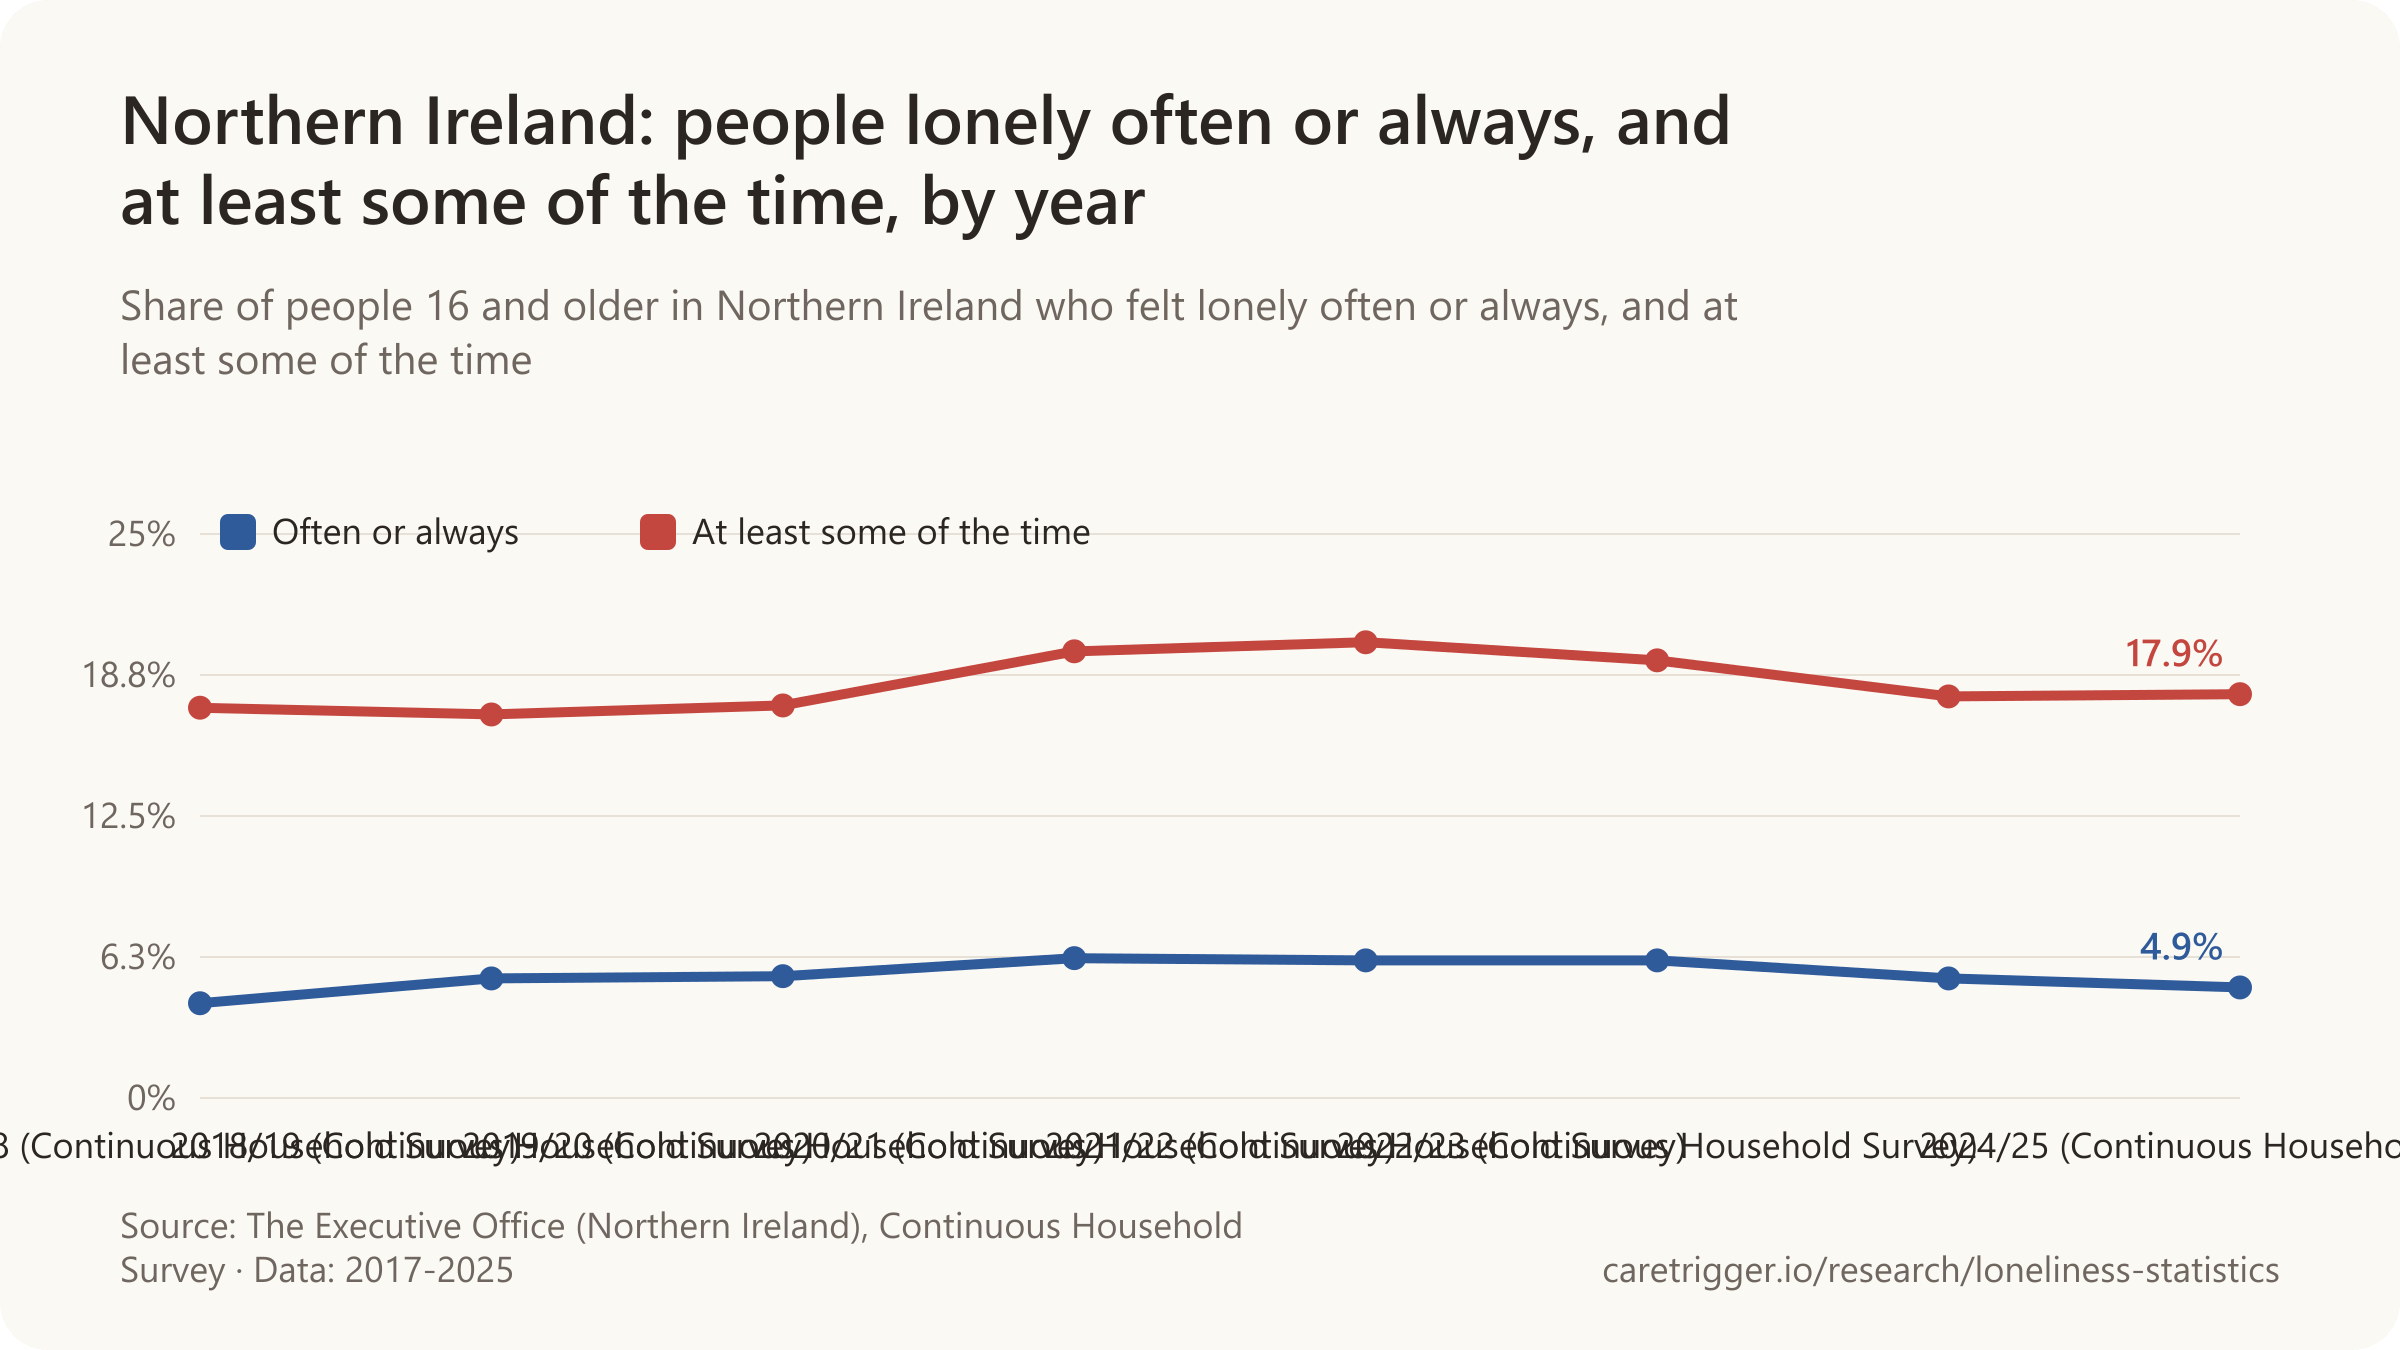
| 16-24 | 2.4% | people aged 16-24 in Northern Ireland; direct question, often/always · Northern Ireland · 2024/25 (Continuous Household Survey) |
| 25-34 | 4.9% | people aged 25-34 in Northern Ireland; direct question, often/always · Northern Ireland · 2024/25 (Continuous Household Survey) |
| 35-44 | 4.0% | people aged 35-44 in Northern Ireland; direct question, often/always · Northern Ireland · 2024/25 (Continuous Household Survey) |
| 45-54 | 4.8% | people aged 45-54 in Northern Ireland; direct question, often/always · Northern Ireland · 2024/25 (Continuous Household Survey) |
| 55-64 | 5.9% | people aged 55-64 in Northern Ireland; direct question, often/always · Northern Ireland · 2024/25 (Continuous Household Survey) |
| 65-74 | 5.0% | people aged 65-74 in Northern Ireland; direct question, often/always · Northern Ireland · 2024/25 (Continuous Household Survey) |
| 75+ | 7.5% | people aged 75 and over in Northern Ireland; direct question, often/always · Northern Ireland · 2024/25 (Continuous Household Survey) |
Europe
- 8.4% of people aged 65 and over in 23 European OECD countries felt lonely most or all of the time in 2022, making them the loneliest age group in EU-SILC (OECD, 2025).
- 4.9% of women aged 16 to 24 in European OECD countries felt lonely most or all of the time in 2022, against 3.8% of young men (OECD, 2025).
- 44.4% of women aged 16 to 24 in European OECD countries never felt lonely in the past four weeks in 2022, down from 59.5% in 2018, a 15-point drop (OECD, 2025).
- Over 19% of people aged 30 or younger in the EU felt lonely most or all of the time in 2022, against 12% of those aged 31 and over (European Commission Joint Research Centre, 2023).
- 53% of the loneliness interventions mapped across the EU target older adults, against 8% aimed at younger people (European Commission Joint Research Centre, 2023).
- Almost 4 times as many people aged 18 to 25 in the EU felt frequently lonely in the first months of the pandemic (April-July 2020) as in 2016 (European Commission Joint Research Centre, 2021).
- 7.5% of young adults aged 18 to 29 in eastern Europe experience problematic loneliness, against 2.9% in northern Europe, in a meta-analysis of single-item measures (Surkalim et al., BMJ, 2022).
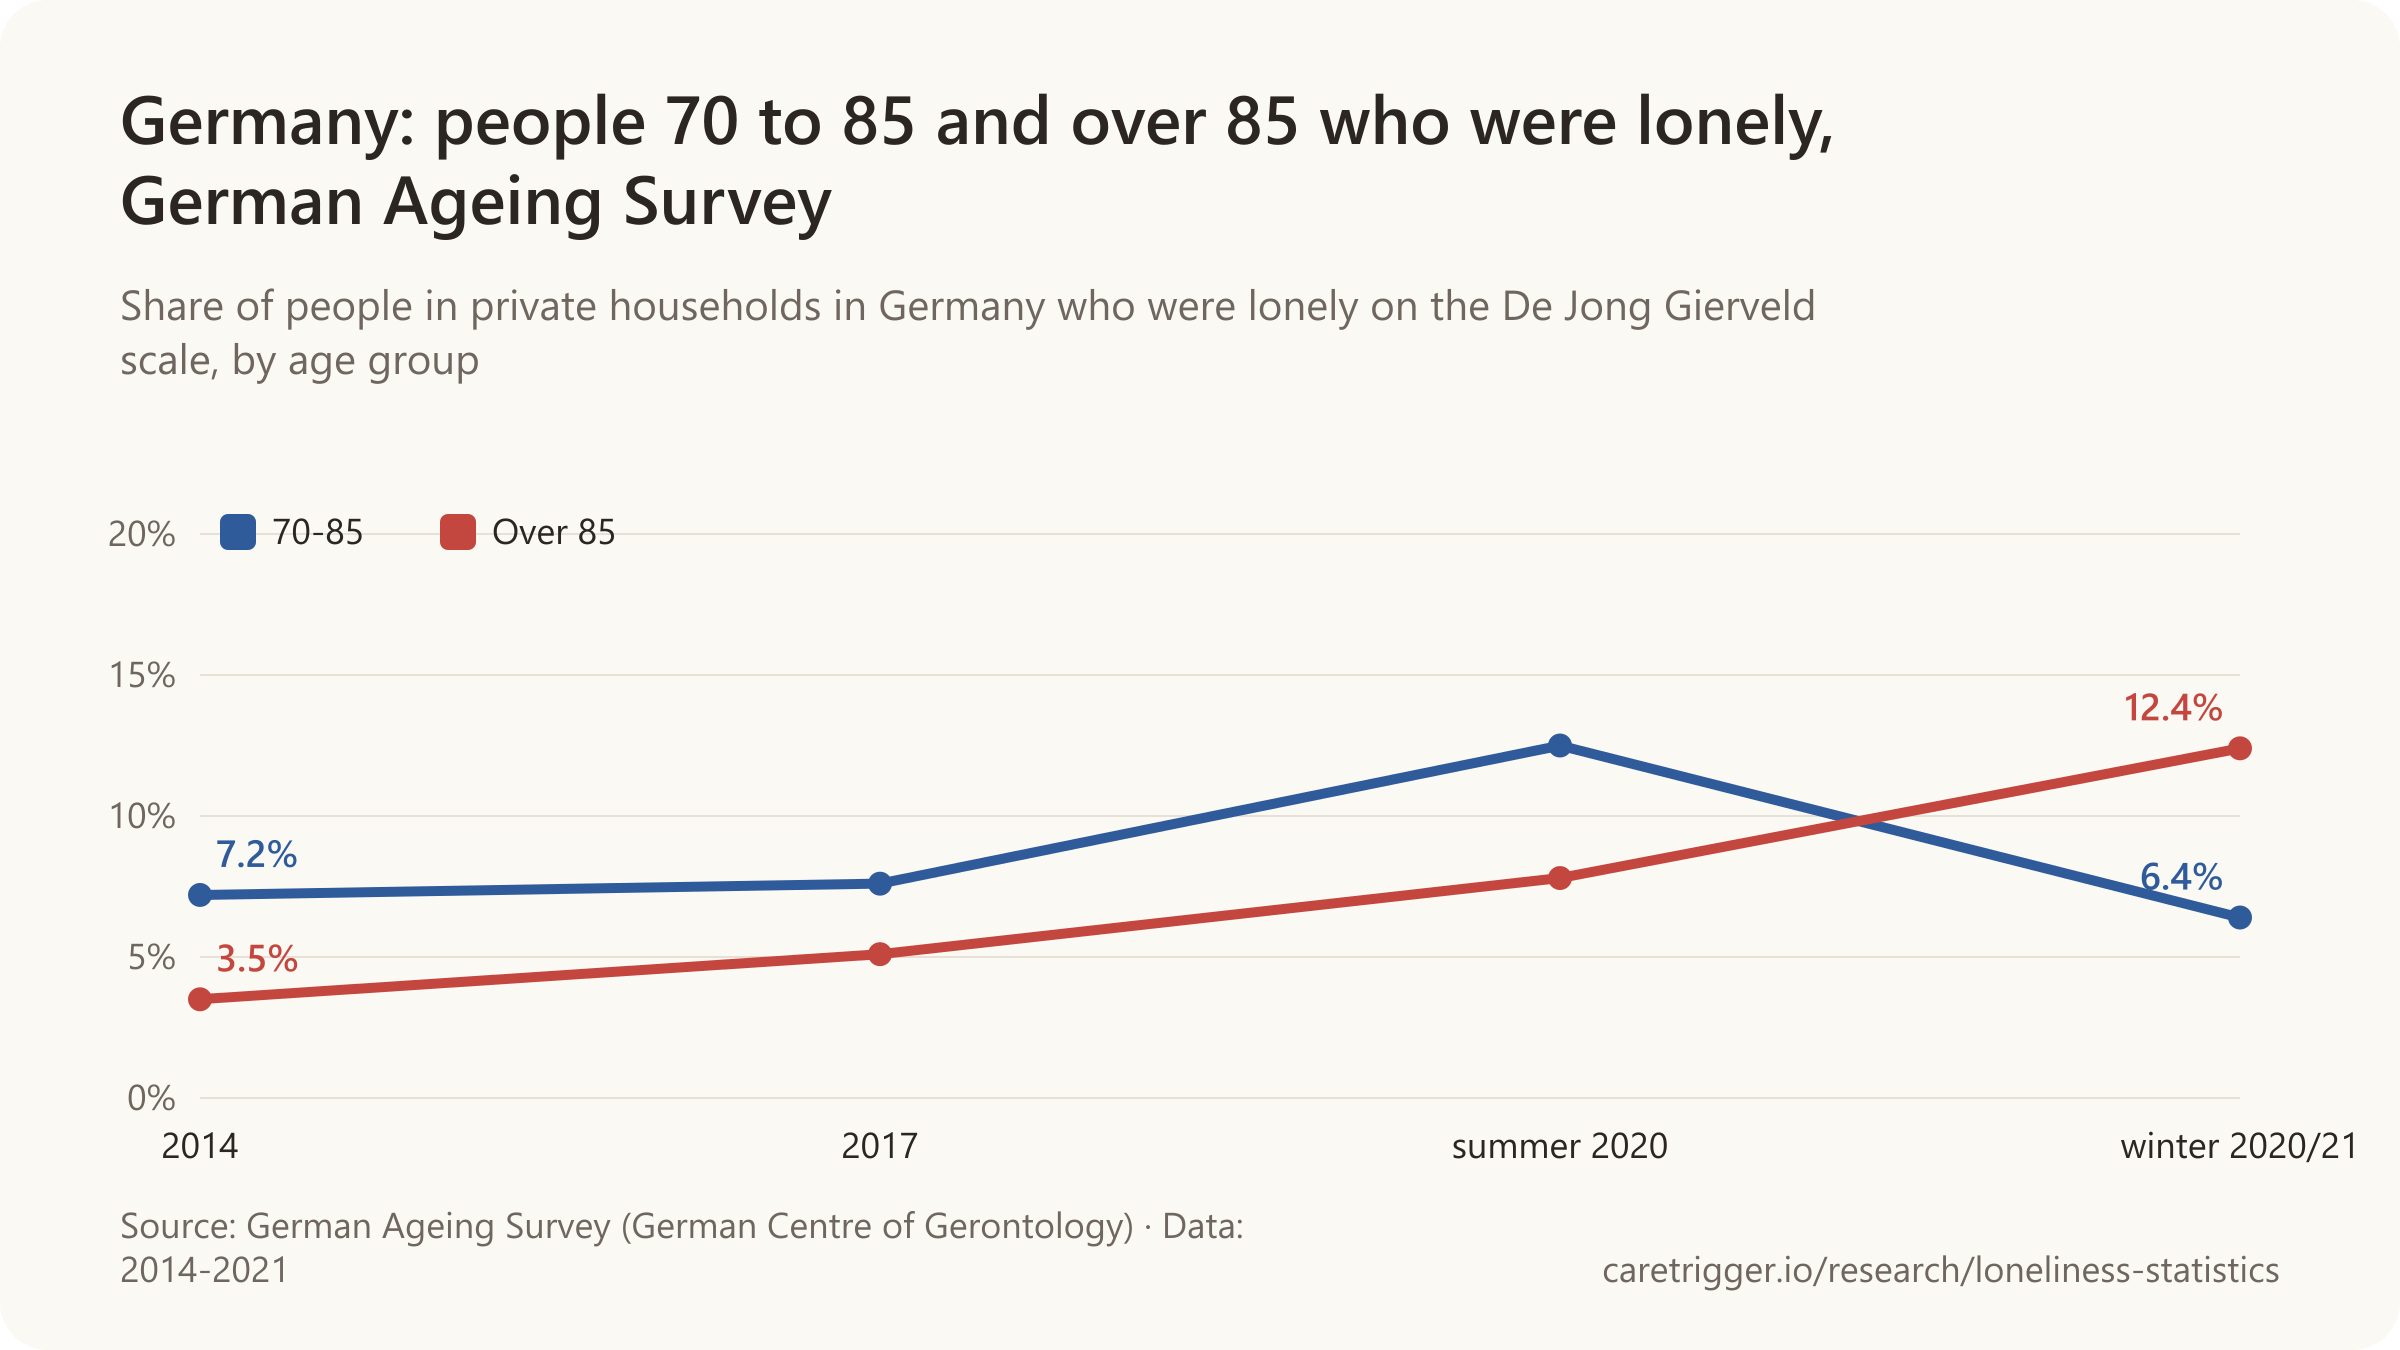
- 8.3% of people aged 50+ in Germany were lonely in 2020/21, with no differences by age group, gender or education, in the German Ageing Survey (Wurm et al., Robert Koch Institute Journal of Health Monitoring, 2023).
- 46% of young people aged 16-30 in Germany felt lonely in March 2024, 35% moderately and about 10% severely, in a foundation's representative survey (Bertelsmann Stiftung, 2024).
- 23.9% of women aged 16-24 in Denmark showed signs of loneliness in 2023, the highest of any age and gender group, against 14.0% of men the same age (Danish National Health Profile, 2024).
- 23% of adults aged 18-24 in Norway were quite or very much bothered by loneliness in 2026, down from just over 30% in 2021, the age group's lowest level since 2020 (Statistics Norway, Quality of Life Survey).
- 30% of people aged 55+ in Norway felt lonely at least a little of the time in the past four weeks in 2022, fewer than the 39% of people under 55 (Statistics Norway, 2024).
- 13.4% of people aged 15+ in Spain felt unwanted loneliness in the cost study's survey, with the youngest highest at 21.9% and a rise again to 12.2% at 75+ after a low at 65-74 (Observatorio Estatal de la Soledad No Deseada, cost study, 2023).
- 38.5% of people aged 75+ in Italy felt lonely at least part of the time in the past four weeks in 2021, the highest of any age group (ISTAT, BES 2022).
- 20.5% of people aged 16-34 in Italy felt lonely at least part of the time in the past four weeks in 2021, up from 11.7% in 2018 (ISTAT, BES 2022).
- 4.2% of people aged 15-24 in Switzerland felt lonely very or quite often in 2017, our sum of the Swiss Health Survey's two top categories (Swiss Federal Statistical Office).
- 10.1% of people aged 15-24 in Switzerland felt lonely very or quite often in 2022, our sum of the Swiss Health Survey's two top categories (Swiss Federal Statistical Office).
- 28% of people aged 18-74 in Austria, about 1.8 million, felt lonely at least sometimes in the past four weeks in the second quarter of 2025, and 8% always or mostly (Statistik Austria, 2025).
- 19% of people living alone in Austria felt lonely always or mostly in the past four weeks in the second quarter of 2025, against 8% of all people aged 18-74 and 12% of those aged 18-34 (Statistik Austria, 2025).
- 35% of people in Austria in households with severe material and social deprivation (7 or more of 13 items) felt lonely always or mostly in the second quarter of 2025, against 6% in less deprived households (Statistik Austria, 2025).
- 10% of people aged 18-74 in Austria felt lonely always or mostly in the first quarter of 2022, the peak of the series, against about 9% in late 2021 and about 8% from mid-2022 (Statistik Austria for the Social Affairs Ministry, 2025).
- 2% of Japan's population were estimated in 2022 to be hikikomori, people who withdraw from society for months or years, with young and retired men over-represented (OECD, 2025).
| Age | Most or all of the time | Scope |
|---|---|---|
| 16-24 | 4.6% | People aged 16 to 24 (EU-SILC 2022); felt lonely most or all of the time in the past 4 weeks · 23 European OECD countries (average) · 2022 |
| 25-49 | 4.6% | People aged 25 to 49 (EU-SILC 2022); felt lonely most or all of the time in the past 4 weeks · 23 European OECD countries (average) · 2022 |
| 50-64 | 5.7% | People aged 50 to 64 (EU-SILC 2022); felt lonely most or all of the time in the past 4 weeks · 23 European OECD countries (average) · 2022 |
| 65+ | 8.4% | People aged 65 and over (EU-SILC 2022); felt lonely most or all of the time in the past 4 weeks · 23 European OECD countries (average) · 2022 |
| Age | More than half of the time | Scope |
|---|---|---|
| 18-25 | 9% | Adults aged 18 to 25 (Eurofound EQLS 2016); lonely more than half of the time in the past two weeks · European Union (28) · 2016 |
| 26-45 | 10% | Adults aged 26 to 45 (Eurofound EQLS 2016); lonely more than half of the time in the past two weeks · European Union (28) · 2016 |
| 46-64 | 12% | Adults aged 46 to 64 (Eurofound EQLS 2016); lonely more than half of the time in the past two weeks · European Union (28) · 2016 |
| 65+ | 15% | Adults aged 65 and over (Eurofound EQLS 2016); lonely more than half of the time in the past two weeks · European Union (28) · 2016 |
| Age | At least sometimes | Scope |
|---|---|---|
| 16-24 | 30% | people aged 16-24 in metropolitan France; SRCV 2022 (French EU-SILC) direct question: felt lonely in the past four weeks 'tout le temps', 'la plupart du temps' or 'parfois'; people aged 16+ in ordinary housing · France (metropolitan) · 2022 |
| 25-39 | 32% | people aged 25-39 in metropolitan France; SRCV 2022 (French EU-SILC) direct question: felt lonely in the past four weeks 'tout le temps', 'la plupart du temps' or 'parfois'; people aged 16+ in ordinary housing · France (metropolitan) · 2022 |
| 40-49 | 34% | people aged 40-49 in metropolitan France; SRCV 2022 (French EU-SILC) direct question: felt lonely in the past four weeks 'tout le temps', 'la plupart du temps' or 'parfois'; people aged 16+ in ordinary housing · France (metropolitan) · 2022 |
| 50-64 | 33% | people aged 50-64 in metropolitan France; SRCV 2022 (French EU-SILC) direct question: felt lonely in the past four weeks 'tout le temps', 'la plupart du temps' or 'parfois'; people aged 16+ in ordinary housing · France (metropolitan) · 2022 |
| 65+ | 34% | people aged 65+ in metropolitan France; SRCV 2022 (French EU-SILC) direct question: felt lonely in the past four weeks 'tout le temps', 'la plupart du temps' or 'parfois'; people aged 16+ in ordinary housing · France (metropolitan) · 2022 |
| Age | Strongly lonely | Scope |
|---|---|---|
| 15-24 | 8.5% | people aged 15-24 in the Netherlands; CBS Sociale samenhang en welzijn survey; 6-item short De Jong Gierveld loneliness scale (yes / more or less / no); strongly lonely = score 5 or 6, somewhat lonely = 2 to 4 · Netherlands · 2025 |
| 25-34 | 10.8% | people aged 25-34 in the Netherlands; CBS Sociale samenhang en welzijn survey; 6-item short De Jong Gierveld loneliness scale (yes / more or less / no); strongly lonely = score 5 or 6, somewhat lonely = 2 to 4 · Netherlands · 2025 |
| 35-44 | 12.6% | people aged 35-44 in the Netherlands; CBS Sociale samenhang en welzijn survey; 6-item short De Jong Gierveld loneliness scale (yes / more or less / no); strongly lonely = score 5 or 6, somewhat lonely = 2 to 4 · Netherlands · 2025 |
| 45-54 | 12.1% | people aged 45-54 in the Netherlands; CBS Sociale samenhang en welzijn survey; 6-item short De Jong Gierveld loneliness scale (yes / more or less / no); strongly lonely = score 5 or 6, somewhat lonely = 2 to 4 · Netherlands · 2025 |
| 55-64 | 9.1% | people aged 55-64 in the Netherlands; CBS Sociale samenhang en welzijn survey; 6-item short De Jong Gierveld loneliness scale (yes / more or less / no); strongly lonely = score 5 or 6, somewhat lonely = 2 to 4 · Netherlands · 2025 |
| 65-74 | 9.3% | people aged 65-74 in the Netherlands; CBS Sociale samenhang en welzijn survey; 6-item short De Jong Gierveld loneliness scale (yes / more or less / no); strongly lonely = score 5 or 6, somewhat lonely = 2 to 4 · Netherlands · 2025 |
| 75+ | 7.6% | people aged 75+ in the Netherlands; CBS Sociale samenhang en welzijn survey; 6-item short De Jong Gierveld loneliness scale (yes / more or less / no); strongly lonely = score 5 or 6, somewhat lonely = 2 to 4 · Netherlands · 2025 |
| Age | Unwanted loneliness | Scope |
|---|---|---|
| 18+ | 20.0% | adults aged 18+, Spain; unwanted loneliness: answers 'often' or 'always' to 'how often do you feel lonely?' (defined as having fewer relationships than wished or relationships without the support wished), or scores 6-9 on a 3-item scale (lack companionship, feel excluded, feel isolated; almost never 1 to often 3) · Spain · 2024 |
| 18-24 | 34.6% | people aged 18-24, Spain; unwanted loneliness: answers 'often' or 'always' to 'how often do you feel lonely?' (defined as having fewer relationships than wished or relationships without the support wished), or scores 6-9 on a 3-item scale (lack companionship, feel excluded, feel isolated; almost never 1 to often 3) · Spain · 2024 |
| 25-34 | 27.1% | people aged 25-34, Spain; unwanted loneliness: answers 'often' or 'always' to 'how often do you feel lonely?' (defined as having fewer relationships than wished or relationships without the support wished), or scores 6-9 on a 3-item scale (lack companionship, feel excluded, feel isolated; almost never 1 to often 3) · Spain · 2024 |
| 35-44 | 20.8% | people aged 35-44, Spain; unwanted loneliness: answers 'often' or 'always' to 'how often do you feel lonely?' (defined as having fewer relationships than wished or relationships without the support wished), or scores 6-9 on a 3-item scale (lack companionship, feel excluded, feel isolated; almost never 1 to often 3) · Spain · 2024 |
| 45-54 | 17.8% | people aged 45-54, Spain; unwanted loneliness: answers 'often' or 'always' to 'how often do you feel lonely?' (defined as having fewer relationships than wished or relationships without the support wished), or scores 6-9 on a 3-item scale (lack companionship, feel excluded, feel isolated; almost never 1 to often 3) · Spain · 2024 |
| 55-64 | 14.8% | people aged 55-64, Spain; unwanted loneliness: answers 'often' or 'always' to 'how often do you feel lonely?' (defined as having fewer relationships than wished or relationships without the support wished), or scores 6-9 on a 3-item scale (lack companionship, feel excluded, feel isolated; almost never 1 to often 3) · Spain · 2024 |
| 65-74 | 14.5% | people aged 65-74, Spain; unwanted loneliness: answers 'often' or 'always' to 'how often do you feel lonely?' (defined as having fewer relationships than wished or relationships without the support wished), or scores 6-9 on a 3-item scale (lack companionship, feel excluded, feel isolated; almost never 1 to often 3) · Spain · 2024 |
| 75+ | 20.0% | people aged 75+, Spain; unwanted loneliness: answers 'often' or 'always' to 'how often do you feel lonely?' (defined as having fewer relationships than wished or relationships without the support wished), or scores 6-9 on a 3-item scale (lack companionship, feel excluded, feel isolated; almost never 1 to often 3) · Spain · 2024 |
Asia, the Americas and Australia

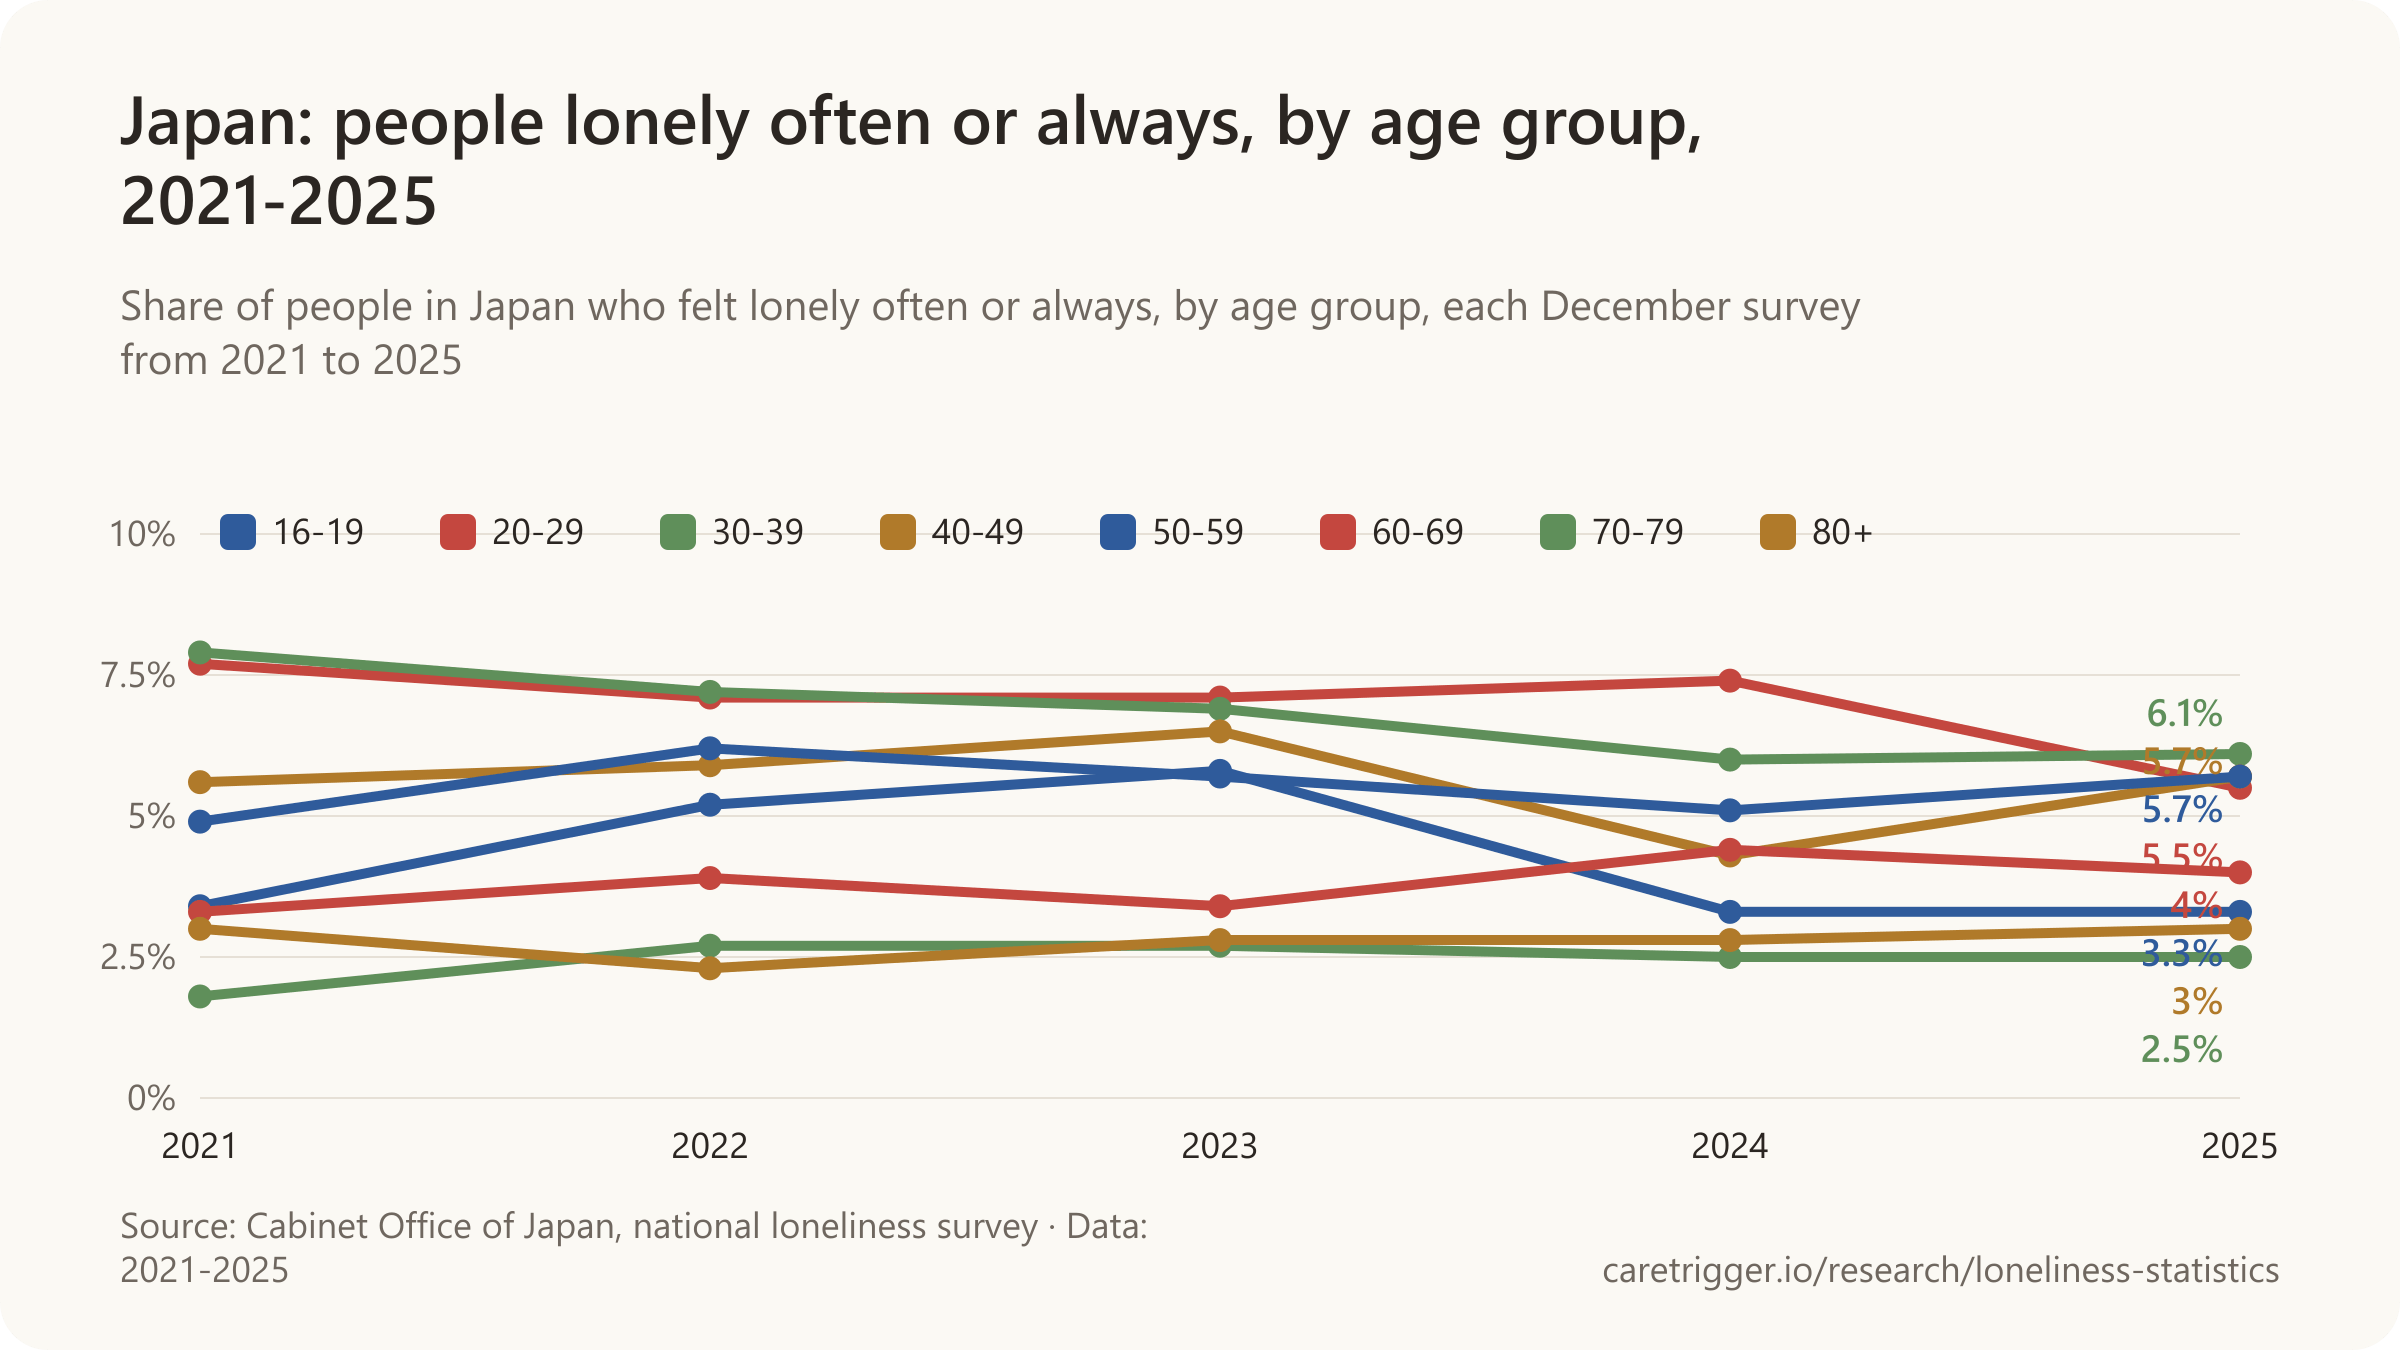
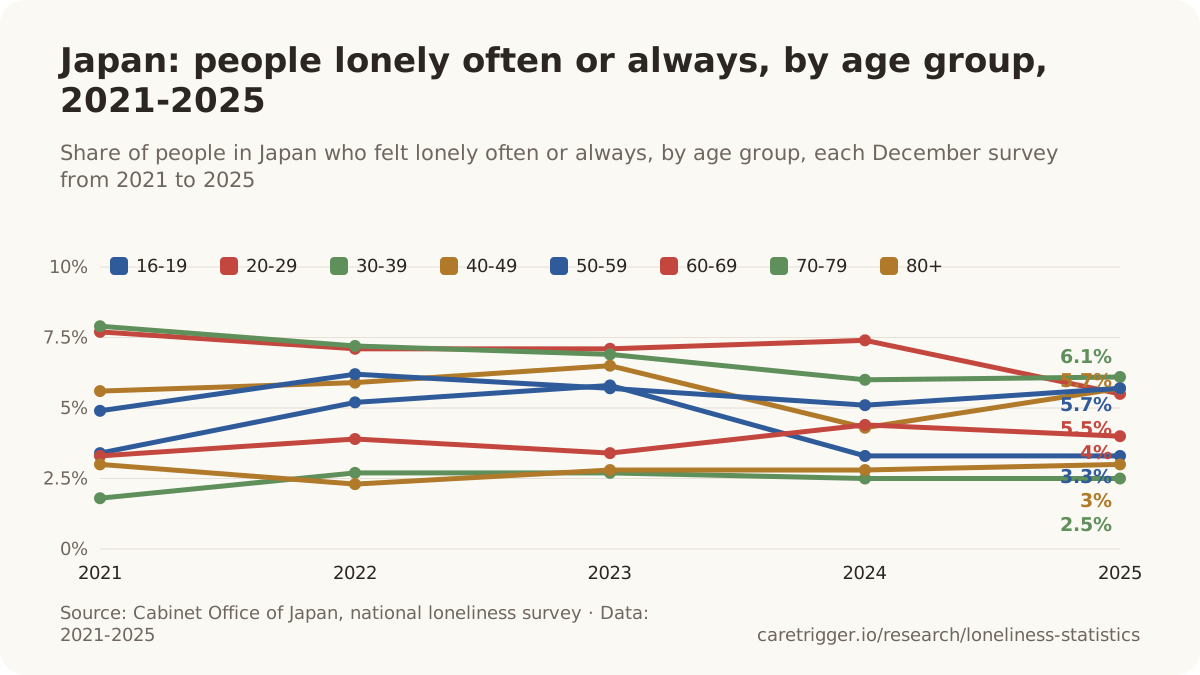
- 52.1% of South Korean people aged 80 and over feel lonely often or sometimes in daily life, the highest of any age group, and 10.1% often, in 2025 (Ministry of Data and Statistics, 2025 Social Survey).
- 10.7% of Australian men aged 15-24 agreed that they often feel very lonely in 2025, the lowest of any age and gender group, against 16.4% of all young people that age (Australian Bureau of Statistics, General Social Survey 2025).
- 29% of women aged 15-24 in Canada felt lonely always or often in August-September 2021, against 18% of men the same age (Statistics Canada, Canadian Social Survey, 2021).
- 19.0% of Canadians aged 65-74 were lonely in 2019-2020 on a 3-item loneliness scale (Statistics Canada, Health Reports, 2023).
- 18.3% of Canadians aged 75-84 were lonely in 2019-2020 on a 3-item loneliness scale (Statistics Canada, Health Reports, 2023).
- 22.7% of Canadians aged 85 and over were lonely in 2019-2020, significantly more than the 19.0% of those aged 65-74, on a 3-item loneliness scale (Statistics Canada, Health Reports, 2023).
- 32% of Australian adults were at least moderately lonely on the 4-item UCLA loneliness scale in 2023, and 17.5% severely lonely (Ending Loneliness Together, a charity's survey, 2023).
- 15% of Australian adults said they often or always feel lonely in 2023, on the single ONS question (Ending Loneliness Together, a charity's survey, 2023).
- 5% of Australians aged 75 and over said they often or always feel lonely in 2023, the lowest of any age group, against 22% of 18-24-year-olds (Ending Loneliness Together, a charity's survey, 2023).
- 11% of Australians aged 65-74 said they often or always feel lonely in 2023 (Ending Loneliness Together, a charity's survey, 2023).
- 22% of Australians aged 18-24 said they often or always feel lonely in 2023, the highest of any age group (Ending Loneliness Together, a charity's survey, 2023).
- 14.4% of adolescents aged 12-17 in the WHO Eastern Mediterranean region were lonely, the highest pooled regional rate, against 9.2% in South-East Asia, in a meta-analysis of 113 countries (Surkalim et al., BMJ, 2022).
- 9.2% of adolescents aged 12-17 in the WHO South-East Asia region were lonely, the lowest pooled regional rate, in a meta-analysis of 113 countries (Surkalim et al., BMJ, 2022).
- 46.8% of adults aged 18-24 in 8 countries had felt alone in the past 12 months, falling steadily with age to 30.4% of those 55 and over, in 2023-2024 (Abdalla et al., Social Psychiatry and Psychiatric Epidemiology, 2026).
- 21.2% of South Koreans aged 13 and over have no one to talk to when they feel down or depressed, up from 20.2% in 2023 (Ministry of Data and Statistics, 2025 Social Survey).
- 17.4% of Indians aged 80 and over felt alone often or most of the time in 2017-2018, against 12.2% of those aged 60-69 (Srivastava & Srivastava, Indian Journal of Psychiatry, 2023).
- 14.5% of Indians aged 70-79 felt alone often or most of the time in 2017-2018 (Srivastava & Srivastava, Indian Journal of Psychiatry, 2023).
- 12.2% of Indians aged 60-69 felt alone often or most of the time in 2017-2018 (Srivastava & Srivastava, Indian Journal of Psychiatry, 2023).
- 9.6% of Chileans aged 60 and over felt lonely always or almost always in the past four weeks in 2025; rates ranged only from 8.5% to 11.0% across age groups, with no significant differences (Ministry of Social Development and Family, Encuesta de Bienestar Social 2025).
| Age | Often feel very lonely | Scope |
|---|---|---|
| 15+ | 17.9% | People aged 15+ in Australia · Australia · 2025 |
| 15-24 | 16.4% | People aged 15-24 in Australia · Australia · 2025 |
| 25-34 | 17.8% | People aged 25-34 in Australia · Australia · 2025 |
| 35-44 | 19.3% | People aged 35-44 in Australia · Australia · 2025 |
| 45-54 | 18.1% | People aged 45-54 in Australia · Australia · 2025 |
| 55-64 | 19.7% | People aged 55-64 in Australia · Australia · 2025 |
| 65+ | 16.4% | People aged 65 and over in Australia · Australia · 2025 |
| Age | Always or often | Scope |
|---|---|---|
| 25-34 | 17.4% | People aged 25-34 in the 10 provinces · Canada (10 provinces) · October-December 2024 |
| 35-44 | 14.8% | People aged 35-44 in the 10 provinces · Canada (10 provinces) · October-December 2024 |
| 45-54 | 12.3% | People aged 45-54 in the 10 provinces · Canada (10 provinces) · October-December 2024 |
| 55-64 | 13.1% | People aged 55-64 in the 10 provinces · Canada (10 provinces) · October-December 2024 |
| 65-74 | 9.0% | People aged 65-74 in the 10 provinces · Canada (10 provinces) · October-December 2024 |
| 75+ | 9.5% | People aged 75+ in the 10 provinces · Canada (10 provinces) · October-December 2024 |
| Age | Often or sometimes | Scope |
|---|---|---|
| 13-19 | 30.3% | People aged 13-19 in South Korea · South Korea · May 2025 (fieldwork 14-29 May 2025) |
| 20-29 | 32.2% | People aged 20-29 in South Korea · South Korea · May 2025 (fieldwork 14-29 May 2025) |
| 30-39 | 33.8% | People aged 30-39 in South Korea · South Korea · May 2025 (fieldwork 14-29 May 2025) |
| 40-49 | 38.8% | People aged 40-49 in South Korea · South Korea · May 2025 (fieldwork 14-29 May 2025) |
| 50-59 | 41.7% | People aged 50-59 in South Korea · South Korea · May 2025 (fieldwork 14-29 May 2025) |
| 60-69 | 39.5% | People aged 60-69 in South Korea · South Korea · May 2025 (fieldwork 14-29 May 2025) |
| 70-79 | 41.7% | People aged 70-79 in South Korea · South Korea · May 2025 (fieldwork 14-29 May 2025) |
| 80+ | 52.1% | People aged 80+ in South Korea · South Korea · May 2025 (fieldwork 14-29 May 2025) |
| Age | Socially isolated | Scope |
|---|---|---|
| 19-29 | 24.4% | Adults aged 19-29 in South Korea · South Korea · 2025 |
| 30-39 | 26.5% | Adults aged 30-39 in South Korea · South Korea · 2025 |
| 40-49 | 29.5% | Adults aged 40-49 in South Korea · South Korea · 2025 |
| 50-59 | 37.2% | Adults aged 50-59 in South Korea · South Korea · 2025 |
Sources: World Health Organization (2025); National Center for Health Statistics; Gallup (2023, 2025); National Center for Health Statistics and U.S. Census Bureau; AARP Research (2018, 2025); AARP; CDC, Morbidity and Mortality Weekly Report; Making Caring Common, Harvard Graduate School of Education (2021, 2024); The Cigna Group, Evernorth Research Institute; PLOS ONE; medRxiv; Pew Research Center; U.S. Census Bureau; Department for Digital, Culture, Media and Sport (2019, 2020, 2021); Department for Culture, Media and Sport (2025, 2026); Department for Culture, Media and Sport and Ministry of Housing, Communities and Local Government; Office for National Statistics (2018, 2026); Scottish Government; The Journal of Psychology; Personality and Individual Differences; The Irish Longitudinal Study on Ageing, Trinity College Dublin; The Executive Office, Programme for Government Analytics; OECD (2025); European Commission, Joint Research Centre (2021, 2023, 2025); The BMJ; Robert Koch Institute, Journal of Health Monitoring; Bertelsmann Stiftung; National Institute of Public Health, University of Southern Denmark, for the Danish Health Authority; Statistics Norway (2024, 2026); Observatorio Estatal de la Soledad No Deseada, study promoted by Fundación ONCE with Nextdoor; ISTAT; Swiss Federal Statistical Office, Swiss Health Survey; Statistik Austria; Federal Ministry of Labour, Social Affairs, Health, Care and Consumer Protection; INSEE; Statistics Netherlands; Observatorio Estatal de la Soledad No Deseada: Fundación ONCE and Fundación AXA, fieldwork by Fresno Consulting; Cabinet Office of Japan (2025, 2026); Cabinet Office, Government of Japan; Ministry of Data and Statistics; Australian Bureau of Statistics; Statistics Canada (2021, 2023, 2025); Ending Loneliness Together, with the University of Sydney; Social Psychiatry and Psychiatric Epidemiology; Indian Journal of Psychiatry; Ministry of Social Development and Family, Chile; Ministry of Data and Statistics, South Korea
04 / Gender
Are men lonelier than women? The "male loneliness epidemic" in numbers
15% of US men and 15% of US women feel lonely or isolated all or most of the time (Pew Research Center, 2024).

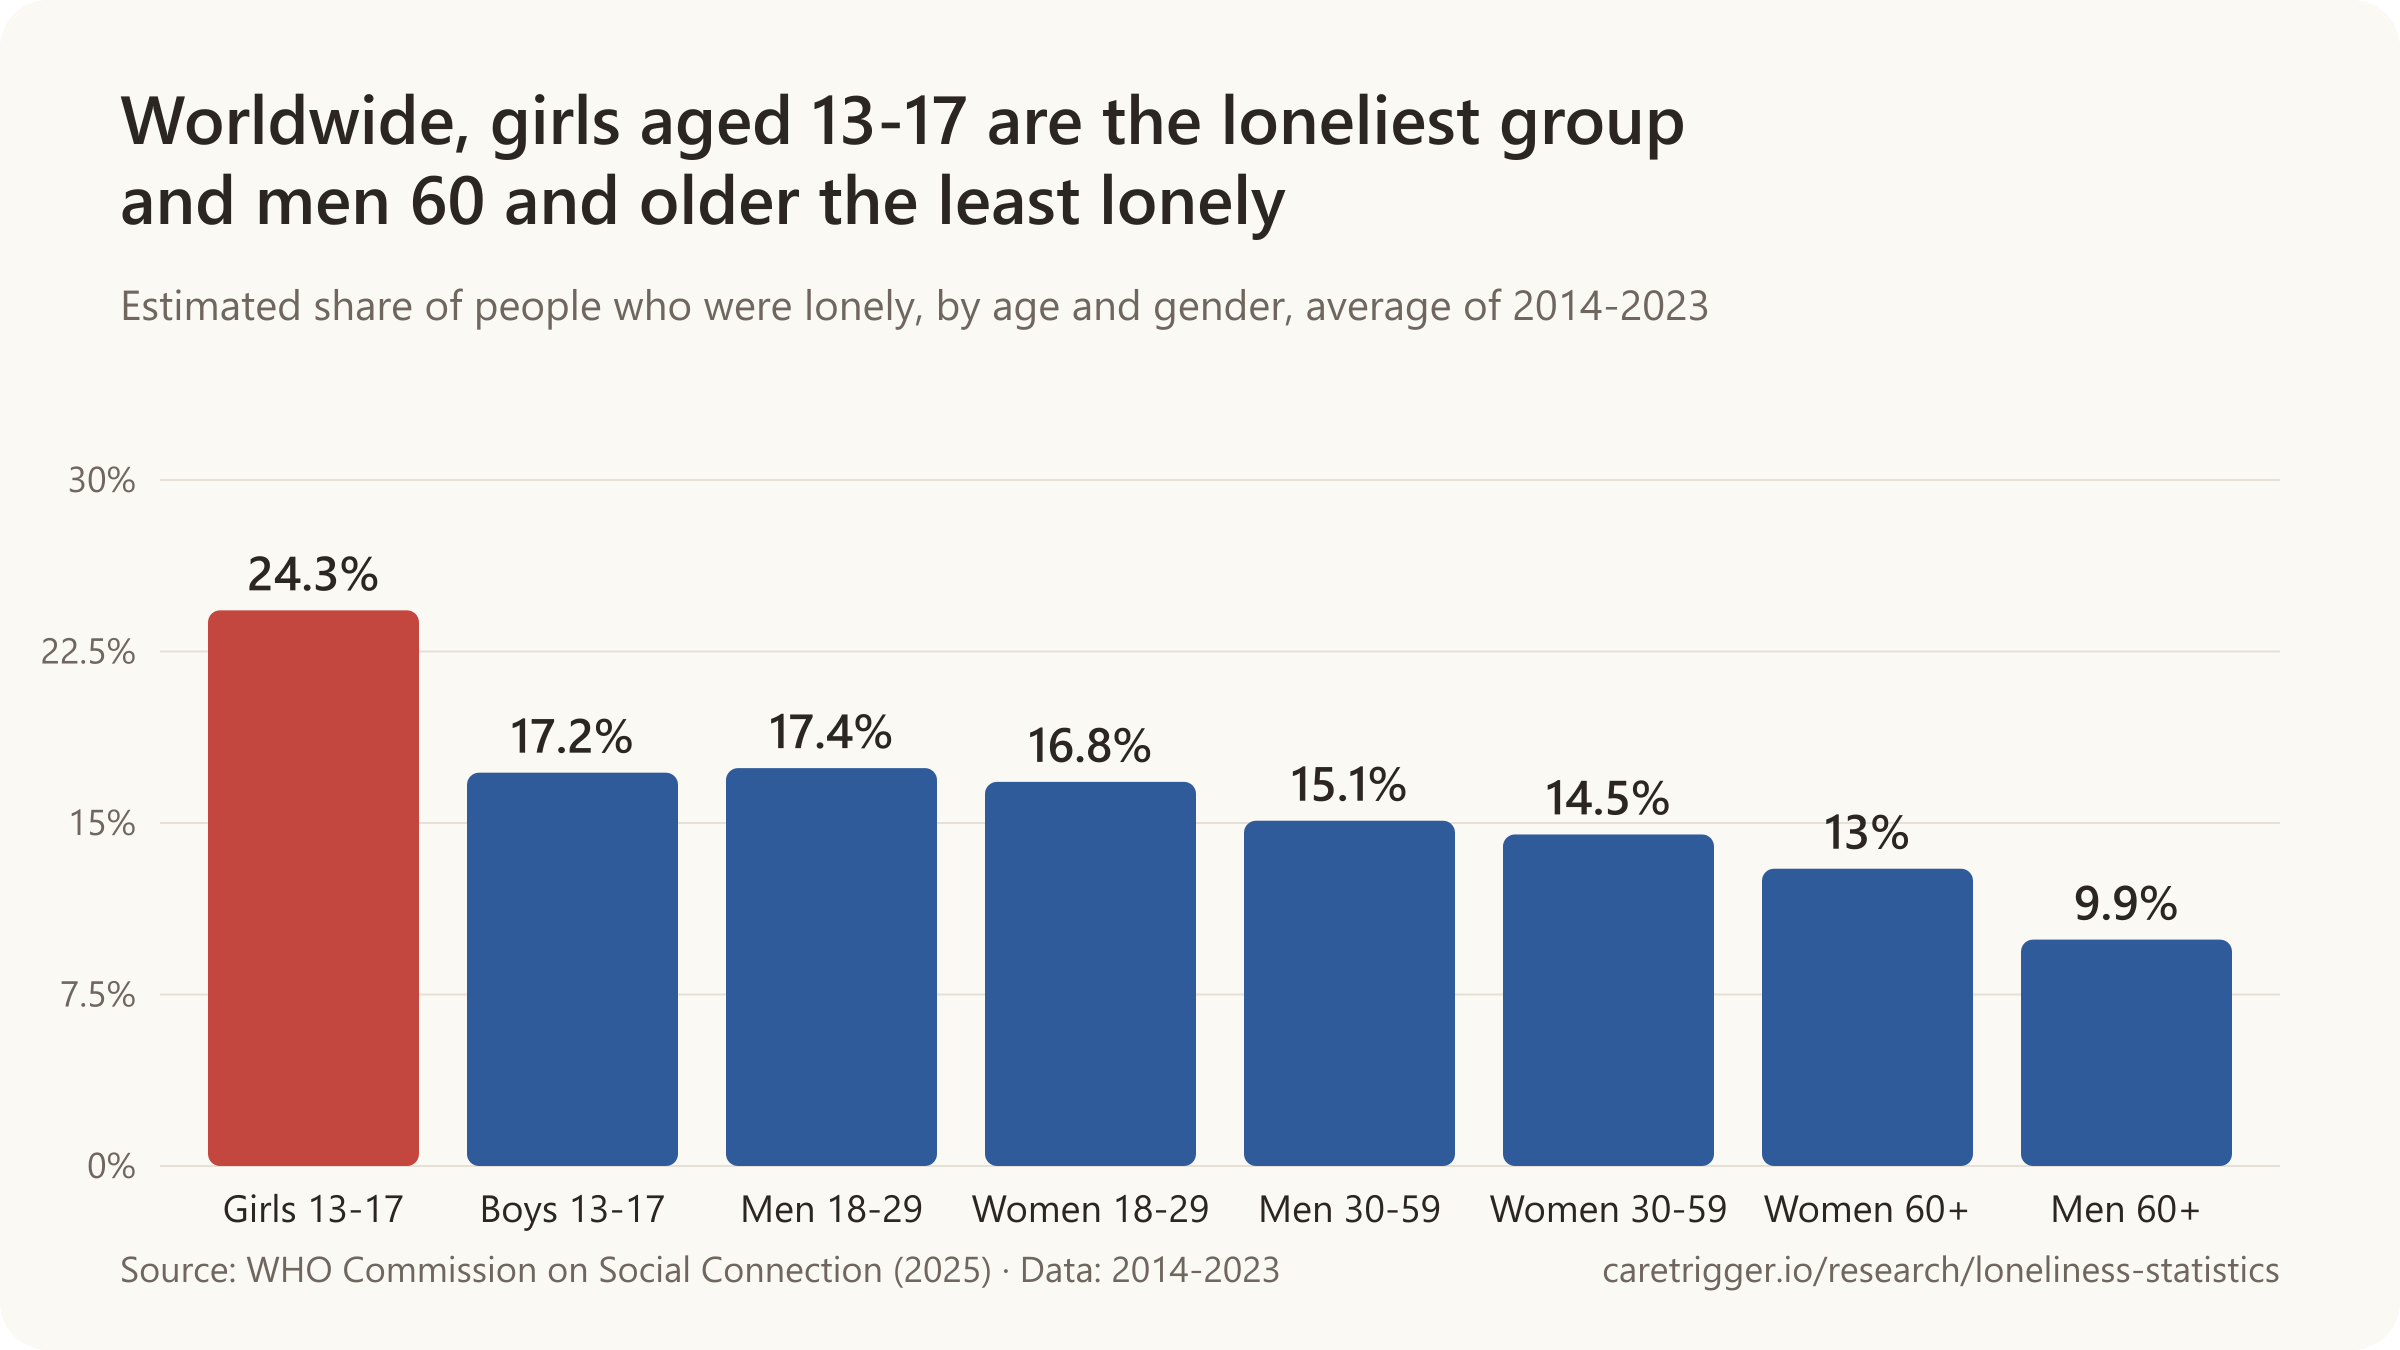
- 25% of US men aged 15 to 34 felt lonely a lot of the previous day, against an OECD median of 15% (2023-2024).
- 42% of US men 45 and older were lonely in 2025, against 37% of women, a gap that did not exist in 2018 (AARP).
- Worldwide, 16.1% of women and girls were lonely against 15.4% of men and boys, a very slight difference (WHO, 2014-2023).
- In later life the gap turns around: 23.0% of Canadian women 65 and older were lonely, against 14.6% of men (2019-2020).
- After a spouse dies, older Australian men's likelihood of feeling very lonely rose about 155%, women's about 68% (2022).
Overall, women and men report loneliness at about the same rate. Young American men stand out against young men elsewhere, and men in midlife are lonelier than women in AARP's survey; among the oldest, more women are lonely, partly because more of them are widowed and live alone.
Sources: Pew Research Center; World Health Organization; Gallup; AARP Research; Statistics Canada; Journals of Gerontology: Series B
More statistics (77)
15% of US men and 15% of US women said they feel lonely or isolated all or most of the time in September 2024, our sum of the topline categories (Pew Research Center, 2025).
- 25% of US men aged 15-34 said they felt lonely a lot of the previous day in 2023-2024, against 18% of all US adults and 18% of young US women (Gallup World Poll, Gallup, 2025).
- 42% of US men aged 45 and older were lonely on the UCLA Loneliness Scale in 2025, against 37% of women, a gap that did not exist in 2018 (AARP Research, 2025).
- 16.1% of women and girls aged 13 and over worldwide were lonely, against 15.4% of men and boys, a very slight difference once uncertainty is taken into account, on average in 2014-2023 (WHO Commission on Social Connection, 2025).
- 24% of men and 24% of women in 142 countries felt very or fairly lonely, but women were lonelier than men in 79 countries and men lonelier in 63 (Meta-Gallup Global State of Social Connections, a Gallup survey for Meta, 2023).
- 17 percentage points separated men (37% lonely) and women (20%) in Kuwait, the largest gender gap in loneliness of the 142 countries surveyed (Meta-Gallup Global State of Social Connections, a Gallup survey for Meta, 2023).
- 15.4% of men and boys aged 13 and over worldwide were lonely (95% uncertainty interval 11.8-20.7%), on average in 2014-2023 (WHO Commission on Social Connection, 2025).
- 20.6% of US men felt loneliness a lot of the day yesterday in the second quarter of 2025, up from 16.1% in the first quarter of 2023 (Gallup Panel, Gallup, 2025).
- 20.7% of US women felt loneliness a lot of the day yesterday in the second quarter of 2025, up from 18.0% in the first quarter of 2023 (Gallup Panel, Gallup, 2025).
- 28.8% of US adults aged 18-29 felt loneliness a lot of the day yesterday in the second quarter of 2025, up from 24.4% in the first quarter of 2023 (Gallup Panel, Gallup, 2025).
- 25.4% of US adults aged 30-44 felt loneliness a lot of the day yesterday in the second quarter of 2025, up from 19.7% in the first quarter of 2023 (Gallup Panel, Gallup, 2025).
- 19.1% of US adults aged 45-64 felt loneliness a lot of the day yesterday in the second quarter of 2025, up from 14.4% in the first quarter of 2023 (Gallup Panel, Gallup, 2025).
- 15.0% of US adults aged 65 and older felt loneliness a lot of the day yesterday in the second quarter of 2025, up from 13.1% in the first quarter of 2023 (Gallup Panel, Gallup, 2025).
- 20.9% of US adults felt loneliness a lot of the day yesterday in the second quarter of 2025, up from 17.1% in the first quarter of 2023 (Gallup Panel, Gallup, 2025).
- 15% of men aged 15-34 felt lonely a lot of the previous day across OECD countries in 2023-2024 (median), against 25% in the US (Gallup World Poll, Gallup, 2025).
- 20% of US women aged 35-54 felt lonely a lot of the previous day in 2023-2024, against an OECD median of 14% for that group (Gallup World Poll, Gallup, 2025).
- 15% of US men aged 35-54 felt lonely a lot of the previous day in 2023-2024, against an OECD median of 15% for that group (Gallup World Poll, Gallup, 2025).
- 16% of US men aged 55 and older felt lonely a lot of the previous day in 2023-2024, against an OECD median of 16% for that group (Gallup World Poll, Gallup, 2025).
- 17% of US women aged 55 and older felt lonely a lot of the previous day in 2023-2024, against an OECD median of 19% for that group (Gallup World Poll, Gallup, 2025).
| Country | Lonely | Scope |
|---|---|---|
| Türkiye | 29% | Men aged 15-34 in Türkiye · Türkiye · 2023-2024 (pooled) |
| France | 24% | Men aged 15-34 in France · France · 2023-2024 (pooled) |
| Ireland | 23% | Men aged 15-34 in Ireland · Ireland · 2023-2024 (pooled) |
| Canada | 22% | Men aged 15-34 in Canada · Canada · 2023-2024 (pooled) |
| Slovakia | 4% | Men aged 15-34 in Slovakia · Slovakia · 2023-2024 (pooled) |
United States
- 5.6% of US men said they always or usually feel lonely in September 9-October 12, 2026, our calculation from Census Bureau tables (Household Trends and Outlook Pulse Survey, Census Bureau, 2026).
- 7.8% of US women said they always or usually feel lonely in September 9-October 12, 2026, our calculation from Census Bureau tables (Household Trends and Outlook Pulse Survey, Census Bureau, 2026).
- 20% of US men and 21% of US women said they felt lonely frequently or almost all of the time in the past 30 days in May 2024 (Making Caring Common, Harvard, 2024).
- 15% of US men said they have no close friends in May 2021, against 3% in 1990 (Survey Center on American Life, 2021).
- 27% of US men said they have at least six close friends in May 2021, half the 55% recorded in 1990 (Survey Center on American Life, 2021).
- 18% of US adults said they have no close friends outside their family in September 2024, including 20% of men and 17% of women (Pew Research Center, 2025).
| Group | Felt isolated | Scope |
|---|---|---|
| Bisexual adults | 56.7% | bisexual adults in 26 US states; felt socially isolated from others always, usually or sometimes · United States (26 states) · 2022 |
| Lesbian adults | 44.8% | lesbian adults in 26 US states; felt socially isolated from others always, usually or sometimes · United States (26 states) · 2022 |
| Gay adults | 41.2% | gay adults in 26 US states; felt socially isolated from others always, usually or sometimes · United States (26 states) · 2022 |
| Straight adults | 30.3% | straight adults in 26 US states; felt socially isolated from others always, usually or sometimes · United States (26 states) · 2022 |
| Group | Felt isolated | Scope |
|---|---|---|
| Transgender men | 62.6% | transgender men in 26 US states; felt socially isolated from others always, usually or sometimes · United States (26 states) · 2022 |
| Transgender women | 56.4% | transgender women in 26 US states; felt socially isolated from others always, usually or sometimes · United States (26 states) · 2022 |
| Transgender gender-nonconforming adults | 63.9% | transgender gender-nonconforming adults in 26 US states; felt socially isolated from others always, usually or sometimes · United States (26 states) · 2022 |
| Cisgender adults | 32.1% | cisgender adults in 26 US states; felt socially isolated from others always, usually or sometimes · United States (26 states) · 2022 |
| Group | Lacked companionship | Scope |
|---|---|---|
| US women aged 50-80 | 36.2% | community-dwelling US adults aged 50-80 by gender (survey records sex) · United States · March 2024 |
| US adults aged 65-80 | 27.6% | community-dwelling US adults aged 65-80 vs 50-64 · United States · March 2024 |
| US adults aged 50-80 not working or receiving disability benefits | 51.9% | community-dwelling US adults aged 50-80 not working or receiving disability · United States · March 2024 |
| US adults aged 50-80 with household incomes under $60,000 | 38.1% | community-dwelling US adults aged 50-80 by annual household income · United States · March 2024 |
| US adults aged 50-80 who rated their mental health fair or poor | 75.1% | community-dwelling US adults aged 50-80 by self-rated mental health · United States · March 2024 |
Women and men by country
- 5.2% of men in 22 European OECD countries felt lonely most or all of the time in the past four weeks in 2022, up from 4.7% in 2018, a larger rise than for women, whose rate did not change significantly (OECD, 2025).
- 6.6% of women and 5.3% of men felt lonely most or all of the time in the past four weeks on average across 25 OECD countries in 2022-2023 (OECD analysis of EU-SILC and national surveys, 2025).
Later life and widowhood

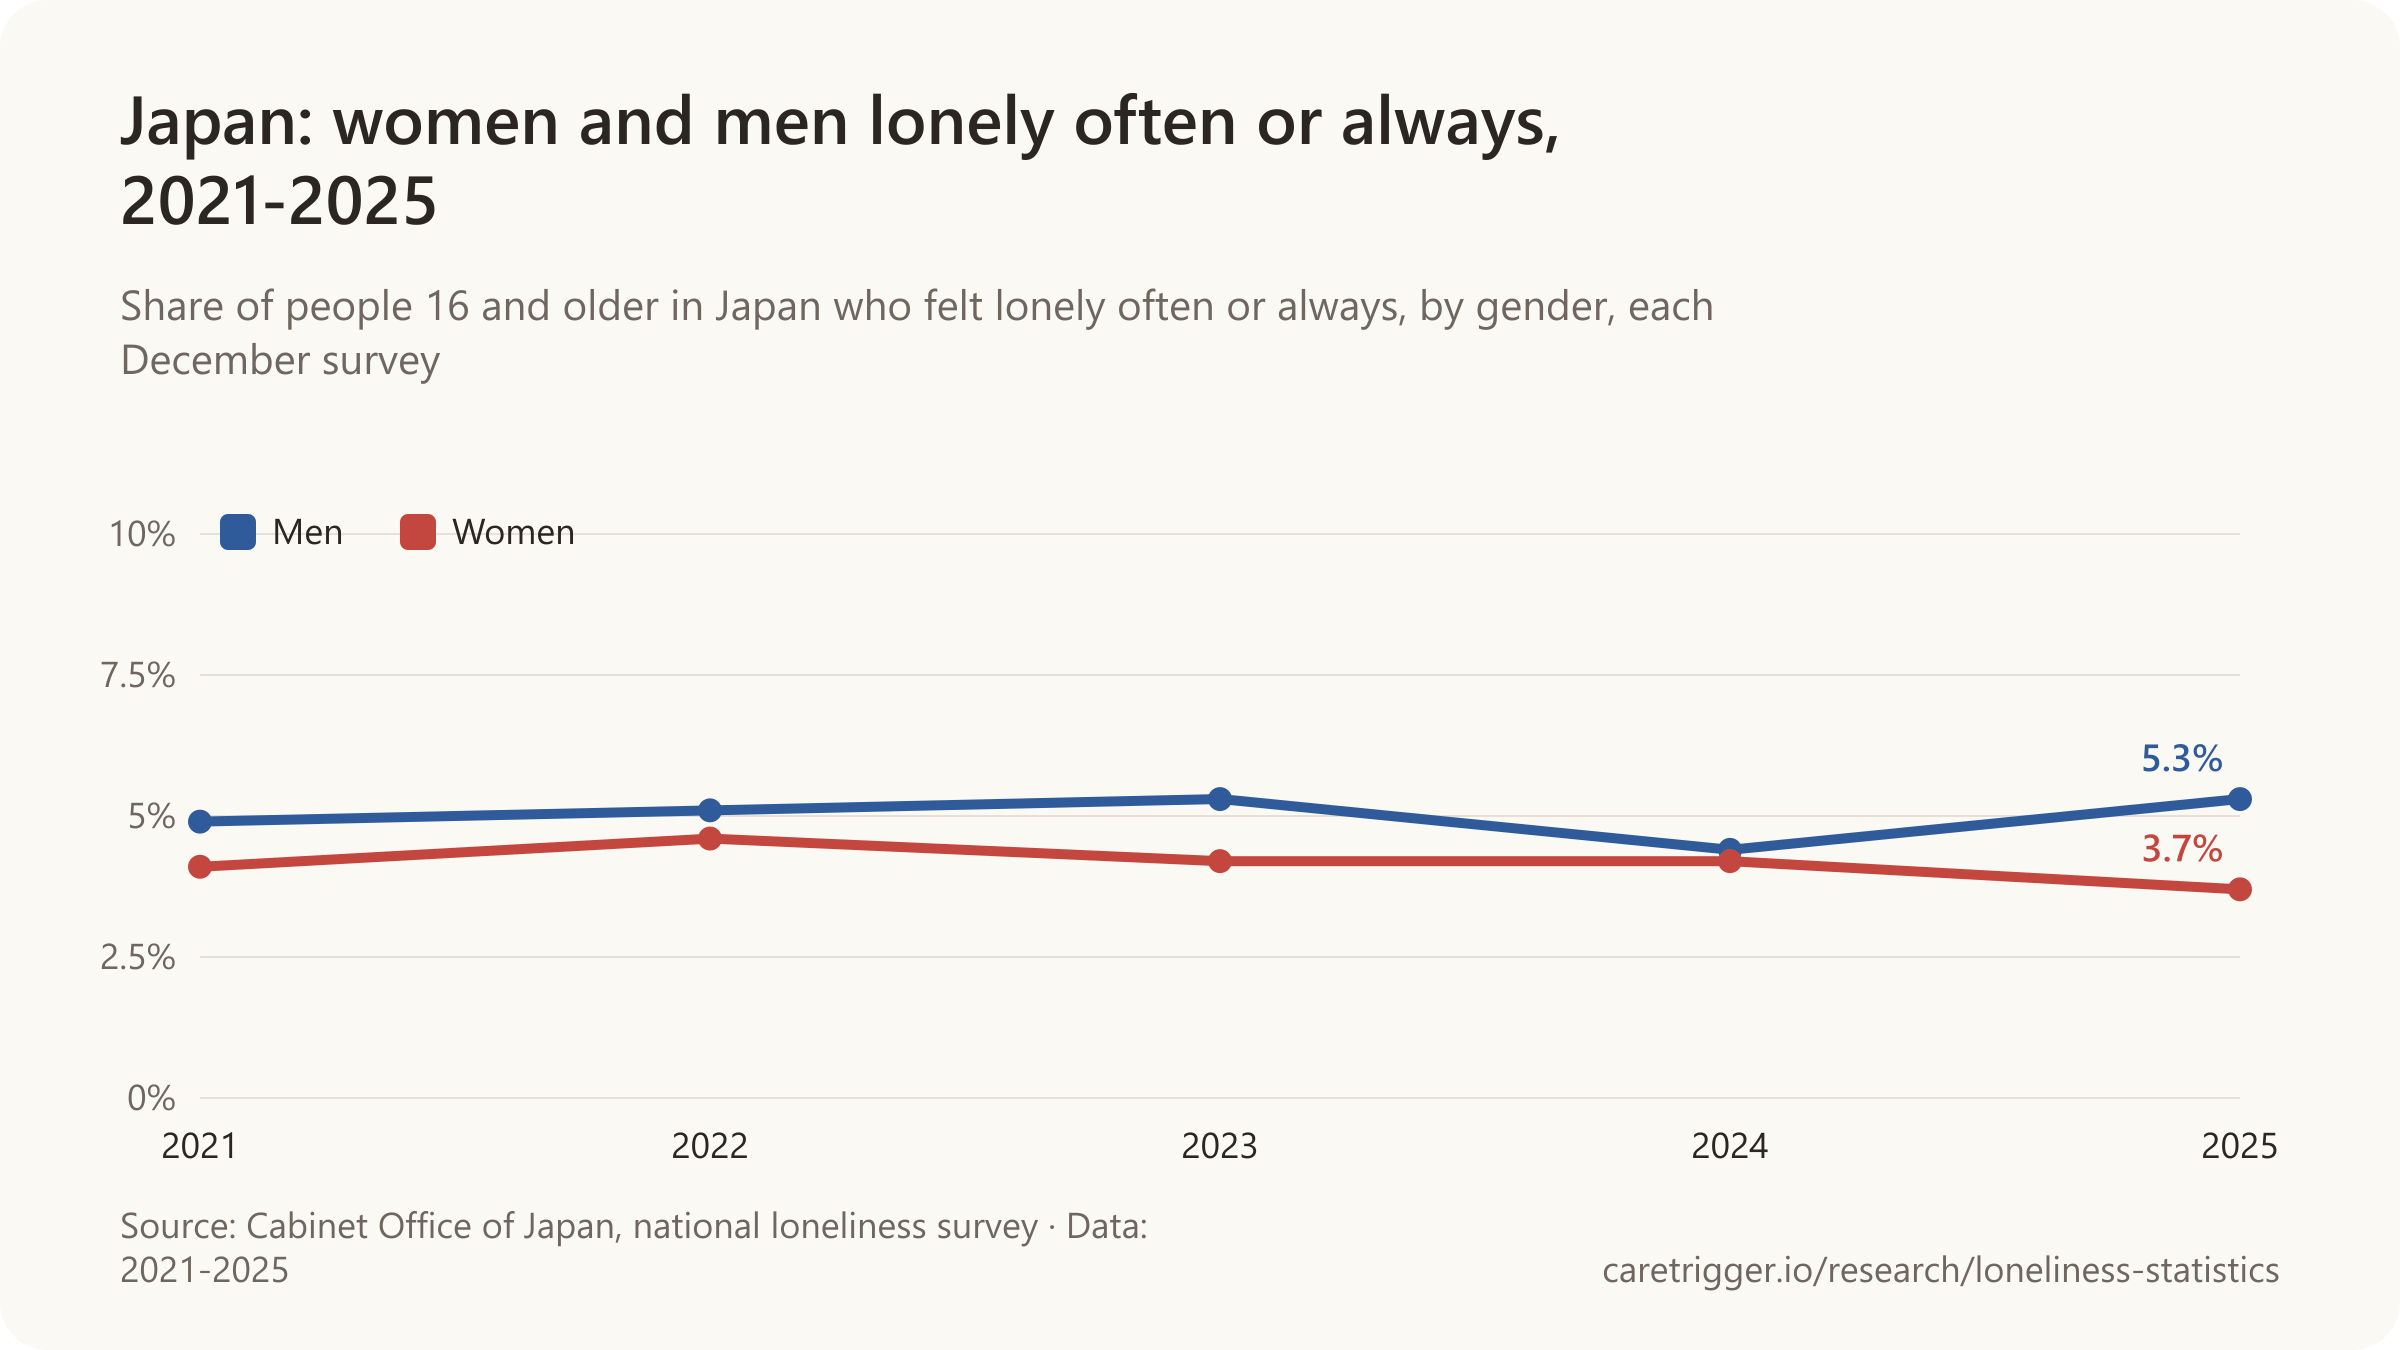
- 23.0% of women aged 65 and over in Canada were lonely in 2019-2020, against 14.6% of men, on a 3-item loneliness scale (Statistics Canada, Health Reports, 2023).
- 155% higher likelihood of feeling very lonely followed widowhood for older Australian men, against about 68% for women, in fixed-effects models that followed the same people before and after their spouse's death (Freak-Poli et al., Journals of Gerontology: Series B, 2022).
- 8% of men in Great Britain felt lonely often or always in September 2026, against 6% of women, a difference within the survey's margin of error (ONS Opinions and Lifestyle Survey, 2026).
- 15.0% of women aged 80+ in Germany felt lonely most or all of the time in the past week in 2020-21, twice the 7.4% of men, a gap the report attributes mainly to fewer women having a partner (D80+ study, ceres and German Centre of Gerontology, 2022).
- 16.1% of LGBTIQ* adults in Germany had elevated loneliness in 2021, against 10.7% of cisgender heterosexual adults, by the three-item UCLA Loneliness Scale in the Socio-Economic Panel (BMBFSFJ, Einsamkeitsbarometer 2025).
- 14.0% of women aged 15 and over in Canada felt lonely always or often in October-December 2024, against 12.9% of men (Statistics Canada, Canadian Social Survey).
- 12.9% of men aged 15 and over in Canada felt lonely always or often in October-December 2024, against 14.0% of women (Statistics Canada, Canadian Social Survey).
- 14.6% of men aged 65 and over in Canada were lonely in 2019-2020 on a 3-item loneliness scale (Statistics Canada, Health Reports, 2023).
- 26.8% of Canadian women aged 65 and over were lonely during the COVID-19 pandemic, up from 20.7% before restrictions, on a 3-item loneliness scale (Statistics Canada, Health Reports, 2023).
- 41.0% of South Korean women aged 13 and over feel lonely often or sometimes in daily life, against 35.4% of men, in 2025 (Ministry of Data and Statistics, 2025 Social Survey).
- 35.4% of South Korean men aged 13 and over feel lonely often or sometimes in daily life in 2025 (Ministry of Data and Statistics, 2025 Social Survey).
- 45% lower likelihood of social isolation (meeting non-household family or friends less than weekly) followed widowhood for older Australian women, and 31% lower for men, even as their loneliness rose (Freak-Poli et al., Journals of Gerontology: Series B, 2022).
More charts

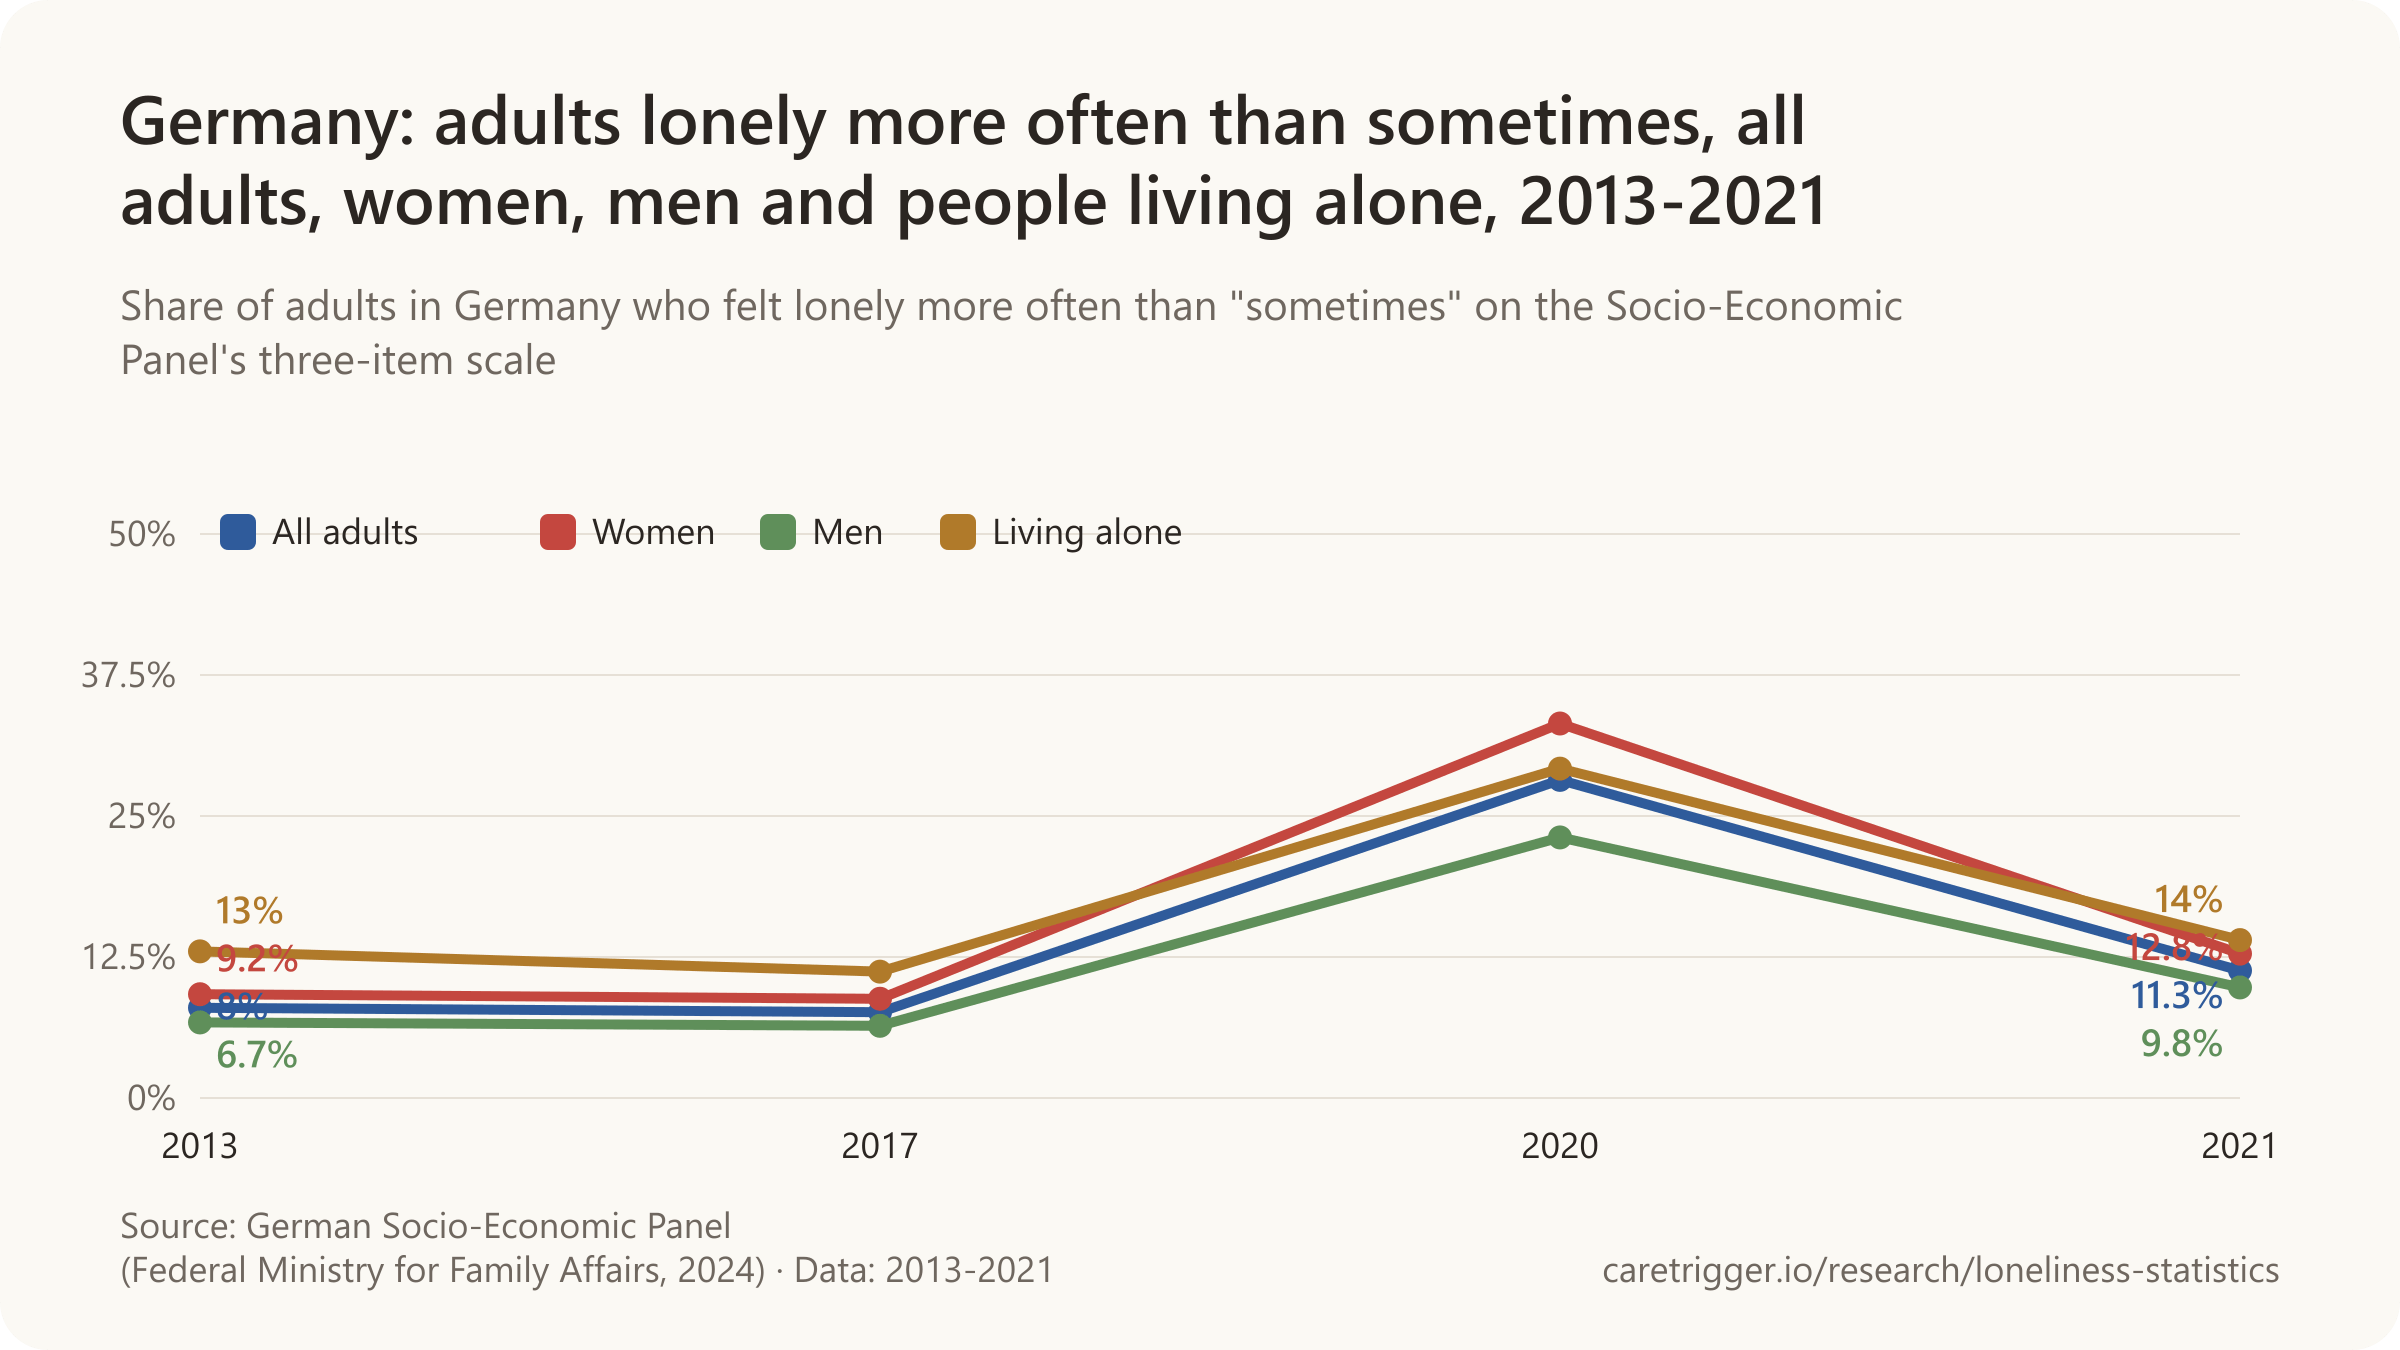
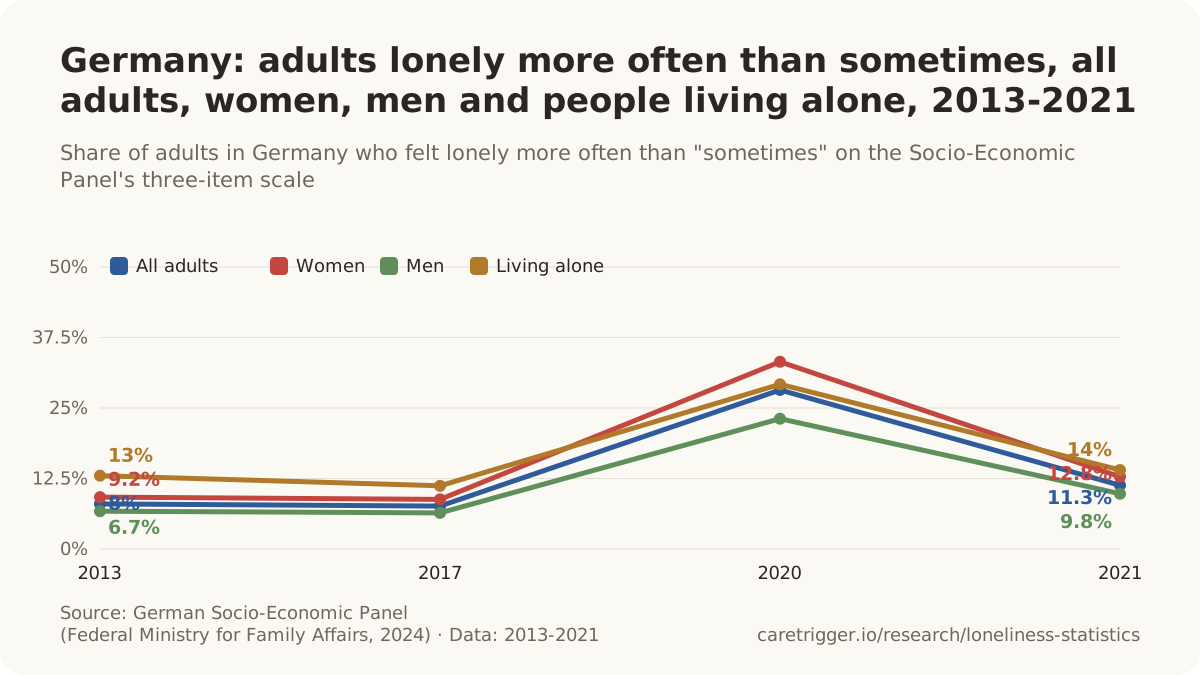
Other figures
- 17.1% of women aged 16+ in Ireland felt lonely at least sometimes in the four weeks before their 2024 SILC interview, against 11.7% of men (CSO, SILC 2024 well-being).
- 8.5% of people aged 65+ in the Netherlands were strongly lonely in 2025 (8.6% of men, 8.4% of women), on the short De Jong Gierveld scale (RIVM, Monitor mentale gezondheid, 2026).
- 10.9% of women aged 16+ in Denmark showed signs of loneliness in 2023, against 8.2% of men (Danish National Health Profile, 2024).
- 17% of men in Sweden have no one to share their innermost thoughts and feelings with, against 10% of women, the agency's measure of emotional loneliness (Public Health Agency of Sweden).
- 21.8% of women in Spain felt unwanted loneliness in 2024, against 18.0% of men, with the gap widest after age 55 (Observatorio Estatal de la Soledad No Deseada barometer, 2024).
- 29.2% of women aged 16+ in Italy felt lonely at least part of the time in the past four weeks in 2021, more often than men in both 2018 and 2021 (ISTAT, BES 2022).
- 18.9% of Australian women aged 15 and over agreed that they often feel very lonely in 2025, against 15.8% of men (Australian Bureau of Statistics, General Social Survey 2025).
- 15.8% of Australian men aged 15 and over agreed that they often feel very lonely in 2025 (Australian Bureau of Statistics, General Social Survey 2025).
- 18.4% of Australian women aged 65 and over agreed that they often feel very lonely in 2025, against 13.9% of men that age (Australian Bureau of Statistics, General Social Survey 2025).
- 87% of Australian men aged 15 and over had family or friends outside their household to confide in, against 92% of women, in 2025 (Australian Bureau of Statistics, General Social Survey 2025).
- 15.1% of Indian women aged 60 and over felt alone often or most of the time in 2017-2018, against 11.6% of men (Srivastava & Srivastava, Indian Journal of Psychiatry, 2023).
- 10.8% of Chilean women aged 18 and over felt lonely always or almost always in the past four weeks in 2025, against 8.4% of men (Ministry of Social Development and Family, Encuesta de Bienestar Social 2025).
- 23.64% of community-dwelling Taiwanese aged 65 and over were lonely, against 17.03% in Japan, in national cohorts followed in 1996-2012, and men's loneliness rose faster after 65 in both countries (Chiu et al., Geriatrics & Gerontology International, 2025).
- 30.9% of older women were lonely, the highest rate by gender in a 126-study meta-analysis of adults aged 60 and over (Salari et al., Humanities and Social Sciences Communications, 2025).
- 176 more hours a year were spent alone by American men in 2019 than in 2003, against 73 more hours for women (American Time Use Survey analysis, Kannan & Veazie, SSM Population Health, 2023).
- 5.1% of US women and 4.7% of US men said they usually or always feel lonely in 2024 (Sikder, NHIS 2024 analysis, medRxiv preprint, 2026).
Sources: Pew Research Center; Gallup (2023, 2025); AARP Research; World Health Organization; CDC, Morbidity and Mortality Weekly Report; U.S. Census Bureau; Making Caring Common, Harvard Graduate School of Education; Survey Center on American Life; JAMA; OECD (2025); Cabinet Office of Japan (2025, 2026); Statistics Canada (2023, 2025); Journals of Gerontology: Series B; Office for National Statistics; Cologne Center for Ethics, Rights, Economics, and Social Sciences of Health and German Centre of Gerontology; Federal Ministry of Education, Family Affairs, Senior Citizens, Women and Youth; Ministry of Data and Statistics; Ministry of Data and Statistics, South Korea; Federal Ministry for Family Affairs, Senior Citizens, Women and Youth; European Journal of Ageing; Central Statistics Office, Ireland; RIVM, Monitor mentale gezondheid; National Institute of Public Health, University of Southern Denmark, for the Danish Health Authority; Public Health Agency of Sweden; Observatorio Estatal de la Soledad No Deseada: Fundación ONCE and Fundación AXA, fieldwork by Fresno Consulting; ISTAT; Australian Bureau of Statistics (2026); Indian Journal of Psychiatry; Ministry of Social Development and Family, Chile; Geriatrics & Gerontology International; Humanities and Social Sciences Communications; SSM - Population Health; medRxiv
05 / Countries
Which countries are the loneliest?
45% of adults in Comoros felt lonely a lot of the previous day, the most of 142 countries; Vietnam had 6% (Gallup, 2023).

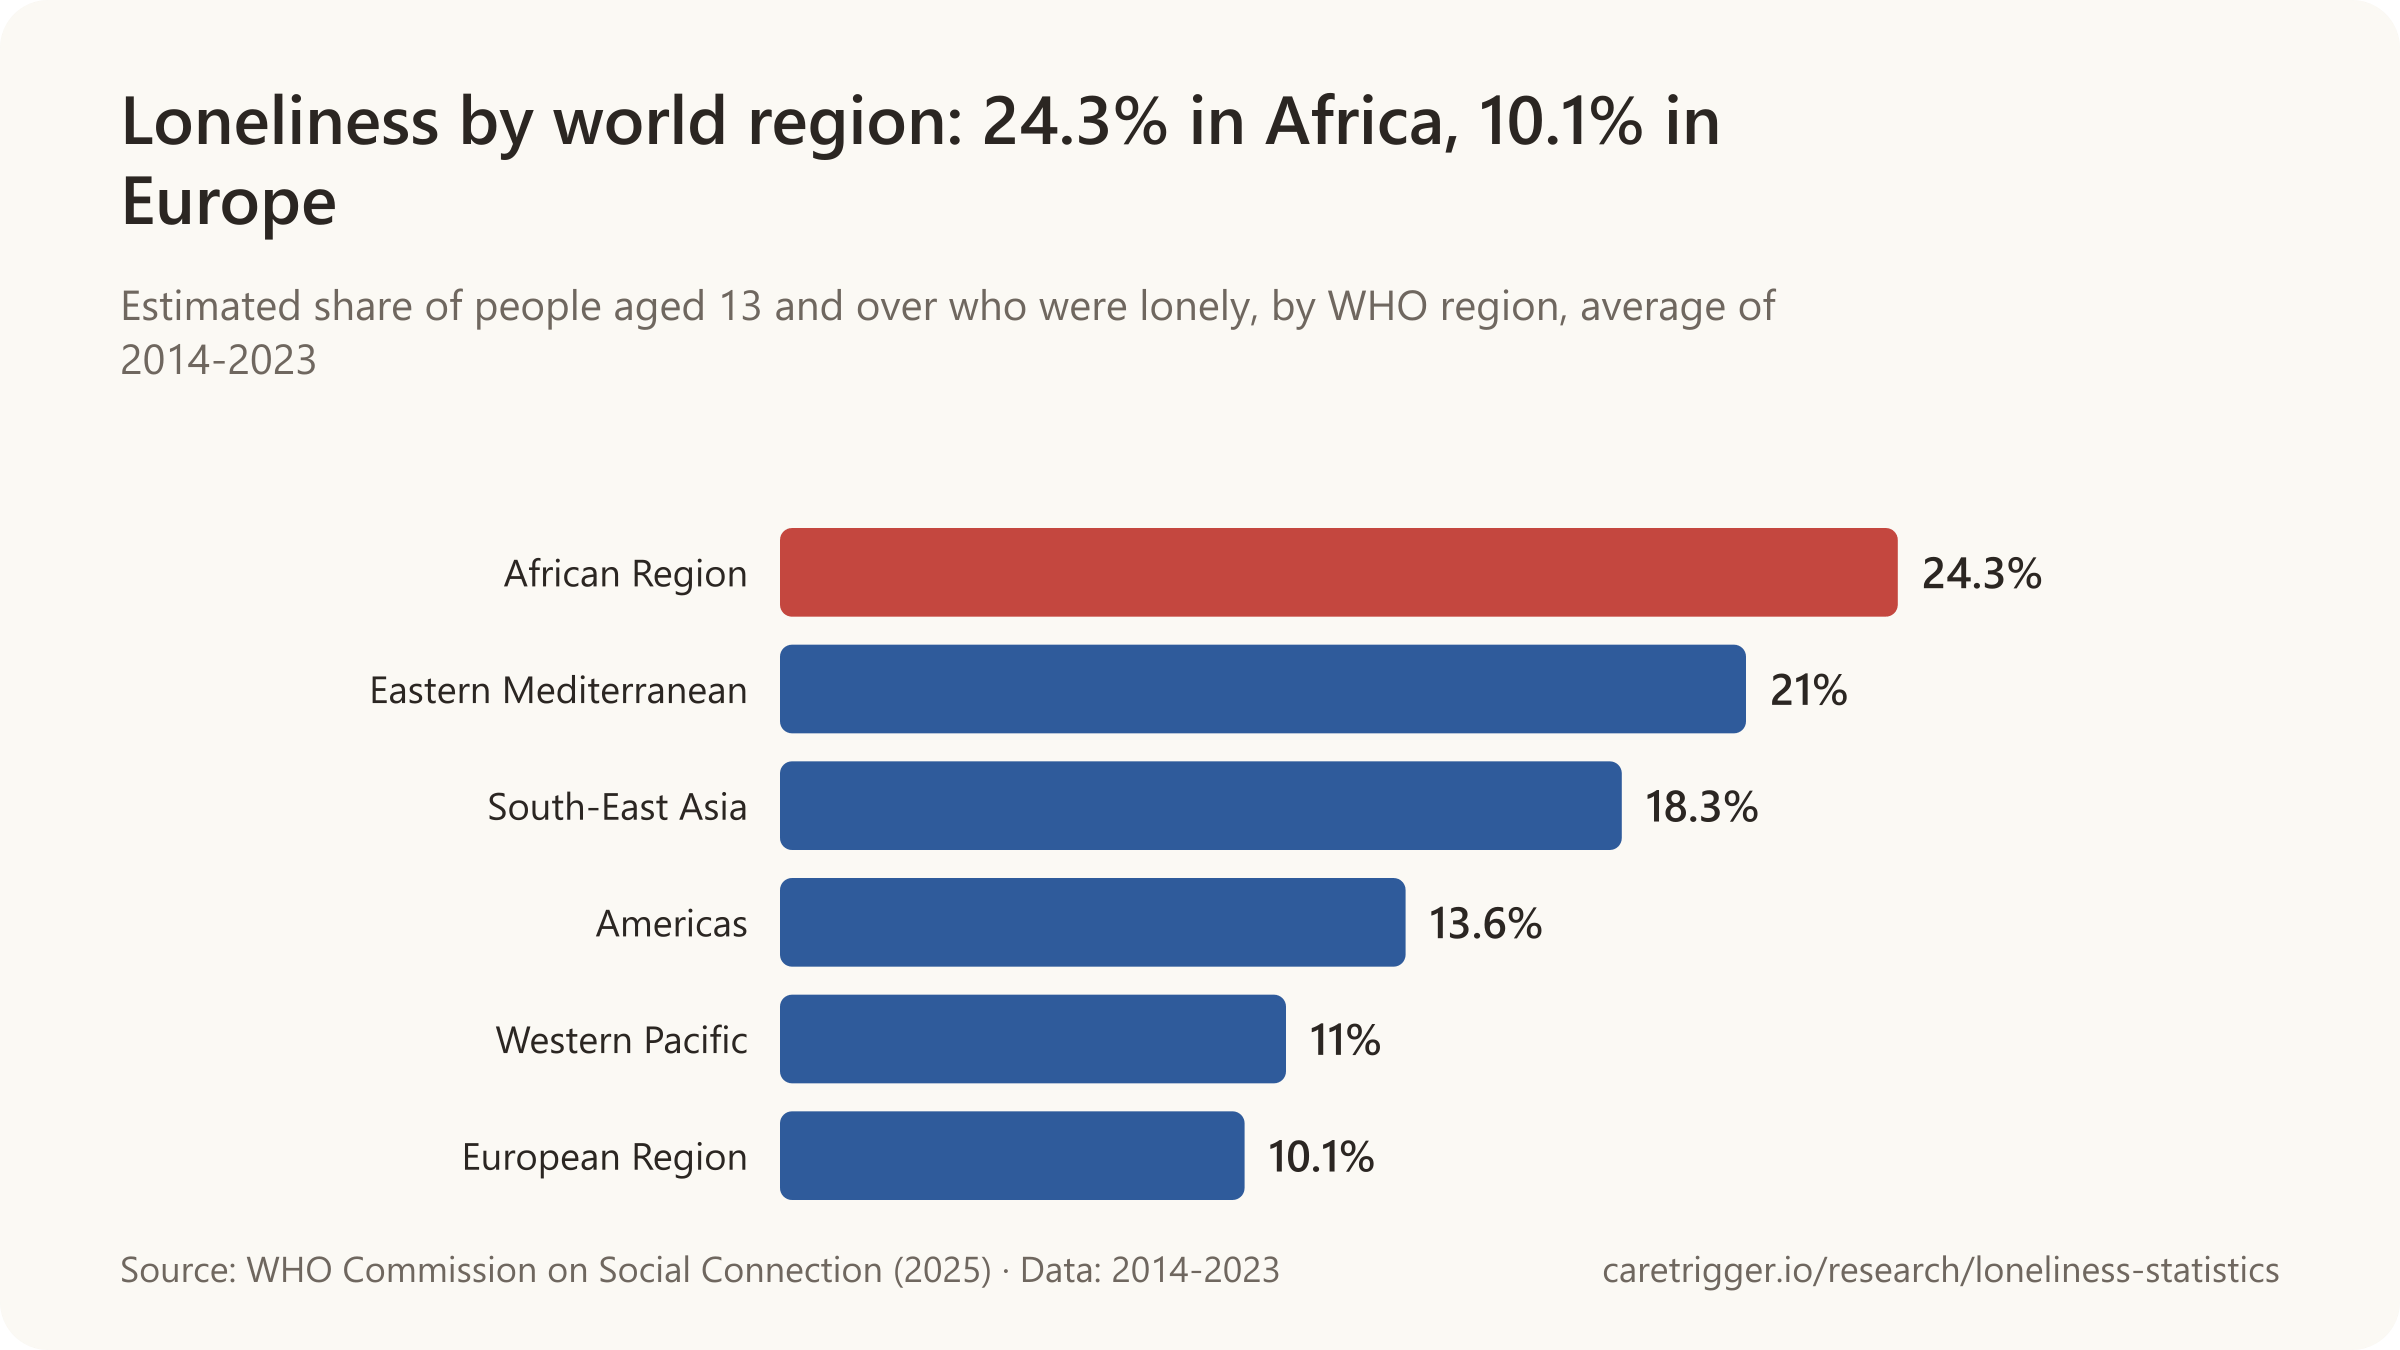
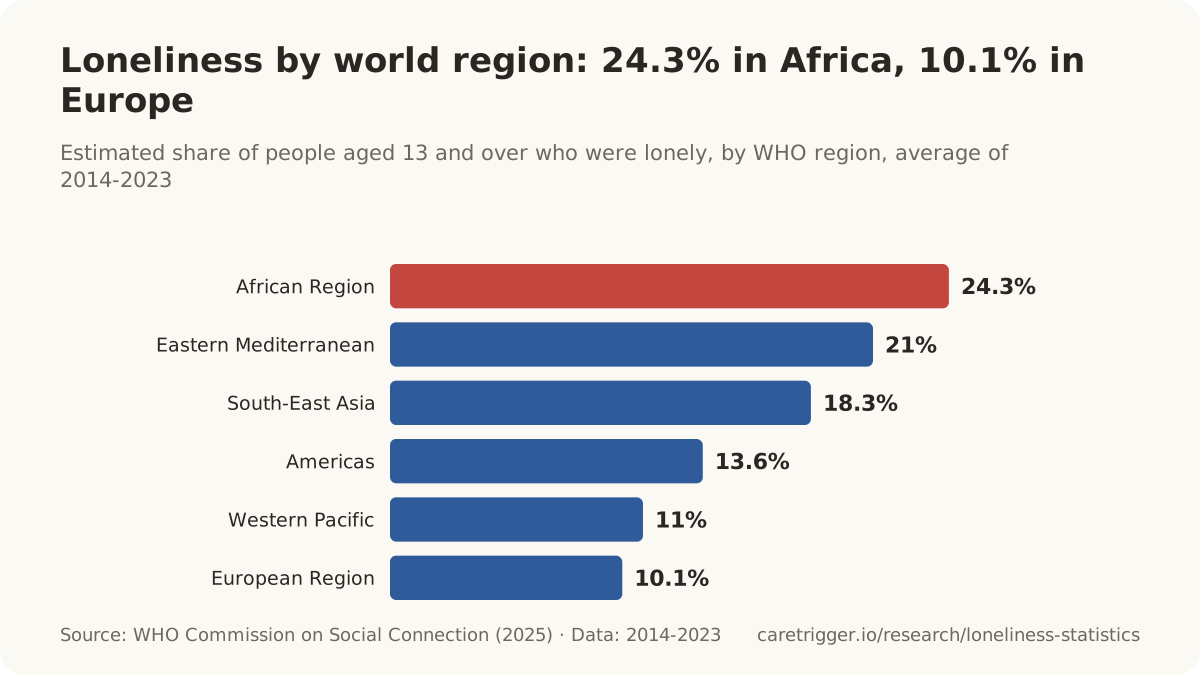
- 24.3% of people in low-income countries are lonely, more than twice the 10.6% in high-income countries (2014-2023).
- Highest in Europe's official survey: 10.8% of people 16 and older in France felt lonely most or all of the time; Norway had 3.1% (2022).
- 38.2% of South Koreans 13 and older feel lonely often or sometimes in daily life, in the country's first national measure (2025).
- In 29 countries at least a third of people felt very or fairly lonely; 22 of them were in Africa (Meta-Gallup, 2022-2023).
Country rankings depend on the survey: Gallup's daily question, the Meta-Gallup question and the European Union's official survey order countries differently, and 69 of the 153 countries in the WHO's estimates have no other source than the Meta-Gallup survey. Rankings that mix loneliness with household data, such as the "loneliest country" lists in the press, are not used here.
Sources: Gallup (2024, 2023); World Health Organization; OECD; Cabinet Office of Japan; Ministry of Data and Statistics
More statistics (327)
45% of adults in Comoros felt loneliness a lot of the previous day, the highest rate in Gallup's 142-country survey of 2023, against 6% in Vietnam, the lowest (Gallup World Poll, 2024).
- 24.3% of people in low-income countries were lonely, more than twice the 10.6% in high-income countries, on average in 2014-2023 (WHO Commission on Social Connection, 2025).
- 23% of adults aged 15 and over in 142 countries felt loneliness a lot of the previous day in 2023, the first year Gallup asked (Gallup World Poll, 2024).
- 6% of adults in Vietnam felt loneliness a lot of the previous day, the lowest rate of 142 countries in 2023 (Gallup World Poll, 2024).
- 22 countries had more than 30% of adults feeling loneliness a lot of the previous day in 2023, over half of them in Africa (Gallup World Poll, 2024).
- 10% of adults in Estonia, Kosovo and Kazakhstan felt loneliness a lot of the previous day in 2023, half the global average or less, as did 11% in Poland, Slovenia, Taiwan and Finland (Gallup World Poll, 2024).
- 28% of unmarried adults worldwide felt loneliness a lot of the previous day in 2023, against 19% of those married or in a domestic partnership (Gallup World Poll, 2024).
- 2 times as likely: adults worldwide who found it difficult to get by on their income were about twice as likely as those better off to have felt lonely a lot of the previous day in 2023 (Gallup World Poll, 2024).
- 14 percentage points more young adults aged 15-29 than older adults in China felt loneliness a lot of the previous day in 2023, the largest gap in that direction, in a survey Gallup ran there by web only (Gallup World Poll, 2024).
- 10 points or more: in a substantial number of countries, adults aged 50 and over were at least that much more likely than the youngest adults to feel loneliness a lot of the previous day, even though age made little difference globally in 2023 (Gallup World Poll, 2024).
- 36 percentage points more people who felt lonely also felt sadness the previous day than people who did not feel lonely, in Gallup's 2023 survey of 142 countries (Gallup World Poll, 2024).
- 19.3% of people in lower-middle-income countries were lonely (95% uncertainty interval 14.2-26.6%), on average in 2014-2023 (WHO Commission on Social Connection, 2025).
- 12.1% of people in upper-middle-income countries were lonely (95% uncertainty interval 8.1-20.3%), on average in 2014-2023 (WHO Commission on Social Connection, 2025).
- 10.6% of people in high-income countries were lonely, the lowest of the four income groups (95% uncertainty interval 8.3-14.0%), on average in 2014-2023 (WHO Commission on Social Connection, 2025).
Meta-Gallup: 142 countries
- 29 countries had at least a third of people feeling very or fairly lonely; 22 of them were in Africa, 4 in the Middle East and 3 in South Asia (Meta-Gallup Global State of Social Connections, a Gallup survey for Meta, 2023).
- 19 countries had fewer than 10% of people feeling very or fairly lonely, including Germany (6%), Slovenia (6%) and Kyrgyzstan (8%) (Meta-Gallup Global State of Social Connections, a Gallup survey for Meta, 2023).
- 50% of people in Afghanistan felt very or fairly lonely, nearly 4 times the 13% who were not lonely at all (Meta-Gallup Global State of Social Connections, a Gallup survey for Meta, 2023).
| Country | Very or fairly lonely | Scope |
|---|---|---|
| Lesotho | 58% | People aged 15+ in Lesotho · Lesotho · June 2022 to February 2023 |
| Philippines | 57% | People aged 15+ in Philippines · Philippines · June 2022 to February 2023 |
| Uganda | 53% | People aged 15+ in Uganda · Uganda · June 2022 to February 2023 |
| Botswana | 50% | People aged 15+ in Botswana · Botswana · June 2022 to February 2023 |
| Afghanistan | 50% | People aged 15+ in Afghanistan · Afghanistan · June 2022 to February 2023 |
| Kenya | 47% | People aged 15+ in Kenya · Kenya · June 2022 to February 2023 |
| Nepal | 43% | People aged 15+ in Nepal · Nepal · June 2022 to February 2023 |
| Pakistan | 41% | People aged 15+ in Pakistan · Pakistan · June 2022 to February 2023 |
| South Africa | 39% | People aged 15+ in South Africa · South Africa · June 2022 to February 2023 |
| Bangladesh | 39% | People aged 15+ in Bangladesh · Bangladesh · June 2022 to February 2023 |
| Ethiopia | 36% | People aged 15+ in Ethiopia · Ethiopia · June 2022 to February 2023 |
| Iraq | 36% | People aged 15+ in Iraq · Iraq · June 2022 to February 2023 |
| Iran | 33% | People aged 15+ in Iran · Iran · June 2022 to February 2023 |
| India | 30% | People aged 15+ in India · India · June 2022 to February 2023 |
| Chile | 30% | People aged 15+ in Chile · Chile · June 2022 to February 2023 |
| Argentina | 28% | People aged 15+ in Argentina · Argentina · June 2022 to February 2023 |
| Nigeria | 27% | People aged 15+ in Nigeria · Nigeria · June 2022 to February 2023 |
| Colombia | 24% | People aged 15+ in Colombia · Colombia · June 2022 to February 2023 |
| Peru | 24% | People aged 15+ in Peru · Peru · June 2022 to February 2023 |
| Egypt | 22% | People aged 15+ in Egypt · Egypt · June 2022 to February 2023 |
| Saudi Arabia | 22% | People aged 15+ in Saudi Arabia · Saudi Arabia · June 2022 to February 2023 |
| France | 20% | People aged 15+ in France · France · June 2022 to February 2023 |
| Mexico | 18% | People aged 15+ in Mexico · Mexico · June 2022 to February 2023 |
| Japan | 17% | People aged 15+ in Japan · Japan · June 2022 to February 2023 |
| Italy | 17% | People aged 15+ in Italy · Italy · June 2022 to February 2023 |
| Taiwan | 17% | People aged 15+ in Taiwan · Taiwan · June 2022 to February 2023 |
| Portugal | 17% | People aged 15+ in Portugal · Portugal · June 2022 to February 2023 |
| Türkiye | 16% | People aged 15+ in Türkiye · Türkiye · June 2022 to February 2023 |
| South Korea | 16% | People aged 15+ in South Korea · South Korea · June 2022 to February 2023 |
| Brazil | 15% | People aged 15+ in Brazil · Brazil · June 2022 to February 2023 |
| United States | 15% | People aged 15+ in United States · United States · June 2022 to February 2023 |
| Canada | 15% | People aged 15+ in Canada · Canada · June 2022 to February 2023 |
| Singapore | 14% | People aged 15+ in Singapore · Singapore · June 2022 to February 2023 |
| Malaysia | 14% | People aged 15+ in Malaysia · Malaysia · June 2022 to February 2023 |
| Austria | 14% | People aged 15+ in Austria · Austria · June 2022 to February 2023 |
| United Kingdom | 13% | People aged 15+ in United Kingdom · United Kingdom · June 2022 to February 2023 |
| Ireland | 13% | People aged 15+ in Ireland · Ireland · June 2022 to February 2023 |
| Israel | 13% | People aged 15+ in Israel · Israel · June 2022 to February 2023 |
| Switzerland | 13% | People aged 15+ in Switzerland · Switzerland · June 2022 to February 2023 |
| Belgium | 13% | People aged 15+ in Belgium · Belgium · June 2022 to February 2023 |
| Spain | 12% | People aged 15+ in Spain · Spain · June 2022 to February 2023 |
| New Zealand | 12% | People aged 15+ in New Zealand · New Zealand · June 2022 to February 2023 |
| Poland | 11% | People aged 15+ in Poland · Poland · June 2022 to February 2023 |
| Greece | 11% | People aged 15+ in Greece · Greece · June 2022 to February 2023 |
| Australia | 10% | People aged 15+ in Australia · Australia · June 2022 to February 2023 |
| Thailand | 10% | People aged 15+ in Thailand · Thailand · June 2022 to February 2023 |
| Indonesia | 9% | People aged 15+ in Indonesia · Indonesia · June 2022 to February 2023 |
| Hong Kong | 9% | People aged 15+ in Hong Kong · Hong Kong · June 2022 to February 2023 |
| Russia | 8% | People aged 15+ in Russia · Russia · June 2022 to February 2023 |
| Netherlands | 8% | People aged 15+ in Netherlands · Netherlands · June 2022 to February 2023 |
| Sweden | 8% | People aged 15+ in Sweden · Sweden · June 2022 to February 2023 |
| Norway | 8% | People aged 15+ in Norway · Norway · June 2022 to February 2023 |
| Finland | 7% | People aged 15+ in Finland · Finland · June 2022 to February 2023 |
| Denmark | 7% | People aged 15+ in Denmark · Denmark · June 2022 to February 2023 |
| Latvia | 7% | People aged 15+ in Latvia · Latvia · June 2022 to February 2023 |
| Germany | 6% | People aged 15+ in Germany · Germany · June 2022 to February 2023 |
| Ukraine | 6% | People aged 15+ in Ukraine · Ukraine · June 2022 to February 2023 |
| Slovenia | 6% | People aged 15+ in Slovenia · Slovenia · June 2022 to February 2023 |
| Vietnam | 5% | People aged 15+ in Vietnam · Vietnam · June 2022 to February 2023 |
| Country | Men | Scope |
|---|---|---|
| Kuwait | 37% | Men aged 15+ in Kuwait · Kuwait · June 2022 to February 2023 |
| India | 31% | Men aged 15+ in India · India · June 2022 to February 2023 |
| France | 20% | Men aged 15+ in France · France · June 2022 to February 2023 |
| Japan | 19% | Men aged 15+ in Japan · Japan · June 2022 to February 2023 |
| Mexico | 19% | Men aged 15+ in Mexico · Mexico · June 2022 to February 2023 |
| Italy | 17% | Men aged 15+ in Italy · Italy · June 2022 to February 2023 |
| Brazil | 16% | Men aged 15+ in Brazil · Brazil · June 2022 to February 2023 |
| South Korea | 15% | Men aged 15+ in South Korea · South Korea · June 2022 to February 2023 |
| Canada | 13% | Men aged 15+ in Canada · Canada · June 2022 to February 2023 |
| United Kingdom | 13% | Men aged 15+ in United Kingdom · United Kingdom · June 2022 to February 2023 |
| Australia | 13% | Men aged 15+ in Australia · Australia · June 2022 to February 2023 |
| United States | 12% | Men aged 15+ in United States · United States · June 2022 to February 2023 |
| Germany | 6% | Men aged 15+ in Germany · Germany · June 2022 to February 2023 |
| Country | Women | Scope |
|---|---|---|
| India | 28% | Women aged 15+ in India · India · June 2022 to February 2023 |
| France | 20% | Women aged 15+ in France · France · June 2022 to February 2023 |
| Kuwait | 20% | Women aged 15+ in Kuwait · Kuwait · June 2022 to February 2023 |
| United States | 18% | Women aged 15+ in United States · United States · June 2022 to February 2023 |
| Italy | 17% | Women aged 15+ in Italy · Italy · June 2022 to February 2023 |
| South Korea | 17% | Women aged 15+ in South Korea · South Korea · June 2022 to February 2023 |
| Mexico | 17% | Women aged 15+ in Mexico · Mexico · June 2022 to February 2023 |
| Canada | 16% | Women aged 15+ in Canada · Canada · June 2022 to February 2023 |
| Japan | 16% | Women aged 15+ in Japan · Japan · June 2022 to February 2023 |
| United Kingdom | 14% | Women aged 15+ in United Kingdom · United Kingdom · June 2022 to February 2023 |
| Brazil | 14% | Women aged 15+ in Brazil · Brazil · June 2022 to February 2023 |
| Australia | 7% | Women aged 15+ in Australia · Australia · June 2022 to February 2023 |
| Germany | 5% | Women aged 15+ in Germany · Germany · June 2022 to February 2023 |
Europe: the official survey (EU-SILC)

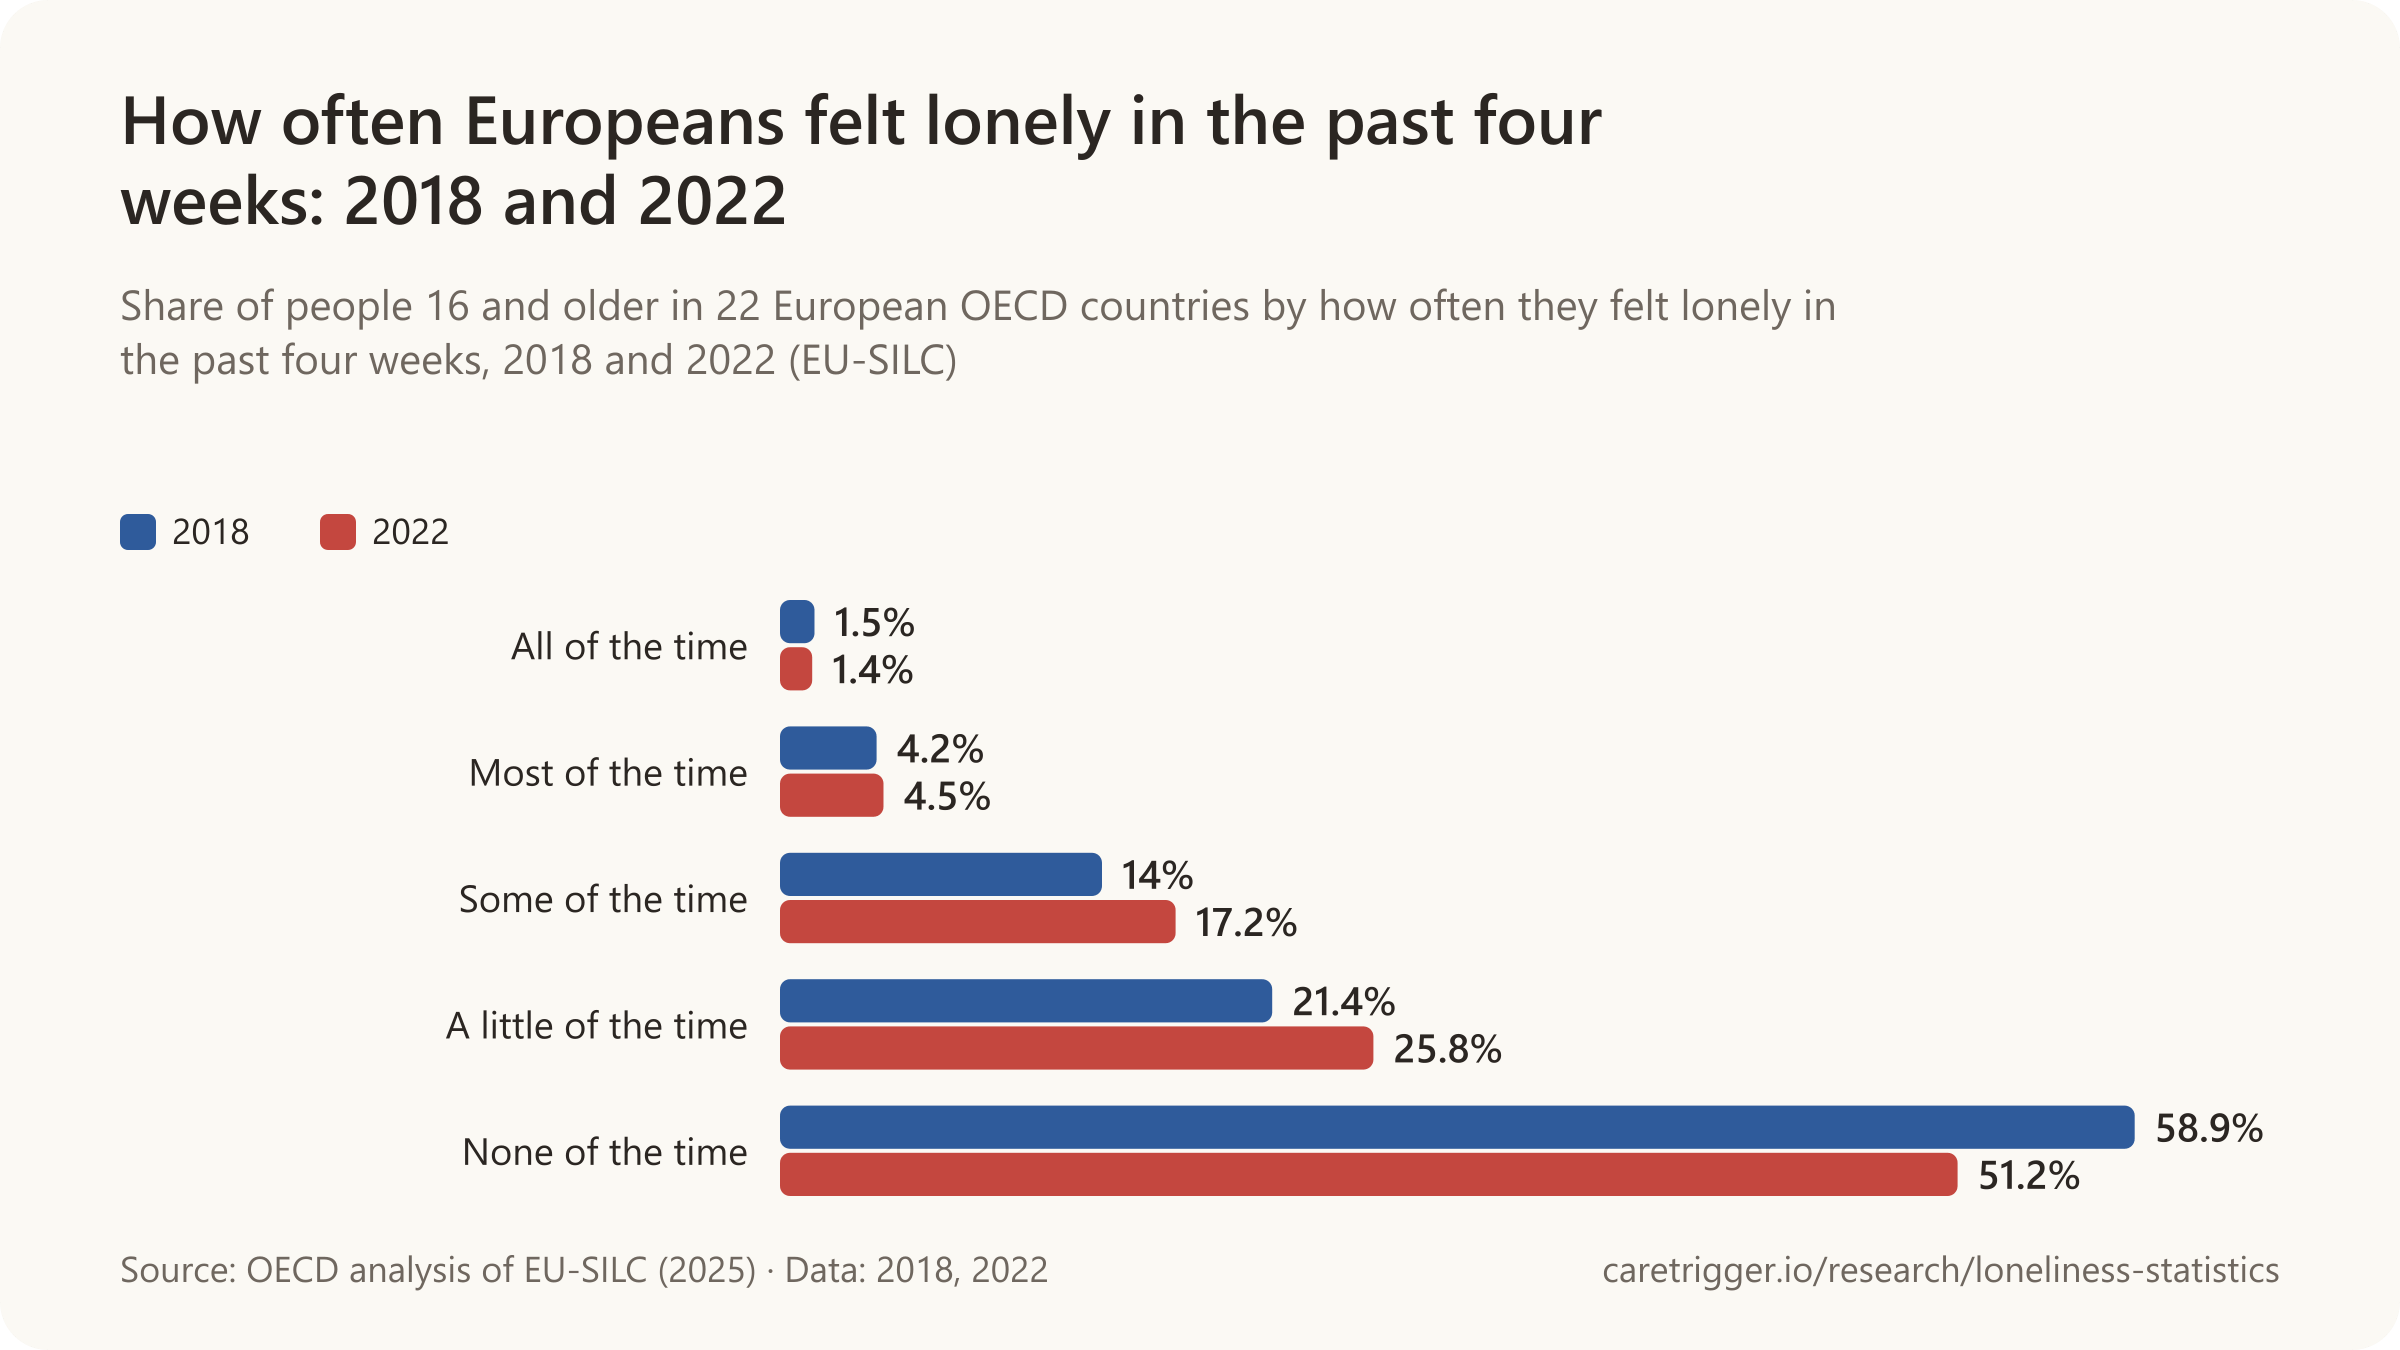
- 10.8% of people aged 16 and over in France felt lonely most or all of the time in the past four weeks in 2022 (OECD analysis of EU-SILC, 2025).
- 6% of people in 23 OECD countries felt lonely most or all of the time over the past four weeks, according to the OECD's first comparative report on social connections (OECD, 2025).
- 51% of people in 22 European OECD countries said they never felt lonely in the past four weeks in 2022, down from 59% in 2018, while the share lonely most or all of the time barely moved (OECD, 2025).
- 13% of people in the bottom income fifth felt lonely most or all of the time, 2.2 times the 6% average, across OECD countries with comparable data (OECD, 2025).
- 14% of people who live alone felt lonely most or all of the time, 2.4 times the 6% average, across OECD countries with comparable data (OECD, 2025).
- 43% of people who felt any loneliness in the past four weeks rated it as very intense (7 or more on a 1-10 scale), across 22 European OECD countries in the EU Loneliness Survey (OECD, 2025).
- 8% of people in 22 European OECD countries say they have no close friends at all (OECD, 2025).
- 10% of people across OECD countries say they have no friends or family to count on in times of need, from 2% in Iceland to 20% in Korea (OECD, 2025).
- 6.0% of people aged 16 and over felt lonely most or all of the time in the past four weeks on average across 25 OECD countries in 2022-2023, ranging from 3.1% in Norway to 10.8% in France (OECD analysis of EU-SILC and national surveys, 2025).
- 5.8% of people aged 16 and over in 22 European OECD countries felt lonely most or all of the time in the past four weeks in 2022, against 5.7% in 2018, a change of 0.15 points (OECD analysis of EU-SILC, 2025).
- 21.0% of people aged 16 and over in 21 European OECD countries got together with friends in person every day in 2006 (OECD analysis of EU-SILC, 2025).
- 15.8% of people aged 16 and over in 21 European OECD countries got together with friends in person every day in 2015 (OECD analysis of EU-SILC, 2025).
- 12.0% of people aged 16 and over in 21 European OECD countries got together with friends in person every day in 2022 (OECD analysis of EU-SILC, 2025).
- 81% of people in Japan reported some degree of loneliness in 2023 (any answer other than "never"), and nearly half of them said the feeling had lasted more than five years (OECD, 2025).
- 40% of respondents reported loneliness in face-to-face surveys against 15% in telephone surveys, on average across studies in a systematic review cited by the OECD, one reason national figures differ (OECD, 2025).
| Country | Most or all of the time | Scope |
|---|---|---|
| France | 10.8% | People aged 16+ (EU-SILC 2022); felt lonely most or all of the time in the past 4 weeks (single direct question) · France · 2022 |
| Lithuania | 8.9% | People aged 16+ (EU-SILC 2022); felt lonely most or all of the time in the past 4 weeks (single direct question) · Lithuania · 2022 |
| Croatia | 8.3% | People aged 16+ (EU-SILC 2022); felt lonely most or all of the time in the past 4 weeks (single direct question) · Croatia · 2022 |
| Portugal | 8.1% | People aged 16+ (EU-SILC 2022); felt lonely most or all of the time in the past 4 weeks (single direct question) · Portugal · 2022 |
| Hungary | 8.1% | People aged 16+ (EU-SILC 2022); felt lonely most or all of the time in the past 4 weeks (single direct question) · Hungary · 2022 |
| Romania | 8.1% | People aged 16+ (EU-SILC 2022); felt lonely most or all of the time in the past 4 weeks (single direct question) · Romania · 2022 |
| Sweden | 7.9% | People aged 16+ (EU-SILC 2022); felt lonely most or all of the time in the past 4 weeks (single direct question) · Sweden · 2022 |
| Bulgaria | 7.6% | People aged 16+ (EU-SILC 2022); felt lonely most or all of the time in the past 4 weeks (single direct question) · Bulgaria · 2022 |
| Greece | 7.2% | People aged 16+ (EU-SILC 2022); felt lonely most or all of the time in the past 4 weeks (single direct question) · Greece · 2022 |
| Finland | 7.2% | People aged 16+ (EU-SILC 2022); felt lonely most or all of the time in the past 4 weeks (single direct question) · Finland · 2022 |
| Estonia | 6.6% | People aged 16+ (EU-SILC 2022); felt lonely most or all of the time in the past 4 weeks (single direct question) · Estonia · 2022 |
| Latvia | 6.4% | People aged 16+ (EU-SILC 2022); felt lonely most or all of the time in the past 4 weeks (single direct question) · Latvia · 2022 |
| Netherlands | 5.7% | People aged 16+ (EU-SILC 2022); felt lonely most or all of the time in the past 4 weeks (single direct question) · Netherlands · 2022 |
| Spain | 5.4% | People aged 16+ (EU-SILC 2022); felt lonely most or all of the time in the past 4 weeks (single direct question) · Spain · 2022 |
| Belgium | 5.3% | People aged 16+ (EU-SILC 2022); felt lonely most or all of the time in the past 4 weeks (single direct question) · Belgium · 2022 |
| Italy | 5.3% | People aged 16+ (EU-SILC 2022); felt lonely most or all of the time in the past 4 weeks (single direct question) · Italy · 2022 |
| Czechia | 5.2% | People aged 16+ (EU-SILC 2022); felt lonely most or all of the time in the past 4 weeks (single direct question) · Czechia · 2022 |
| Poland | 5.1% | People aged 16+ (EU-SILC 2022); felt lonely most or all of the time in the past 4 weeks (single direct question) · Poland · 2022 |
| Denmark | 5.1% | People aged 16+ (EU-SILC 2022); felt lonely most or all of the time in the past 4 weeks (single direct question) · Denmark · 2022 |
| Luxembourg | 4.9% | People aged 16+ (EU-SILC 2022); felt lonely most or all of the time in the past 4 weeks (single direct question) · Luxembourg · 2022 |
| Austria | 4.3% | People aged 16+ (EU-SILC 2022); felt lonely most or all of the time in the past 4 weeks (single direct question) · Austria · 2022 |
| Slovakia | 4.2% | People aged 16+ (EU-SILC 2022); felt lonely most or all of the time in the past 4 weeks (single direct question) · Slovakia · 2022 |
| Switzerland | 4.0% | People aged 16+ (EU-SILC 2022); felt lonely most or all of the time in the past 4 weeks (single direct question) · Switzerland · 2022 |
| Slovenia | 3.9% | People aged 16+ (EU-SILC 2022); felt lonely most or all of the time in the past 4 weeks (single direct question) · Slovenia · 2022 |
| Ireland | 3.6% | People aged 16+ (EU-SILC 2022); felt lonely most or all of the time in the past 4 weeks (single direct question) · Ireland · 2022 |
| Norway | 3.1% | People aged 16+ (EU-SILC 2022); felt lonely most or all of the time in the past 4 weeks (single direct question) · Norway · 2022 |
| Group | Lonely | Scope |
|---|---|---|
| People aged 16 to 24 | 4.3% | People aged 16 to 24 (EU-SILC 2018 and 2022); lonely most or all of the time in the past 4 weeks · 22 European OECD countries (average) · 2018 and 2022 |
| People aged 25 to 49 | 4.4% | People aged 25 to 49 (EU-SILC 2018 and 2022); lonely most or all of the time in the past 4 weeks · 22 European OECD countries (average) · 2018 and 2022 |
| People aged 50 to 64 | 5.6% | People aged 50 to 64 (EU-SILC 2018 and 2022); lonely most or all of the time in the past 4 weeks · 22 European OECD countries (average) · 2018 and 2022 |
| People aged 65 and over | 8.5% | People aged 65 and over (EU-SILC 2018 and 2022); lonely most or all of the time in the past 4 weeks · 22 European OECD countries (average) · 2018 and 2022 |
| People living alone | 13.9% | People living alone (EU-SILC 2018 and 2022); lonely most or all of the time in the past 4 weeks · 22 European OECD countries (average) · 2018 and 2022 |
| People living with others | 3.6% | People living with others (EU-SILC 2018 and 2022); lonely most or all of the time in the past 4 weeks · 22 European OECD countries (average) · 2018 and 2022 |
| Unemployed people | 11.8% | Unemployed people (EU-SILC 2018 and 2022); lonely most or all of the time in the past 4 weeks · 22 European OECD countries (average) · 2018 and 2022 |
| People in the bottom income fifth | 12.9% | People in the bottom income fifth (EU-SILC 2018 and 2022); lonely most or all of the time in the past 4 weeks · 22 European OECD countries (average) · 2018 and 2022 |
| Women | 6.4% | Women (EU-SILC 2018 and 2022); lonely most or all of the time in the past 4 weeks · 22 European OECD countries (average) · 2018 and 2022 |
| Single people | 10.4% | Single people (EU-SILC 2018 and 2022); lonely most or all of the time in the past 4 weeks · 22 European OECD countries (average) · 2018 and 2022 |
Older Europeans by country
- 113 countries or territories had some nationally representative loneliness data for 2000-2019, but data for adults were lacking outside Europe (Surkalim et al., BMJ, 2022).
The UK
- 20% of people aged 16+ in England said they never felt lonely in 2025/26, down from 21% in 2024/25 (DCMS Community and Engagement Survey, 2026).
- 13% of people aged 16+ in Oldham felt lonely often or always in 2025/26, the highest local authority rate in England, against 2% in the City of London (DCMS Community and Engagement Survey, 2026).
- 29% of people in England with low life satisfaction (0 to 4 out of 10) felt lonely often or always in 2025/26, against 1% of those with very high life satisfaction (DCMS Community and Engagement Survey data tables, 2026).
- 95% of adults aged 16+ in England had at least one person they could really count on to listen when they needed to talk in 2024/25 (DCMS Community Life Survey, 2025).
- 4% of adults aged 16+ in England answered often or always to all four loneliness questions in 2019/20 (feeling lonely, lacking companionship, feeling left out, feeling isolated) (DCMS Community Life Survey, 2020).
- 11% of adults aged 16+ in England felt isolated from others often or always in 2019/20, and 11% felt they lacked companionship as often (DCMS Community Life Survey, 2020).
- 13% of adults in England with a limiting long-term illness or disability felt lonely often or always in 2017/18, against 3% of those without (DCMS Community Life Survey: Focus on Loneliness, 2019).
- 27.5% of children aged 10 to 15 in Great Britain who received free school meals said they often felt lonely in 2018, against 5.5% of those who did not (ONS analysis of the Good Childhood Index Survey, 2018).
- 5.0% of adults in Great Britain, about 2.6 million people, felt lonely often or always in the first month of lockdown (3 April to 3 May 2020), about the same share as before lockdown (ONS Opinions and Lifestyle Survey, 2020).
- 30.9% of adults asked in Great Britain, equivalent to 7.4 million people, said their well-being had been affected by feeling lonely in the past seven days in April 2020 (ONS Opinions and Lifestyle Survey, 2020).
- 7.2% of adults in Great Britain, about 3.7 million people, felt lonely often or always from October 2020 to February 2021, up from 5.0% in spring 2020 (ONS Opinions and Lifestyle Survey, 2021).
- 4 questions make up the UK's national indicators of loneliness: the three-item UCLA scale (lack companionship, feel left out, feel isolated from others) plus the direct question 'How often do you feel lonely?' (ONS measuring loneliness guidance, 2018).
- 7% of adults in Great Britain felt lonely often or always in September 2026 (ONS Opinions and Lifestyle Survey, 2026).
- 14.0% of people aged 16+ living alone in Northern Ireland felt lonely often or always in 2024/25, against 2.3% of people in two-person households (Individual Wellbeing in Northern Ireland data tables, 2026).
- 10% of adults in Scotland felt lonely most or all of the time in the week before their interview in 2023 (Scottish Health Survey, 2024).
- 14% of adults in Scotland's most deprived areas felt lonely most or all of the time in the past week in 2023, against 5% in the least deprived areas (Scottish Health Survey, 2024).
- 2.1 million people aged 50+ in England were projected in 2018 to be often lonely by 2030/31 if the 2006-2017 average rate of 7.5% held, up from 1.36 million in 2016/17 (Age UK analysis of ELSA and ONS projections, 2018).
- 20% of adults in Scotland felt lonely at least some of the time in the week before their interview in 2024, down from 23% in 2022 (Scottish Household Survey, 2025).
- 23% of adults in Scotland felt lonely at least some of the time in the past week in 2022, above the 21% of 2018 (Scottish Household Survey, 2025).
- 21% of adults in Scotland felt lonely at least some of the time in the past week in 2018, the first year the Scottish Household Survey asked about loneliness; the survey calls the 20% of 2024 stable from that level (Scottish Household Survey, 2025).
- 33% of adults in North Ayrshire felt lonely at least some of the time in the past week in 2024, against 14% in Inverclyde, Argyll and Bute and East Dunbartonshire (Scottish Household Survey, 2025).
- 2018 is the year Scotland published 'A Connected Scotland', its first national strategy on social isolation and loneliness, followed in 2023 by the delivery plan 'Recovering our Connections 2023 to 2026' (Scottish Government, 2023).
- 2018 is when the UK government appointed the world's first minister responsible for tackling loneliness, in January, in response to the Jo Cox Commission on Loneliness (DCMS Loneliness Annual Report, 2020).
- 15 October 2018 is when the UK published 'A connected society: a strategy for tackling loneliness', described by the government as the world's first government strategy for tackling loneliness (DCMS, 2023).
- 7.1% of people in Great Britain, about 3.83 million, felt lonely often or always in the Campaign to End Loneliness's 2023 analysis of ONS survey data, up from 6% (3.24 million) in 2020 (Campaign to End Loneliness, 2023).
- Almost 3 times as likely to experience chronic loneliness: people in England with disabilities or long-standing health conditions, compared with those without (DCMS, Investigating factors associated with loneliness in adults in England, 2022).
- 28% of people with mental distress experienced chronic loneliness, against 4% of people without, in DCMS analysis of Understanding Society, and 60% of the chronically lonely had mental distress against 15% of others (DCMS, 2022).
- 9% of adults said they felt lonely often in the Understanding Society study against 6% who said often or always in the Community Life Survey, a gap DCMS links to the surveys' different answer options (DCMS, 2022).
Germany, France, Spain, Italy and other European countries
- Almost 50 million people in the EU feel lonely most of the time, the JRC's extrapolation of its 13% survey rate to the 376 million people aged 16 and over (Schnepf, Mauri and d'Hombres, Loneliness in Europe, 2024).
- 12% to 13% of people in the EU were very lonely and 36% to 40% at least slightly lonely in 2022, whichever of three measures was used: the direct question, the UCLA 3-item scale or the De Jong Gierveld 6-item scale (Mauri et al., Loneliness in Europe, 2024).
- 17% or more of people in Bulgaria, Cyprus, Ireland and Luxembourg felt lonely most or all of the time in 2022, the highest rates in the EU, against 10% or less in Austria, Croatia, Czechia, the Netherlands, Slovenia and Spain (Mauri et al., Loneliness in Europe, 2024).
- Over 20% of people in Ireland felt lonely most or all of the time in the past four weeks in the 2022 EU Loneliness Survey, the highest rate in the EU (European Commission Joint Research Centre, 2023).
- 8.1% of people in France were lonely most or all of the time in the EU Loneliness Survey's probability sample in 2022, against 14.7% in its online panel sample (Mauri et al., Loneliness in Europe, 2024).
- 6.4% of people in Italy were lonely most or all of the time in the EU Loneliness Survey's probability sample in 2022, against 13.8% in its online panel sample (Mauri et al., Loneliness in Europe, 2024).
- 11.1% of people in Poland were lonely most or all of the time in the EU Loneliness Survey's probability sample in 2022, against 13.5% in its online panel sample (Mauri et al., Loneliness in Europe, 2024).
- 8.1% of people in Sweden were lonely most or all of the time in the EU Loneliness Survey's probability sample in 2022, against 14.8% in its online panel sample (Mauri et al., Loneliness in Europe, 2024).
- 22.3% of unemployed people in the EU felt lonely most or all of the time in 2022, against 12.8% of those in work and 8.1% of retired people (Berlingieri et al., Loneliness in Europe, 2024).
- 21.3% of people in the poorest fifth of EU households felt lonely most or all of the time in 2022, about twice the 10.4% of the richest fifth (Berlingieri et al., Loneliness in Europe, 2024).
- 18.3% of people in the EU who are permanently sick or disabled felt lonely most or all of the time in 2022, against 12.9% of others (Berlingieri et al., Loneliness in Europe, 2024).
- 11 percentage points higher was the probability of loneliness for separated or widowed people than for married people in the EU in 2022, after accounting for other characteristics (Berlingieri et al., Loneliness in Europe, 2024).
- Around 30 million adults in Europe frequently feel lonely and more than 75 million meet family or friends at most once a month, the JRC estimated in 2018 from European survey data (European Commission Joint Research Centre, 2018).
- 16% of people living alone in the EU felt lonely more than half of the time in 2016, against about 7% of those living with a partner, and 14% of single parents (European Commission Joint Research Centre, 2021).
- 30% of people in bad health in the EU felt lonely more than half of the time in 2016, against 8% of people in good health (European Commission Joint Research Centre, 2021).
- 13.7% of people aged 46-90 in Germany were lonely in June-July 2020, about 1.5 times the roughly 9% of 2014 and 2017, on the De Jong Gierveld scale in the German Ageing Survey (Huxhold and Tesch-Römer, German Centre of Gerontology, 2021).
- About 1 in 11 people aged 43+ in Germany felt very lonely, scoring above the midpoint of the De Jong Gierveld scale in the German Ageing Survey, pooled 2017 and 2023 waves (Franz, Stuth and Huxhold, German Centre of Gerontology, 2025).
- 32.6% of adults with a severe disability (degree 50 or more) in Germany agreed that they often feel lonely in 2023, against 20.1% of adults without a disability (BMBFSFJ, Einsamkeitsbarometer 2026).
- 44% of adults with disabilities who live alone in Germany agreed that they often feel lonely in 2023, against 23.8% of adults with disabilities who do not live alone (BMBFSFJ, Einsamkeitsbarometer 2026).
- 111 measures make up Germany's first federal strategy against loneliness, adopted by the cabinet on 13 December 2023 after the examples of Japan and the United Kingdom (BMFSFJ, 2023).
- 24% of people aged 15+ in France said they regularly feel lonely in 2024, about 1 in 4 (Fondation de France, Solitudes 2024).
- 7% of people aged 15+ in France felt lonely every day or almost every day in July 2024 (Fondation de France, Solitudes 2024).
- 42% of people in France's poorest fifth of households felt lonely at least sometimes in the four weeks before the 2022 survey, against 24% in the richest fifth (INSEE, France portrait social, 2025).
- 3% of people aged 16+ in France were isolated from both family and friends in 2015, with at most one meeting or remote contact a month with their network, against 4% in 2006 (INSEE, Insee Première, 2019).
- 8% of people aged 16+ in France felt lonely all or most of the time in 2015, and 62% of them were isolated from neither family nor friends (INSEE, Insee Première, 2019).
- 30.9% of people in Ireland unable to work because of long-standing health problems felt lonely at least sometimes in the four weeks before their 2024 SILC interview, against 13.5% of retired people and 12.5% of employed people (CSO, SILC 2024 well-being).
- 7.0% of adults aged 50+ in Ireland often felt lonely, and almost a third felt emotional loneliness at least some of the time (TILDA, Trinity College Dublin, 2019).
- 15.8% of people living alone in the Netherlands were strongly lonely in 2025, against 10.1% of all people aged 15+ (Statistics Netherlands, StatLine).
- 67% of people in the Netherlands with less than weekly contact with family, friends or neighbours did not feel strongly lonely in 2024, showing that little contact and loneliness are not the same (Statistics Netherlands, 2025).
- 18% of single parents and 14% of people living alone in the Netherlands were strongly lonely in 2024, against 7% to 8% of people in couples with or without children (Statistics Netherlands, 2025).
- 8% of adults in the Netherlands were strongly lonely in 2012, rising to 14% in 2022; it was 13% in 2024, on the 11-item De Jong Gierveld scale (RIVM, VZinfo, 2026).
- 9.6% of adults aged 16+ in Denmark showed signs of loneliness in 2023, down from 12.4% in 2021, on the Three-Item Loneliness Scale (Danish National Health Profile, 2024).
- 6% of people in Sweden were often or always bothered by loneliness in 2024, and another 13% sometimes, in the national public health survey (Public Health Agency of Sweden).
- 32% of unemployed adults and nearly 30% of those unable to work in Norway were quite or very much bothered by loneliness, against 14% of people in work (Statistics Norway, Quality of Life Survey, 2026).
- 34.5% of people living alone in Spain felt unwanted loneliness in 2024, double the rate of those living with others, and 62.2% of those living alone because they have no one to live with (Observatorio Estatal de la Soledad No Deseada barometer, 2024).
- 67.7% of people in Spain who felt unwanted loneliness in 2024 had felt it for more than two years (Observatorio Estatal de la Soledad No Deseada barometer, 2024).
- 36.3% of unemployed people in Spain felt unwanted loneliness in 2024, more than twice the 16.2% of people in work (Observatorio Estatal de la Soledad No Deseada barometer, 2024).
- 6.5% of people aged 16+ in Italy felt lonely always or almost always in the past four weeks in 2021 (ISTAT, BES 2022).
- 23% of adults in Belgium were severely lonely in June 2024 and 33% moderately lonely, on the 6-item De Jong Gierveld scale in a national online cohort (Sciensano, BELHEALTH, 2024).
Japan
- 64.1% of people in Japan who feel lonely often or always said their loneliness had lasted 5 years or more, in December 2025 (Cabinet Office of Japan, national loneliness survey 2025).
| Marital status | Often or always | Scope |
|---|---|---|
| Never-married people aged 16 and over | 9.0% | Never-married people aged 16+ in Japan · Japan · December 2025 |
| Married people aged 16 and over | 2.4% | Married people aged 16+ in Japan · Japan · December 2025 |
| Widowed people aged 16 and over | 3.9% | Widowed people aged 16+ in Japan · Japan · December 2025 |
| Divorced people aged 16 and over | 9.1% | Divorced people aged 16+ in Japan · Japan · December 2025 |
South Korea
- 38.2% of South Koreans aged 13 and over feel lonely often or sometimes in daily life (4.7% often, 33.5% sometimes), in the first national measure of loneliness in the country's Social Survey in 2025 (Ministry of Data and Statistics, 2025 Social Survey).
- 48.9% of South Koreans who live alone often or sometimes feel lonely, 10.7 points above the 38.2% for the population as a whole (Ministry of Data and Statistics, One-person households in statistics 2025).
- 4.7% of South Koreans aged 13 and over feel lonely often in daily life, the strongest answer offered, in 2025 (Ministry of Data and Statistics, 2025 Social Survey).
- 58.9% of widowed South Koreans feel lonely often or sometimes in daily life, against 35.5% of those with a spouse, in 2025 (Ministry of Data and Statistics, 2025 Social Survey).
- 57.1% of divorced South Koreans feel lonely often or sometimes in daily life in 2025 (Ministry of Data and Statistics, 2025 Social Survey).
- 35.5% of South Koreans with a spouse feel lonely often or sometimes in daily life in 2025 (Ministry of Data and Statistics, 2025 Social Survey).
- 35.6% of never-married South Koreans aged 13 and over feel lonely often or sometimes in daily life in 2025 (Ministry of Data and Statistics, 2025 Social Survey).
- 63.7% of South Koreans dissatisfied with their lives feel lonely often or sometimes in daily life, more than twice the 27.5% of those satisfied, in 2025 (Ministry of Data and Statistics, 2025 Social Survey).
- 38.7% of South Koreans in urban areas feel lonely often or sometimes in daily life, slightly more than the 36.1% in rural towns and townships, in 2025 (Ministry of Data and Statistics, 2025 Social Survey).
- 15.1% of South Koreans with no social network often feel lonely, against 4.1% of those with one, in 2025 (Ministry of Data and Statistics, 2025 Social Survey).
- 451.3 billion won over five years is the budget of "Seoul Without Loneliness", the city-wide plan Seoul announced in October 2024, including a 24-hour loneliness hotline (Seoul Metropolitan Government, 2024).
- 13,000 counselling sessions were handled in five months by "Goodbye Loneliness 120", Seoul's 24-hour loneliness hotline launched as a pilot on 1 April 2025, more than four times its target of 3,000 for the year (Seoul Metropolitan Government, 2025).
| Monthly household income | Often or sometimes | Scope |
|---|---|---|
| Under 1 million won a month | 57.6% | People aged 13+ in households with an income of under 1 million won a month · South Korea · May 2025 (fieldwork 14-29 May 2025) |
| 1 million to under 2 million won | 44.9% | People aged 13+ in households with an income of 1 million to under 2 million won a month · South Korea · May 2025 (fieldwork 14-29 May 2025) |
| 2 million to under 3 million won | 39.7% | People aged 13+ in households with an income of 2 million to under 3 million won a month · South Korea · May 2025 (fieldwork 14-29 May 2025) |
| 3 million to under 4 million won | 36.8% | People aged 13+ in households with an income of 3 million to under 4 million won a month · South Korea · May 2025 (fieldwork 14-29 May 2025) |
| 4 million to under 5 million won | 36.7% | People aged 13+ in households with an income of 4 million to under 5 million won a month · South Korea · May 2025 (fieldwork 14-29 May 2025) |
| 5 million to under 6 million won | 32.3% | People aged 13+ in households with an income of 5 million to under 6 million won a month · South Korea · May 2025 (fieldwork 14-29 May 2025) |
| 6 million won or more | 33.0% | People aged 13+ in households with an income of 6 million won a month or more · South Korea · May 2025 (fieldwork 14-29 May 2025) |
China, India and other countries
| Country | Lonely | Scope |
|---|---|---|
| India | 17.8% | Adults aged 50+ in India (SAGE wave 1) · India · 2007-2010 |
| Mexico | 15.3% | Adults aged 50+ in Mexico (SAGE wave 1) · Mexico · 2007-2010 |
| Russia | 10.9% | Adults aged 50+ in Russia (SAGE wave 1) · Russia · 2007-2010 |
| Ghana | 10.7% | Adults aged 50+ in Ghana (SAGE wave 1) · Ghana · 2007-2010 |
| South Africa | 9.9% | Adults aged 50+ in South Africa (SAGE wave 1) · South Africa · 2007-2010 |
| China | 5.5% | Adults aged 50+ in China (SAGE wave 1) · China · 2007-2010 |
| Study area | Lonely | Scope |
|---|---|---|
| Mexico | 32.4% | People aged 65+ in 10/66 study catchment areas, Mexico · Mexico · 2003-2007 |
| Puerto Rico | 32.2% | People aged 65+ in 10/66 study catchment areas, Puerto Rico · Puerto Rico · 2003-2007 |
| Dominican Republic | 30.0% | People aged 65+ in 10/66 study catchment areas, Dominican Republic · Dominican Republic · 2003-2007 |
| Peru | 29.5% | People aged 65+ in 10/66 study catchment areas, Peru · Peru · 2003-2007 |
| Cuba | 27.9% | People aged 65+ in 10/66 study catchment areas, Cuba · Cuba · 2003-2007 |
| Venezuela | 25.3% | People aged 65+ in 10/66 study catchment areas, Venezuela · Venezuela · 2003-2007 |
| India | 18.3% | People aged 65+ in 10/66 study catchment areas, India · India · 2003-2007 |
| China | 3.8% | People aged 65+ in 10/66 study catchment areas, China · China · 2003-2007 |
Canada, Australia, New Zealand and Latin America
- 45.4% of Australians with a mental health condition agreed that they often feel very lonely in 2025, against 13.6% of those without one (Australian Bureau of Statistics, General Social Survey 2025).
- 31.1% of Australians with disability agreed that they often feel very lonely in 2025, against 12.3% of those without disability (Australian Bureau of Statistics, General Social Survey 2025).
- 23.1% of Australians in remote areas agreed that they often feel very lonely in 2025, against 17.8% in major cities (Australian Bureau of Statistics, General Social Survey 2025).
- 14.8% of recent migrants and temporary residents in Australia agreed that they often feel very lonely in 2025, against 18.1% of people born in Australia (Australian Bureau of Statistics, General Social Survey 2025).
- 47% of Australians with low life satisfaction (4 or below out of 10) often felt very lonely in 2025 (Australian Bureau of Statistics, General Social Survey 2025).
- 28.5% of LGBTQ2+ people in Canada felt lonely always or often in October-December 2024, against 13.4% of all people aged 15 and over (Statistics Canada, Canadian Social Survey).
- 21.7% of people with a disability, difficulty or long-term condition in Canada felt lonely always or often in October-December 2024, against 13.4% of all people aged 15 and over (Statistics Canada, Canadian Social Survey).
- 15.8% of immigrants who arrived in the last 10 years in Canada felt lonely always or often in October-December 2024, against 13.4% of all people aged 15 and over (Statistics Canada, Canadian Social Survey).
- 12.0% of people in rural areas in Canada felt lonely always or often in October-December 2024, against 13.4% of all people aged 15 and over (Statistics Canada, Canadian Social Survey).
- 24% of people in Canada who lived alone felt lonely always or often in August-September 2021, more than twice the 11% of those living with others (Statistics Canada, Canadian Social Survey, 2021).
- 21% of people in Canada who were not married or living common-law felt lonely always or often in August-September 2021, 3 times the 7% of those in a couple (Statistics Canada, Canadian Social Survey, 2021).
- 49% of people in Canada who felt lonely always or often rated their mental health fair or poor, against 7% of those rarely or never lonely, in August-September 2021 (Statistics Canada, Canadian Social Survey, 2021).
- 10% of Canadians aged 15 and over connected with friends only by phone or online in the month before the 2025 survey, 88% both virtually and in person and 2% only in person (Statistics Canada, Survey on Social Connections, 2025).
- 12.7% of Chileans in the lowest income fifth felt lonely always or almost always in the past four weeks in 2025, against 6.6% in the highest (Ministry of Social Development and Family, Encuesta de Bienestar Social 2025).
- 13.9% of Chileans with a disability felt lonely always or almost always in the past four weeks in 2023, the highest of the groups reported (Ministry of Social Development and Family, Encuesta de Bienestar Social 2023).
Ministers, laws and strategies
- 11 leaders from policy, research and civil society make up the WHO Commission on Social Connection, which the WHO Director-General set up in November 2023 for 2024-2026 (WHO Executive Board, 2025).
- 69 of the 153 countries in the WHO loneliness estimates had no data source other than the Meta-Gallup survey, which asked "In general, how lonely do you feel?" with no time frame (WHO Commission on Social Connection, 2025).
- 8 or 9 out of 9 on the 3-item UCLA Loneliness Scale was the cut-off WHO used for "very lonely", the definition behind its global estimates, copied from the EU JRC loneliness survey; on a single question it counted feeling lonely all or most of the time in the past four weeks (WHO Commission on Social Connection, 2025).
- 10 years of data (2014-2023) were averaged into a single estimate because trends in loneliness by age, gender and place could not be estimated from the data available (WHO Commission on Social Connection, 2025).
- 8 of 194 WHO Member States, all high-income, had a national policy, strategy, action plan, law or advisory directly addressing social connection as of November 2024: Denmark, Finland, Germany, Japan, the Netherlands, Sweden, the United Kingdom and the United States (WHO Commission on Social Connection, 2025).
- 2023 is the year Japan passed its Act on the Advancement of Measures to Address Loneliness and Isolation, the only national law among the policy documents reviewed by the WHO Commission on Social Connection (WHO, 2025).
More charts

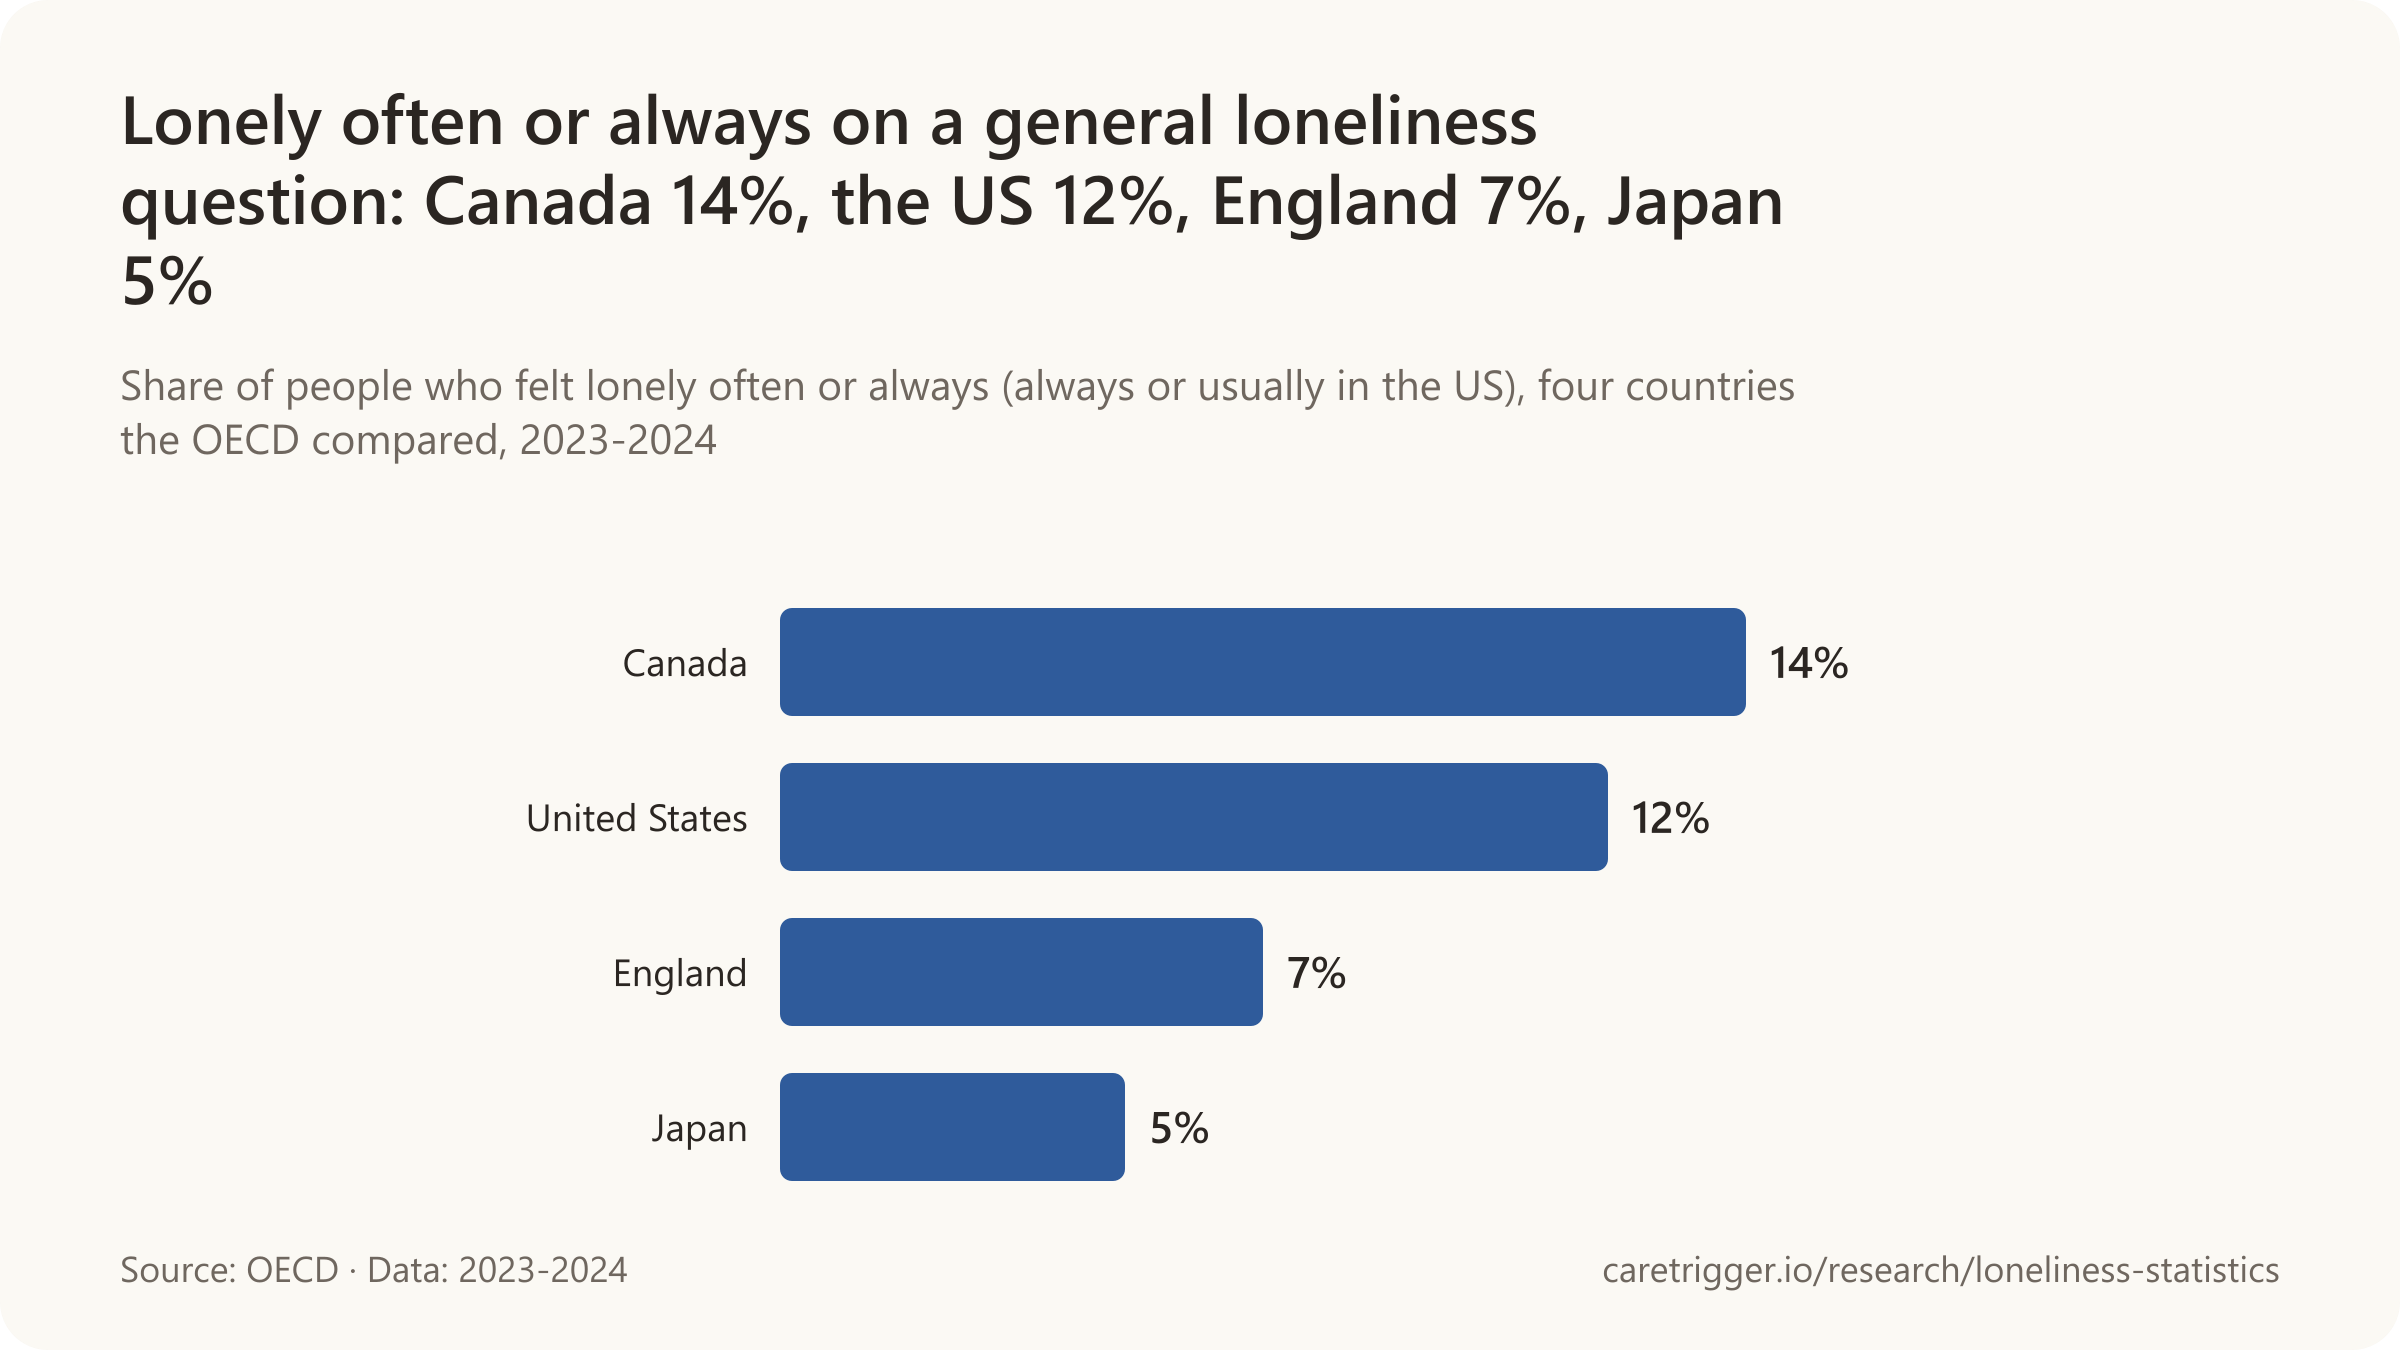
Other figures
- 5% of adults in England reported feeling lonely often or always in 2016-17, and people living alone were significantly more likely to report loneliness often/always or some of the time than those living with others (ONS, Community Life Survey analysis, 2018).
- 13% of people in the EU felt lonely most or all of the time in the previous four weeks and 35% at least some of the time, in the first EU-wide loneliness survey (European Commission Joint Research Centre, EU-LS 2022).
- 11.2% of people aged 16 and over in the EU had no one to rely on in case of need in 2022, up from 7.7% in 2018 (Eurostat, EU-SILC, 2024).
- 7.3% of people aged 16 and over in the EU felt left out of society in 2022, rising to 9.0% of those aged 75 and over (Eurostat, EU-SILC, 2026).
- 10.4% of people living in one-adult households in the EU felt left out of society in 2022, against 7.3% of all people aged 16 and over (Eurostat, EU-SILC, 2026).
- 12% of people in the EU felt lonely more than half of the time in 2016, before the pandemic (Baarck et al., Health Policy, 2022).
- 25% of people in the EU felt lonely more than half of the time in the first months of the COVID-19 pandemic (April-July 2020), double the 12% of 2016 (Baarck et al., Health Policy, 2022).
- Almost 20% of people in Greece felt lonely more than half of the time in 2016, against less than 5% in Denmark and the Netherlands (Baarck et al., Health Policy, 2022).
- 19% of the general population in (West) Germany reported loneliness in 1949, in repeated surveys that later hovered between 4% and 8% from 1973 to 1995 (Dykstra, European Journal of Ageing, 2009).
- 12% of the general population in (West) Germany reported loneliness in 1963, in repeated surveys that later hovered between 4% and 8% from 1973 to 1995 (Dykstra, European Journal of Ageing, 2009).
- 17.6% of people aged 50 and over in England were lonely on the 3-item UCLA scale in 2014, higher than in all but 2 of 14 European SHARE countries measured the same way, the exceptions being Italy at 20.2% and Czechia at 17.8% (Tapia-Muñoz et al., PLOS ONE, 2022).
- 9% of adults aged 50+ in England felt persistently highly lonely across the 10 years from 2008/09 to 2018/19, one of five loneliness trajectories found in the English Longitudinal Study of Ageing (Di Gessa et al., Social Science & Medicine, 2025).
- 20.5% of Australians aged 15 and over agreed that they often feel very lonely in 2023, after a fall from 21.7% in 2001 to 18.5% in 2013, on the single-item measure of the HILDA survey (Hagani et al., International Journal of Epidemiology, 2026).
- 9.9% of Australians were chronically lonely (agreeing in two or more consecutive years that they often feel very lonely) in 2023, up from a low of 8.0% in 2011, in the HILDA survey (Hagani et al., International Journal of Epidemiology, 2026).
- 34% of Australians aged 15 and over were lonely in at least one year between 2014 and 2018, including 13% who were chronically lonely for two or more consecutive years, against 17% who were socially isolated (Lim et al., Scientific Reports, 2023).
- 16% of adults aged 15 and over in OECD countries (median of 38 countries) felt loneliness a lot of the previous day in 2023-2024 (Gallup World Poll, 2025).
- 3 OECD countries, the United States, Iceland and Denmark, were the only ones where young men aged 15-34 were lonelier than other adults; in Iceland and Denmark 15% of young men felt lonely against 10% and 9% of everyone else (2023-2024) (Gallup World Poll, 2025).
- 14% of women aged 35-54 in OECD countries (median) felt loneliness a lot of the previous day, against 20% of US women that age, in 2023-2024 (Gallup World Poll, 2025).
- 20% of employees worldwide felt loneliness a lot of the previous day, against 32% of unemployed adults, in Gallup's State of the Global Workplace survey (Gallup, 2024).
- 25% of fully remote employees worldwide felt loneliness a lot of the previous day, against 16% of those working only on-site and 21% of hybrid workers (Gallup, 2024).
- 38.9% of adults in 8 countries (Brazil, France, India, Indonesia, Nigeria, the Philippines, Türkiye and the United States) had felt alone at some time in the past 12 months in 2023-2024 (Abdalla et al., Social Psychiatry and Psychiatric Epidemiology, 2026).
- 48.9% of adults in the Philippines had felt alone in the past 12 months, the highest of 8 countries surveyed in 2023-2024 (Abdalla et al., Social Psychiatry and Psychiatric Epidemiology, 2026).
- 19.2% of adults in India had felt alone in the past 12 months, the lowest of 8 countries surveyed in 2023-2024 (Abdalla et al., Social Psychiatry and Psychiatric Epidemiology, 2026).
- 30% of Chinese adults aged 55 and over, approximately, reported feeling lonely in 2011-2018, and at 55 they can expect to spend 7-10 of their remaining years lonely (Wang, Journals of Gerontology: Social Sciences, 2024).
- 16.8% of Brazilians aged 50 and over said they always felt alone or lonely in 2015-2016, 31.7% sometimes and 51.5% never (Sandy Júnior et al., Cadernos de Saúde Pública, 2023).
- 42% of Mexican adults aged 50 and over had at least mild loneliness on the 3-item UCLA scale and 53% were socially isolated in 2015 (Kammar-García et al., BMC Geriatrics, 2023).
- 62.1% of people living alone in Seoul were lonely on the 20-item UCLA loneliness scale in 2021, and 13.6% were socially isolated with no one to turn to for help (Park & Kim, Health and Social Welfare Review, 2022).
Numbers we will not publish. "Türkiye is the loneliest country in the world" comes from a composite "loneliness score" by an entertainment platform that mixes loneliness, sadness and household data and publishes no method. Country percentages credited to "The Human Index" have no method we could see.
Ministers, laws and strategies. The UK named a minister for loneliness in 2018 and published the world's first loneliness strategy; Japan appointed a minister in 2021 and passed a law on loneliness and isolation in 2023, in force since April 2024; the World Health Assembly adopted its first resolution on social connection in May 2025. Of 194 WHO member states, 8, all high-income, had a national policy directly on social connection when the WHO Commission reported.
Sources: Gallup (2023-2026); World Health Organization (2025); OECD (2025); The BMJ; Department for Culture, Media and Sport and Ministry of Housing, Communities and Local Government; Department for Culture, Media and Sport (2022, 2025, 2026); Department for Digital, Culture, Media and Sport (2019, 2020, 2022); Office for National Statistics (2018-2026); The Executive Office, Programme for Government Analytics; Scottish Government (2023, 2024, 2025); Age UK; Campaign to End Loneliness; Springer (2024); European Commission, Joint Research Centre (2021, 2023); German Centre of Gerontology, dza aktuell 04/2021; German Centre of Gerontology, dza aktuell 03/2025; Federal Ministry of Education, Family Affairs, Senior Citizens, Women and Youth; Federal Ministry for Family Affairs, Senior Citizens, Women and Youth; Fondation de France, survey by Crédoc (2025); INSEE (2019, 2025); Central Statistics Office, Ireland; The Irish Longitudinal Study on Ageing, Trinity College Dublin; Statistics Netherlands (2025, 2026); RIVM, VZinfo, data; National Institute of Public Health, University of Southern Denmark, for the Danish Health Authority; Public Health Agency of Sweden; Statistics Norway; Observatorio Estatal de la Soledad No Deseada: Fundación ONCE and Fundación AXA, fieldwork by Fresno Consulting; ISTAT; Sciensano, BELHEALTH cohort; Cabinet Office of Japan (2024, 2025, 2026); Cabinet Office, Government of Japan; Ministry of Data and Statistics; Ministry of Data and Statistics, Republic of Korea; Seoul Metropolitan Government (2024, 2025); Ministry of Health and Welfare, South Korea; International Journal of Geriatric Psychiatry; International Journal of Public Health; Australian Bureau of Statistics (2026); Statistics Canada (2021, 2025); Ministry of Social Development and Family, Chile (2024, 2026); Eurostat (2024, 2026); Health Policy; European Journal of Ageing; PLOS ONE; Social Science & Medicine; International Journal of Epidemiology; Scientific Reports; Social Psychiatry and Psychiatric Epidemiology; The Journals of Gerontology, Series B; Cadernos de Saúde Pública; BMC Geriatrics; Health and Social Welfare Review
06 / Older adults
How many older adults are lonely?
One in three Americans aged 50 to 80, 33.4%, felt a lack of companionship some of the time or often in 2024 (JAMA).

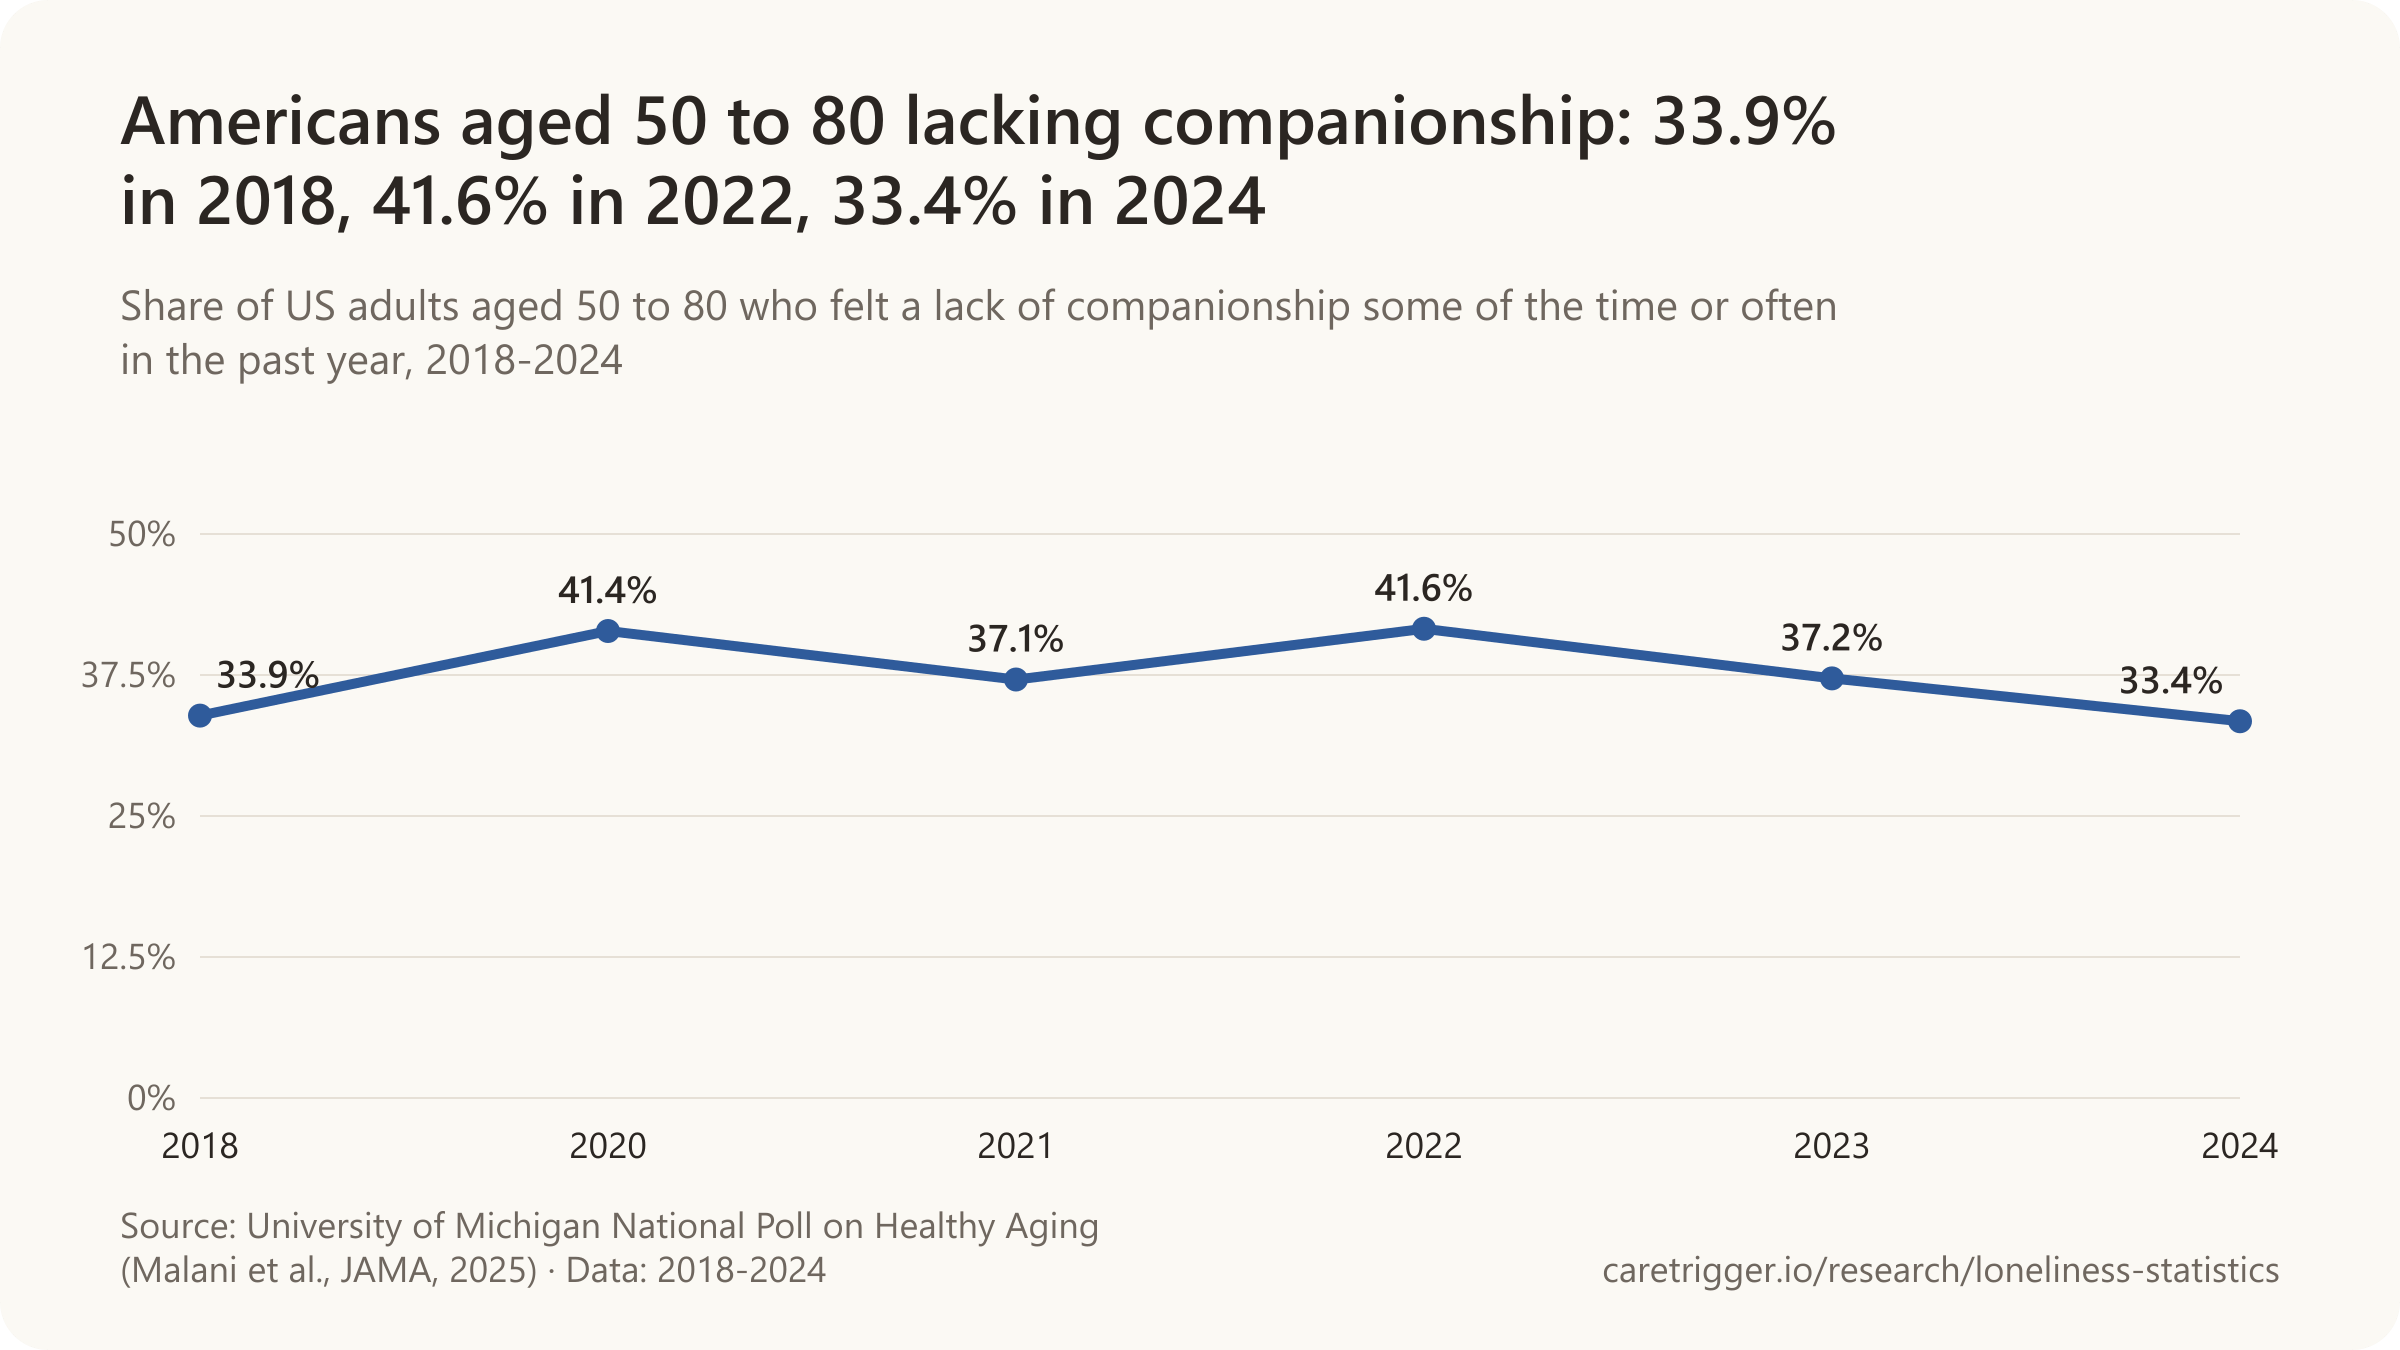
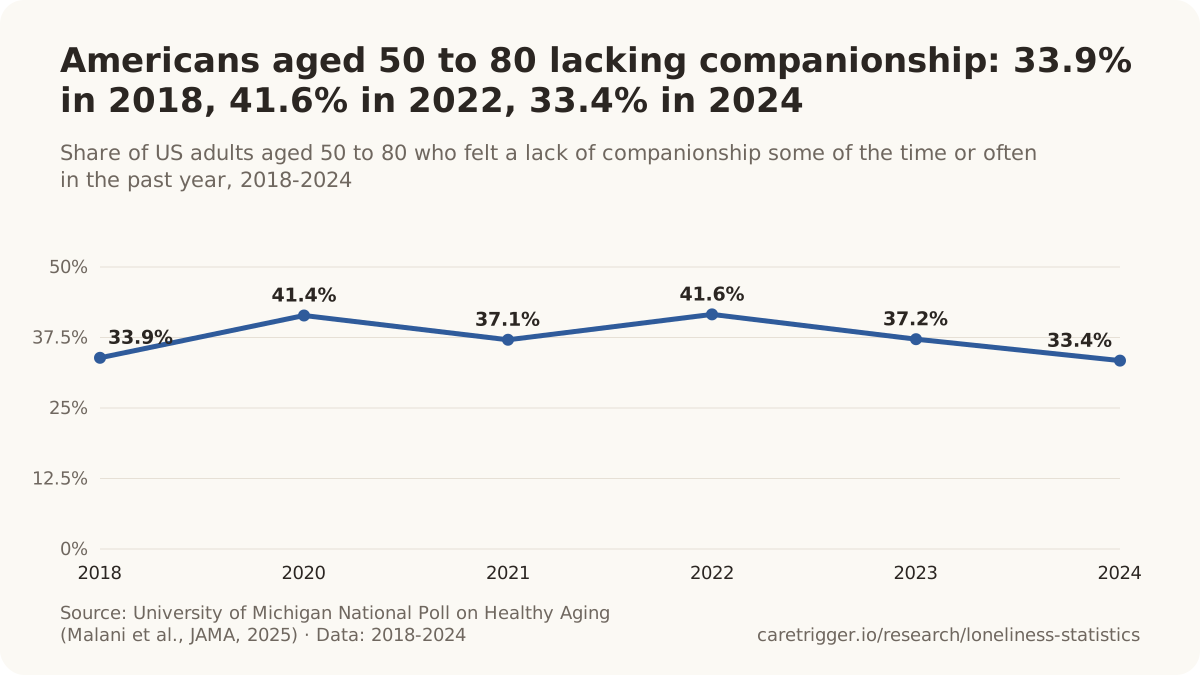
- On a stricter question, 6% of Americans 65 and older feel lonely or isolated all or most of the time (Pew Research Center, 2025).
- 27.6% of adults 60 and older were lonely, pooling 126 studies of 1.25 million older adults in 62 countries (2025).
- 940,000 people 65 and older in the UK, 7%, are often lonely, by a charity's analysis of a national survey (Age UK, 2024).
- 135 million people 65 and older in 142 countries felt very or fairly lonely, even though their rate was the lowest (Meta-Gallup).
| Country | Most or all of the time |
|---|---|
| Romania | 20.1% |
| Bulgaria | 17.7% |
| Croatia | 16.2% |
| Lithuania | 14.5% |
| Hungary | 14.0% |
| Luxembourg | 4.4% |
| Ireland | 4.1% |
| Norway | 3.6% |
| Switzerland | 3.4% |
| Denmark | 2.7% |
Figures for "older adults" differ mainly by question and age band: a stricter question ("all or most of the time") gives single digits, a broader one ("some of the time or often") a third. The 43% and 24% often quoted for older Americans are from 2002 and 2011.
Sources: JAMA; Pew Research Center; Humanities and Social Sciences Communications; Age UK; Gallup; The Journals of Gerontology: Series B; OECD
More statistics (89)
33.4% of US adults aged 50-80 said they felt a lack of companionship some of the time or often in the past year in March 2024 (Malani et al., JAMA, 2025).
- 6% of US adults aged 65 and older said they feel lonely or isolated all or most of the time in September 2025, 29% sometimes and 65% hardly ever or never (Pew Research Center, 2025).
Meta-analyses
- 27.6% of adults aged 60 and over were lonely, pooling 126 studies of 1,250,322 older adults in 62 countries, with pandemic-era data excluded (Salari et al., Humanities and Social Sciences Communications, 2025).
- 26% of adults aged 60 and over were lonely, pooling 70 studies of 462,083 older adults on six continents (Susanty et al., Archives of Gerontology and Geriatrics, 2025).
| Continent | Lonely | Scope |
|---|---|---|
| North America | 38% | adults aged 60+; loneliness as measured in each study (pooled by continent) · North America · studies to April 2024 |
| Africa | 34% | adults aged 60+; loneliness as measured in each study (pooled by continent) · Africa · studies to April 2024 |
| Asia | 32% | adults aged 60+; loneliness as measured in each study (pooled by continent) · Asia · studies to April 2024 |
| South America | 32% | adults aged 60+; loneliness as measured in each study (pooled by continent) · South America · studies to April 2024 |
| Europe | 23% | adults aged 60+; loneliness as measured in each study (pooled by continent) · Europe · studies to April 2024 |
| Oceania | 13% | adults aged 60+; loneliness as measured in each study (pooled by continent) · Oceania · studies to April 2024 |
| Continent | Lonely | Scope |
|---|---|---|
| North America | 30.5% | adults aged 60+; loneliness as measured in each study (pooled by continent) · North America · studies 1979-2024 (COVID-19 period data excluded) |
| Asia | 27.9% | adults aged 60+; loneliness as measured in each study (pooled by continent) · Asia · studies 1979-2024 (COVID-19 period data excluded) |
| Europe | 27.2% | adults aged 60+; loneliness as measured in each study (pooled by continent) · Europe · studies 1979-2024 (COVID-19 period data excluded) |
| Oceania | 25.7% | adults aged 60+; loneliness as measured in each study (pooled by continent) · Oceania · studies 1979-2024 (COVID-19 period data excluded) |
| Africa | 15.3% | adults aged 60+; loneliness as measured in each study (pooled by continent) · Africa · studies 1979-2024 (COVID-19 period data excluded) |
United States
- In 2011, 24% of community-dwelling Americans aged 65 and over, about 7.7 million people, were socially isolated, including 1.3 million (4%) who were severely isolated, by a typology combining living arrangement, discussion network, religious attendance and social participation (Cudjoe et al., Journals of Gerontology B, 2020).
- 43% of US adults over 60 reported feeling lonely in the 2002 Health and Retirement Study psychosocial module, although only 18% lived alone (Perissinotto, Stijacic Cenzer & Covinsky, Archives of Internal Medicine, 2012).
- The National Academies' 2020 consensus report states that approximately one-quarter (24 percent) of community-dwelling Americans aged 65 and older are socially isolated, and that 43 percent of adults aged 60 and older report feeling lonely (NASEM, 2020).
- 14% of Americans aged 60 and older spend all their daily measured time alone, against 8% of people under 60 (Pew Research Center analysis of American Time Use Survey data, 2019).
The UK and Europe
- 940,000 people aged 65+ in the UK, 7% or 1 in 14, are often lonely, according to a charity's analysis of the Understanding Society survey collected in 2022-24 (Age UK, 2024).
- Age UK projects that by 2034 there will be 1.2 million people over 65 in England who often feel lonely, without urgent action.
- 5% of people aged 75 and over in England feel lonely often or always (4% of those aged 65-74), below the 7% average for adults aged 16+ (DCMS Community and Engagement Survey 2025/26).
- 14.5% of people aged 65 and over in Lithuania felt lonely most or all of the time in the past four weeks in 2022, against 6.2% of those aged 16 to 24 (OECD analysis of EU-SILC, 2025).
- 14.0% of people aged 65 and over in Hungary felt lonely most or all of the time in the past four weeks in 2022, against 3.3% of those aged 16 to 24 (OECD analysis of EU-SILC, 2025).
- 4.4% of people aged 65 and over in Luxembourg felt lonely most or all of the time in the past four weeks in 2022, against 2.5% of those aged 16 to 24 (OECD analysis of EU-SILC, 2025).
- 4.1% of people aged 65 and over in Ireland felt lonely most or all of the time in the past four weeks in 2022, against 6.0% of those aged 16 to 24 (OECD analysis of EU-SILC, 2025).
- 3.6% of people aged 65 and over in Norway felt lonely most or all of the time in the past four weeks in 2022, against 3.0% of those aged 16 to 24 (OECD analysis of EU-SILC, 2025).
- 3.4% of people aged 65 and over in Switzerland felt lonely most or all of the time in the past four weeks in 2022, against 5.6% of those aged 16 to 24 (OECD analysis of EU-SILC, 2025).
- 2.7% of people aged 65 and over in Denmark felt lonely most or all of the time in the past four weeks in 2022, against 9.2% of those aged 16 to 24 (OECD analysis of EU-SILC, 2025).
- 20.1% of people aged 65 and over in Romania felt lonely most or all of the time in the past four weeks in 2022, against 1.6% of those aged 16 to 24 (OECD analysis of EU-SILC, 2025).
- 17.7% of people aged 65 and over in Bulgaria felt lonely most or all of the time in the past four weeks in 2022, against 1.3% of those aged 16 to 24 (OECD analysis of EU-SILC, 2025).
- 16.2% of people aged 65 and over in Croatia felt lonely most or all of the time in the past four weeks in 2022, against 0.1% of those aged 16 to 24 (OECD analysis of EU-SILC, 2025).
- 3.2% of people aged 65 and over in France felt lonely all of the time in the past four weeks in 2015, against 2.5% of all adults (INSEE survey data compiled by the OECD, 2025).
- 3.0% of people aged 65 and over in France felt lonely all of the time in the past four weeks in 2018, against 2.0% of all adults (INSEE survey data compiled by the OECD, 2025).
- 4.8% of people aged 65 and over in France felt lonely all of the time in the past four weeks in 2022, against 3.6% of all adults (INSEE survey data compiled by the OECD, 2025).
- 18.6% of people aged 80+ without a partner in Germany felt lonely most or all of the time in the past week in 2020-21, about 5 times the 3.9% of those married or with a partner (D80+ study, ceres and German Centre of Gerontology, 2022).
- 20.8% of people aged 80+ in Germany who rated their health poor or very poor felt lonely most or all of the time in the past week in 2020-21, against 6.7% of those in good or very good health (D80+ study, ceres and German Centre of Gerontology, 2022).
- 8.1% of people aged 80+ in Germany with 9 or more important people in their network felt lonely most or all of the time in the past week in 2020-21, against almost 15% of those with fewer than 4 (D80+ study, ceres and German Centre of Gerontology, 2022).
- 13% of people aged 60+ in France felt lonely often or every day in 2025, about 2.5 million people, down from 14% in 2021 but above 11% in 2017 (Petits Frères des Pauvres barometer, 2025).
- 11% of people aged 65+ in France felt lonely most or all of the time in the four weeks before the 2022 survey, our sum of INSEE's 4% all the time and 7% most of the time (INSEE, France portrait social, 2025).
- 18% of people aged 80+ living at home in France had no contact with friends in 2015, against 6% of those aged 60-79, while 3% had no contact with family (DREES, CARE-Ménages survey, 2022).
- 60% of people aged 85+ in the Netherlands were lonely in 2024, against 49% of those aged 75-84 and 51% of all people aged 75+, on the 11-item De Jong Gierveld scale (RIVM, VZinfo, 2026).
| Country | Most or all of the time | Scope |
|---|---|---|
| Greece | 13.9% | People aged 65+ (EU-SILC 2022); felt lonely most or all of the time in the past 4 weeks · Greece · 2022 |
| France | 12.7% | People aged 65+ (EU-SILC 2022); felt lonely most or all of the time in the past 4 weeks · France · 2022 |
| Portugal | 12.4% | People aged 65+ (EU-SILC 2022); felt lonely most or all of the time in the past 4 weeks · Portugal · 2022 |
| Estonia | 12.0% | People aged 65+ (EU-SILC 2022); felt lonely most or all of the time in the past 4 weeks · Estonia · 2022 |
| Latvia | 10.7% | People aged 65+ (EU-SILC 2022); felt lonely most or all of the time in the past 4 weeks · Latvia · 2022 |
| Finland | 10.3% | People aged 65+ (EU-SILC 2022); felt lonely most or all of the time in the past 4 weeks · Finland · 2022 |
| Poland | 9.7% | People aged 65+ (EU-SILC 2022); felt lonely most or all of the time in the past 4 weeks · Poland · 2022 |
| Czechia | 9.3% | People aged 65+ (EU-SILC 2022); felt lonely most or all of the time in the past 4 weeks · Czechia · 2022 |
| Belgium | 7.8% | People aged 65+ (EU-SILC 2022); felt lonely most or all of the time in the past 4 weeks · Belgium · 2022 |
| Slovakia | 7.8% | People aged 65+ (EU-SILC 2022); felt lonely most or all of the time in the past 4 weeks · Slovakia · 2022 |
| Italy | 7.8% | People aged 65+ (EU-SILC 2022); felt lonely most or all of the time in the past 4 weeks · Italy · 2022 |
| Spain | 7.7% | People aged 65+ (EU-SILC 2022); felt lonely most or all of the time in the past 4 weeks · Spain · 2022 |
| Slovenia | 7.6% | People aged 65+ (EU-SILC 2022); felt lonely most or all of the time in the past 4 weeks · Slovenia · 2022 |
| Sweden | 6.6% | People aged 65+ (EU-SILC 2022); felt lonely most or all of the time in the past 4 weeks · Sweden · 2022 |
| Austria | 5.3% | People aged 65+ (EU-SILC 2022); felt lonely most or all of the time in the past 4 weeks · Austria · 2022 |
| Netherlands | 4.9% | People aged 65+ (EU-SILC 2022); felt lonely most or all of the time in the past 4 weeks · Netherlands · 2022 |
Worldwide and other countries
- 135 million adults aged 65 and over in 142 countries felt very or fairly lonely, even though their 17% rate was the lowest of any age group (Meta-Gallup Global State of Social Connections, a Gallup survey for Meta, 2023).
- 19.2% of Canadians aged 65 and over living in the community were lonely in 2019-2020, an estimated 1.1 million people, on a 3-item loneliness scale (Statistics Canada, Health Reports, 2023).
- 12.5% of married or common-law Canadians aged 65 and over were lonely in 2019-2020 on a 3-item loneliness scale (Statistics Canada, Health Reports, 2023).
- 43.4% of South Koreans aged 65 and over feel lonely often or sometimes in daily life, against 38.2% of all people aged 13 and over, in 2025 (Ministry of Data and Statistics, 2025 Social Survey).
- 42.8% of South Koreans aged 80 and over have no one outside their family or relatives they interact with regularly, against 22.6% of all people aged 13 and over, in 2025 (Ministry of Data and Statistics, 2025 Social Survey).
- 56 million adults aged 65 and over in 142 countries said they did not feel connected to other people at all (Meta-Gallup Global State of Social Connections, a Gallup survey for Meta, 2023).
- 75% of adults aged 65 and over in 142 countries felt very or fairly connected to other people, slightly more than the 71% of 19-29-year-olds (Meta-Gallup Global State of Social Connections, a Gallup survey for Meta, 2023).
- 20% to 34% of older people in China, Europe, Latin America and the United States are lonely, according to the summary of the WHO 2021 advocacy brief, a range stitched together from studies with different measures; the body of the brief gives 3.8% for China in one study and 29.6% in another (WHO, 2021).
Other figures
- A standardised mean difference of 0.02 (95% CI -0.36 to 0.40) at three months showed no significant effect of digital technology interventions on loneliness compared with usual care, pooling trials with older adults whose average age was 73 to 78 (Shah et al., Journal of Medical Internet Research, 2021).
- 25.4% of people aged 65 and over in 12 former communist European countries felt lonely most or all of the time in the past week in 2012, against 10.2% in 16 other European countries and Israel (Rapolienė and Aartsen, European Journal of Ageing, 2022).
- 10.2% of people aged 65 and over in 16 western, northern and southern European countries and Israel felt lonely most or all of the time in the past week in 2012 (Rapolienė and Aartsen, European Journal of Ageing, 2022).
- 27.7% of adults aged 60 and over in eastern European countries were lonely on the 6-item De Jong Gierveld scale, against 11.1% in western European countries (Surkalim et al., BMJ, 2022).
- 5% to 20% of Europeans aged 60 and over said they often feel lonely in a Eurobarometer survey of 12 member states, with the highest rates in southern Europe (Dykstra, European Journal of Ageing, 2009).
- 9.7% of people aged 65+ in Finland felt lonely fairly often or all the time in 2024 (THL, Sotkanet indicator 4286).
- 37.9% of older adults in Africa were lonely (pooled prevalence, 95% CI 30.1-45.6%) in a meta-analysis of 18 studies from 6 countries, though results varied from 9.9% in South Africa to 74.0% in Uganda (Mekonnen et al., Systematic Reviews, 2026).
- 19.6% of Chinese adults aged 60 and over were lonely in 2018, answering "often" to at least one item of the 3-item UCLA loneliness scale (Yu et al., BMC Geriatrics, 2026).
- 13.4% of Indians aged 60 and over felt alone often or most of the time in 2017-2018, about 4,076 of 30,394 respondents (Srivastava & Srivastava, Indian Journal of Psychiatry, 2023).
- 28.6% of older adults were lonely during the COVID-19 pandemic, pooling 30 studies with 28,050 participants conducted up to November 2021 (Su et al., International Psychogeriatrics, 2023).
- 20% to 73% of people at the end of life had moderate or worse loneliness in studies sampling by diagnosis or palliative care, too wide a range to pool across 15 studies (Maun et al., Palliative Medicine, 2026).
- 47.4% of people aged 85, 90 and 95 or over in northern Sweden said they felt lonely sometimes or often (Lampinen et al., European Journal of Ageing, 2022).
- 128,118 people aged 13 to 103 in 9 longitudinal studies from over 20 countries showed the same U-shaped curve: loneliness fell from young adulthood to midlife and rose again in older adulthood (Graham et al., Psychological Science, 2024).
- 12.5% of Swedes aged 77 and over were often or nearly always bothered by loneliness, averaged over six national surveys from 1992 to 2021, with no significant upward trend (Dahlberg et al., Frontiers in Public Health, 2024).
- 34.2% of Swedes aged 77 and over said in 2021-22 that they felt lonelier during the COVID-19 pandemic than before it, while 2.5% felt less lonely (Dahlberg et al., Frontiers in Public Health, 2024).
- 380,000 older adults in Norway could be lonely by 2050, up from 184,000 in 2020 and 286,000 in 2035, as the population ages even with stable or falling rates (Aunsmo et al., Preventive Medicine, 2023).
- 37.1% of older Americans receiving home-delivered meals through the Older Americans Act were lonely in 2021, about the same as in 2019 (37.6%), against 24.8% of congregate meal participants (Menne, Osborne and Pendergrast, Frontiers in Public Health, 2024).
- A standardised mean difference of -0.08 (95% CI -0.33 to 0.17) meant technology-based interventions made little to no difference to loneliness in older adults, pooling 6 randomised trials with 391 participants (Jin et al., Frontiers in Psychology, 2021).
- 12.4% of visually impaired Norwegians aged 66 and over were severely lonely on the Three-Item Loneliness Scale, and 31.1% moderately lonely (Brunes, Hansen and Heir, Health and Quality of Life Outcomes, 2019).
Sources: JAMA; Pew Research Center (2019, 2025); Humanities and Social Sciences Communications; Archives of Gerontology and Geriatrics; The Journals of Gerontology: Series B; Archives of Internal Medicine; National Academies of Sciences, Engineering, and Medicine; Age UK (2024); Department for Culture, Media and Sport, UK Government; OECD (2025); Cologne Center for Ethics, Rights, Economics, and Social Sciences of Health and German Centre of Gerontology; Petits Frères des Pauvres, survey by CSA Research; INSEE; DREES; RIVM, VZinfo, data; Gallup; Statistics Canada; Ministry of Data and Statistics; World Health Organization; Journal of Medical Internet Research; European Journal of Ageing (2009, 2021, 2022); The BMJ; Finnish Institute for Health and Welfare, Sotkanet statistics service; Federal Ministry of Labour, Social Affairs, Health, Care and Consumer Protection; Systematic Reviews; BMC Geriatrics; Indian Journal of Psychiatry; International Psychogeriatrics; Palliative Medicine; Psychological Science; Frontiers in Public Health (2024); Preventive Medicine; General Hospital Psychiatry; Frontiers in Psychology; Health and Quality of Life Outcomes
07 / Isolation
How many older adults are socially isolated?
64% of older Americans were neither lonely nor isolated in 2022-2023; 15% were lonely only, 15% isolated only, 6% both (NHATS).

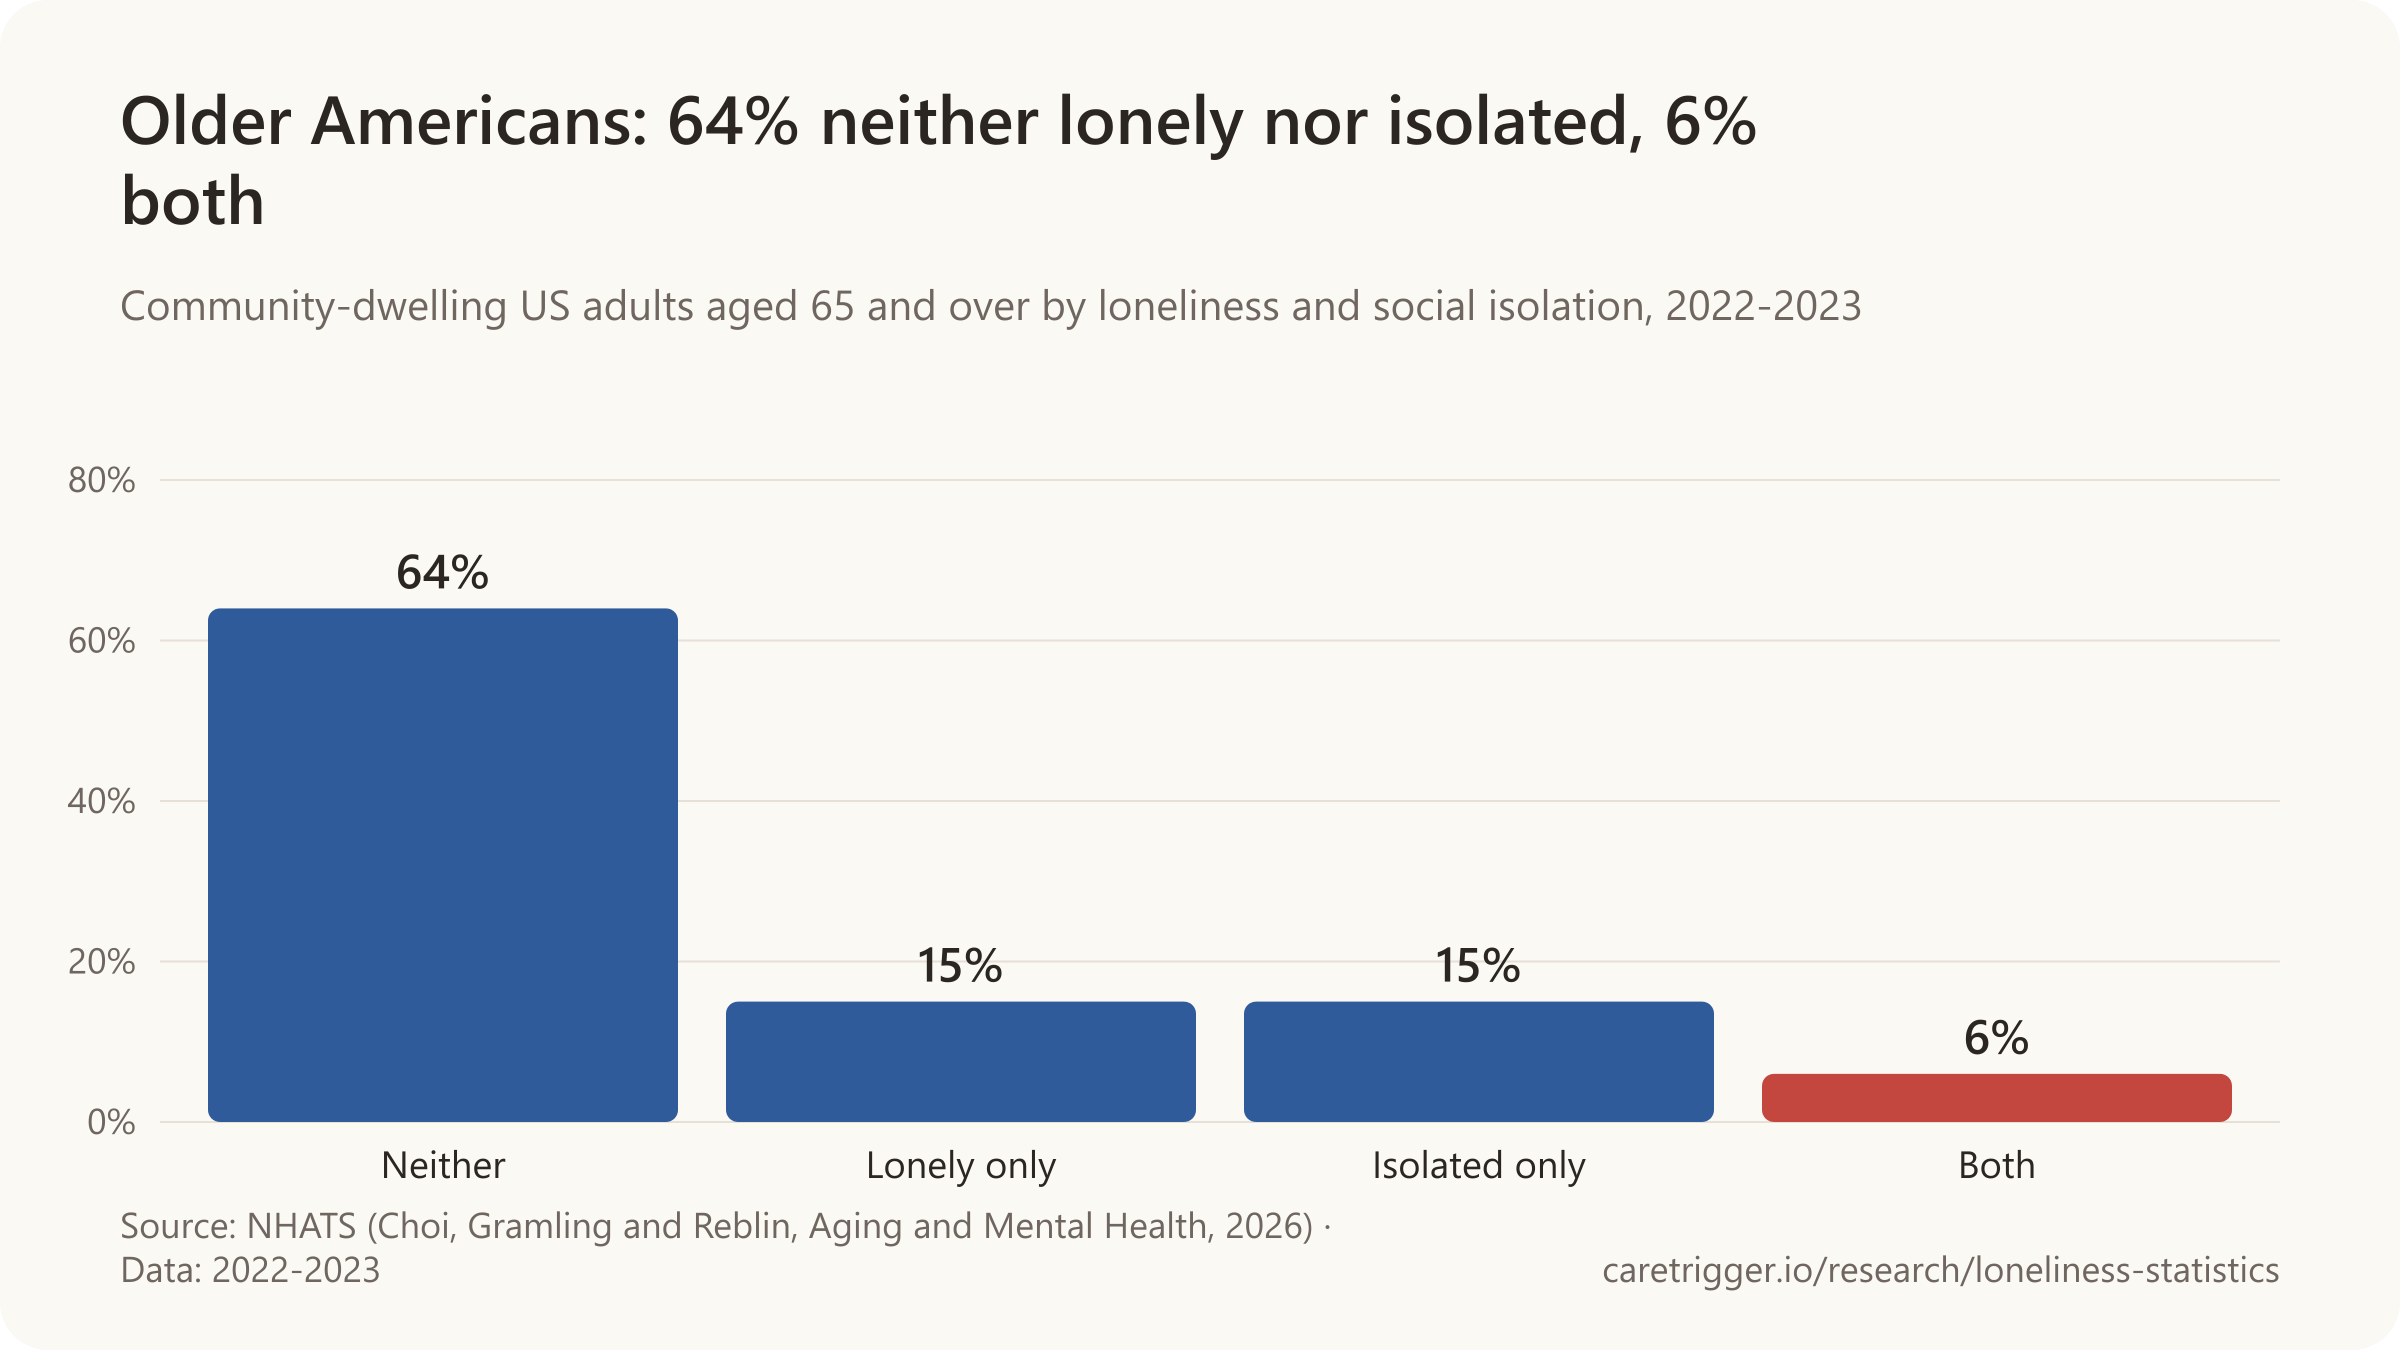
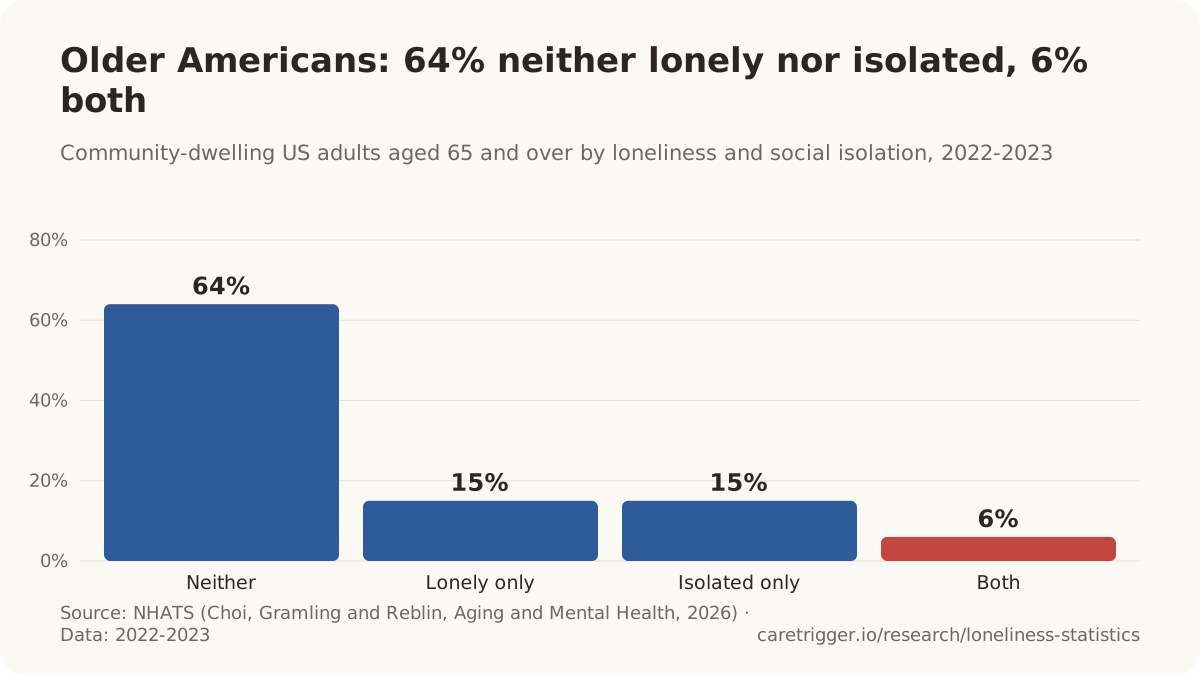
- 11.4% of Europeans 65 and older never met friends in person in 2022, nearly double the 5.9% of 2015 (OECD).
- Two standard measures applied to the same older Americans agreed on who was isolated for only 36.6% of them (2026).
Social isolation is counted from contacts, not feelings: living alone, rarely meeting or talking to others, no one to turn to. Most lonely older people are not isolated and most isolated people are not lonely, and two standard measures disagree on who is isolated more often than they agree.
Sources: Aging and Mental Health; World Health Organization; Ministry of Data and Statistics, South Korea; OECD; Innovation in Aging; Social Psychiatry and Psychiatric Epidemiology
More statistics (53)
64% of community-dwelling older Americans were neither lonely nor socially isolated in 2022-2023, while 15% were lonely but not isolated, 15% isolated but not lonely and 6% both (Choi, Gramling and Reblin, Aging and Mental Health, 2026).

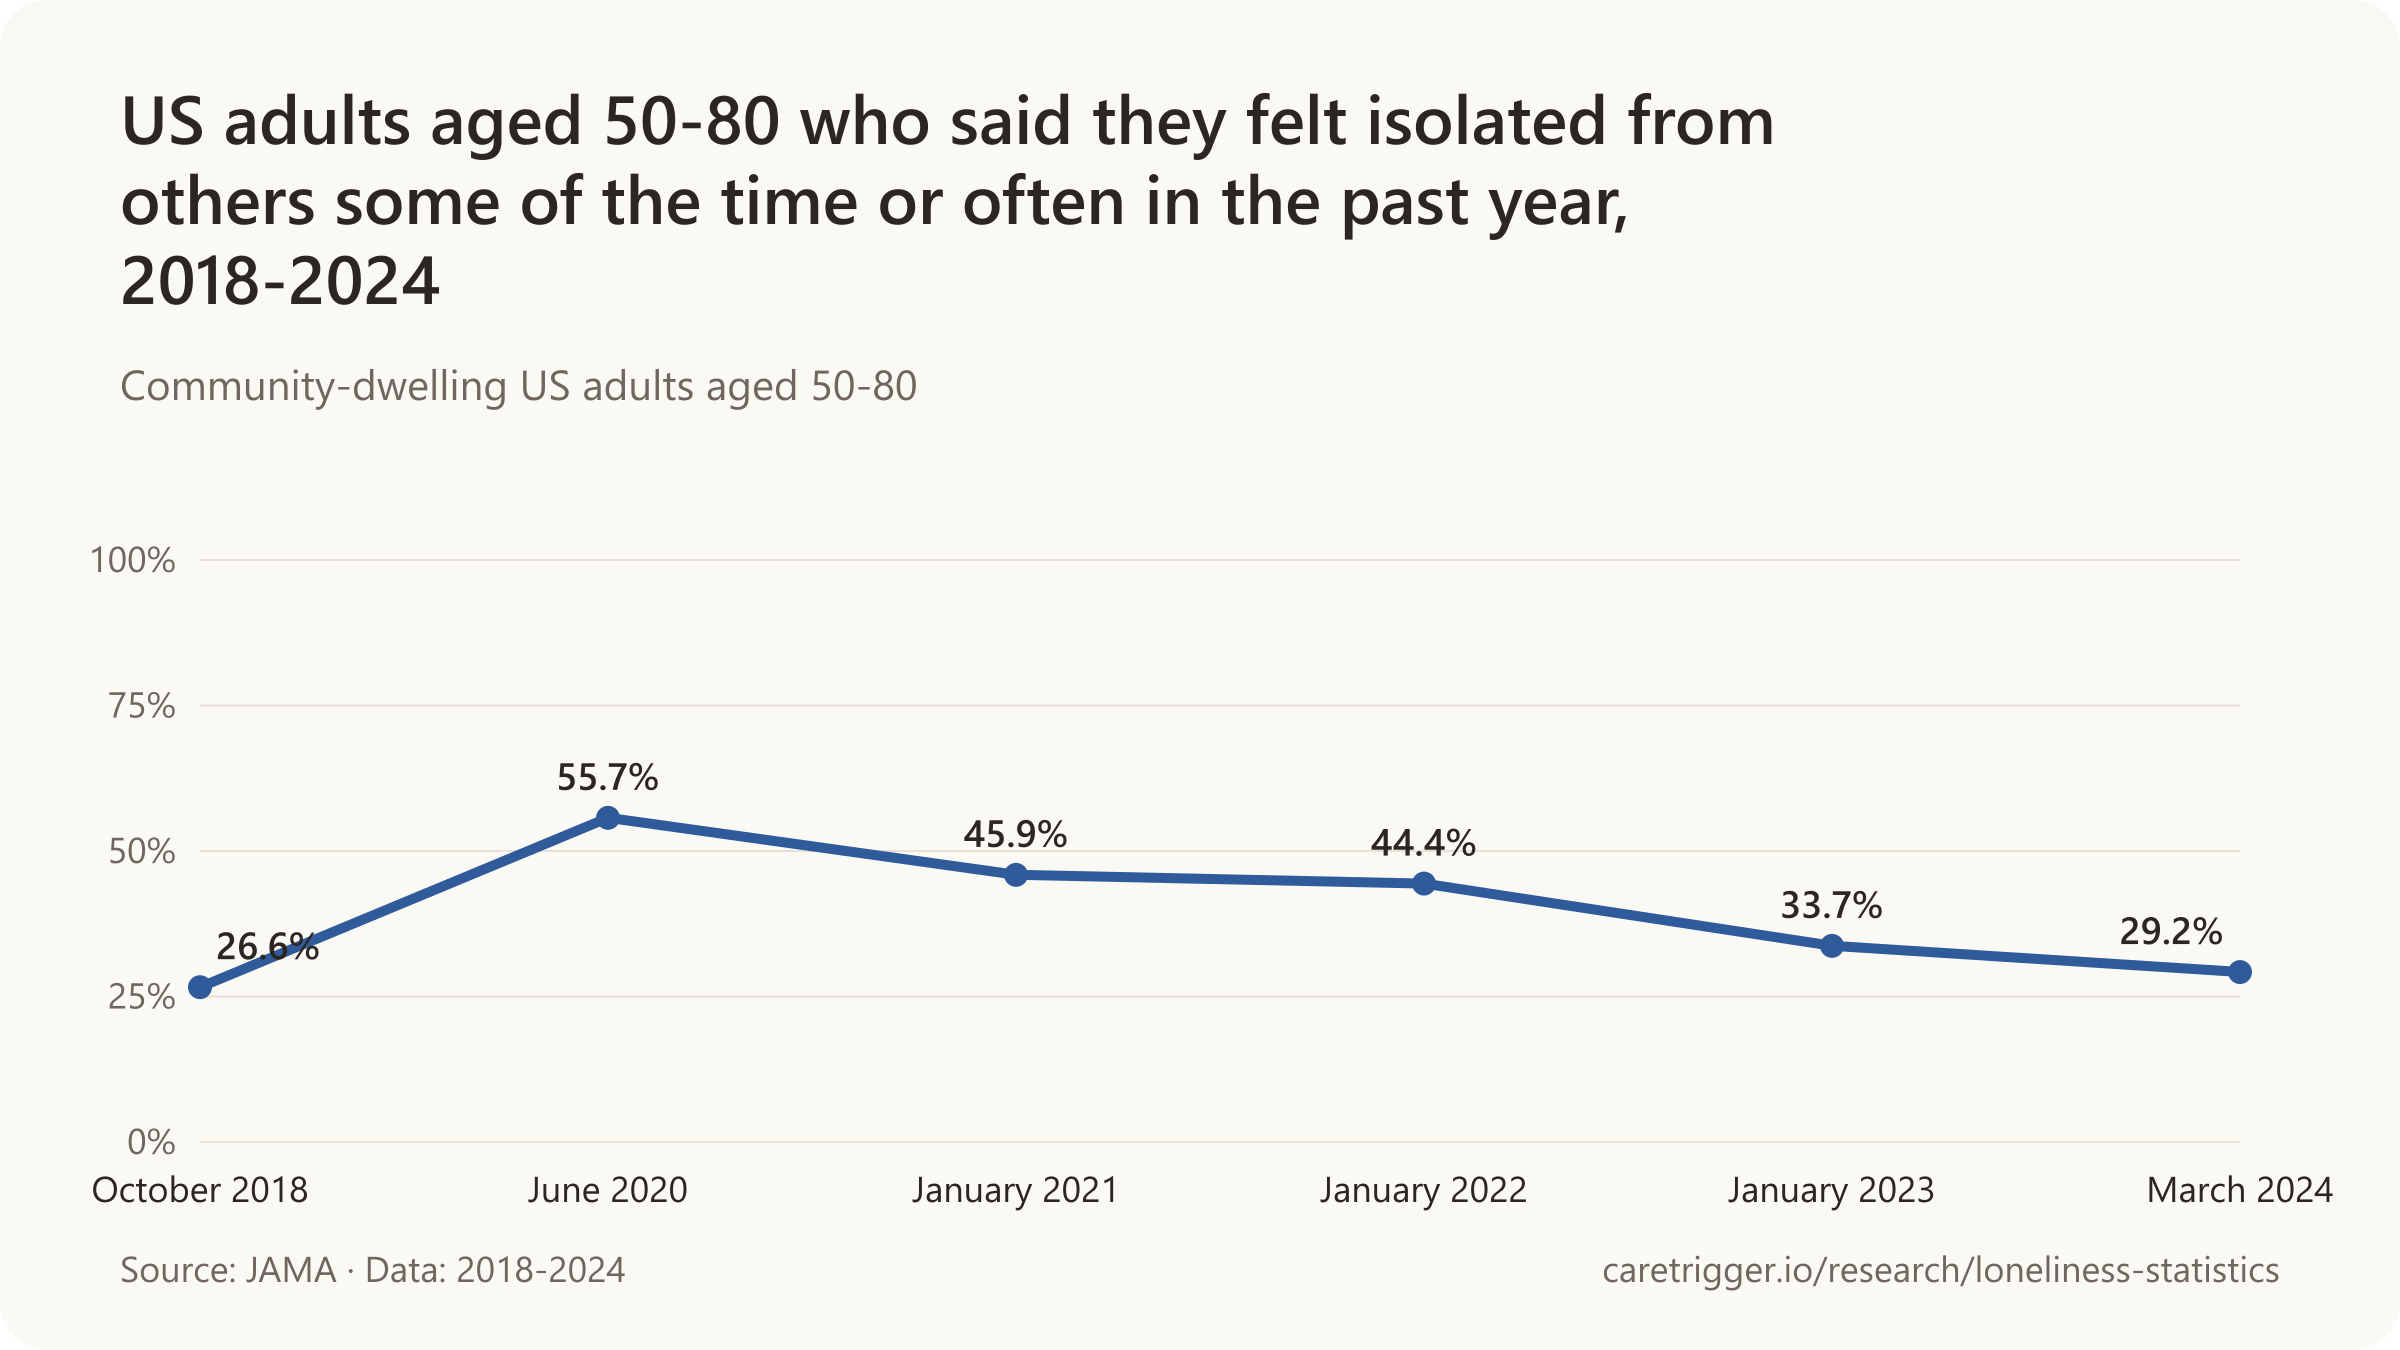
- 36.6% of older Americans were placed in the same category by two established social isolation measures applied to the same NHATS data, showing how much the definition drives the count (Li, Kayser and Song, Innovation in Aging, 2026).
- 23.1% of US adults aged 65-80 said they felt isolated from others some of the time or often in the past year in March 2024, against 34.5% of those aged 50-64 (Malani et al., JAMA, 2025).
- 30.7% of US women aged 50-80 said they felt isolated from others some of the time or often in the past year in March 2024, against 27.5% of men (Malani et al., JAMA, 2025).
- 77.3% of US adults aged 50-80 who rated their mental health fair or poor felt isolated from others some of the time or often in the past year in March 2024 (Malani et al., JAMA, 2025).
United States
- 0.201 was the correlation between loneliness and social isolation among 11,825 older Americans, so the two measures overlapped only weakly (Coyle and Dugan, Journal of Aging and Health, 2012).
- 13.2% of homebound older Americans felt lonely every day or most days during the COVID-19 pandemic in 2020, against 7.7% of older adults who were not homebound (Ankuda et al., Journal of General Internal Medicine, 2022).
- 21.7% of older Americans who were not homebound said they felt lonely more often during the COVID-19 pandemic than before, and so did 21.5% of homebound older adults (Ankuda et al., Journal of General Internal Medicine, 2022).
- 6.3% of older Americans were both homebound and socially isolated in 2011, among roughly 25% who were socially isolated and 21% who were homebound (Cudjoe et al., Journal of the American Geriatrics Society, 2022).
- 1.35 times the hazard of becoming homebound over 9 years was found for socially isolated Black older Americans, and 1.25 times for socially isolated white older Americans, compared with those not isolated (Cudjoe et al., Journal of the American Geriatrics Society, 2022).
- 34% of US family caregivers who felt they had no choice in taking on care reported feelings of isolation, nearly 3 times the 12% of those who felt they had a choice (AARP Research and NAC, Caregiving in the US 2025).
- 54.4% of US adults aged 65-80 said they had felt isolated from others some of the time or often since March 2020 when asked in June 2020, up from 21.7% in 2018 (Malani et al., JAMA, 2025).
- 66% of US adults aged 65 and older said they hardly ever or never feel lonely or isolated in September 2024, the highest share of any age group (Pew Research Center, 2025).
- 35% of US adults aged 65 and older said they feel lonely or isolated from those around them at least sometimes in September 2025 (Pew Research Center, 2025).
- 7% of US adults aged 65-74 and 5% of those 75 and older said they feel lonely or isolated all or most of the time in September 2025 (Pew Research Center, 2025).
- 11% of lower-income US adults aged 65 and older said they feel lonely or isolated all or most of the time in September 2025, against 4% of middle- and upper-income older adults (Pew Research Center, 2025).
- 6% of US women and 5% of US men aged 65 and older said they feel lonely or isolated all or most of the time in September 2025 (Pew Research Center, 2025).
Worldwide and Asia

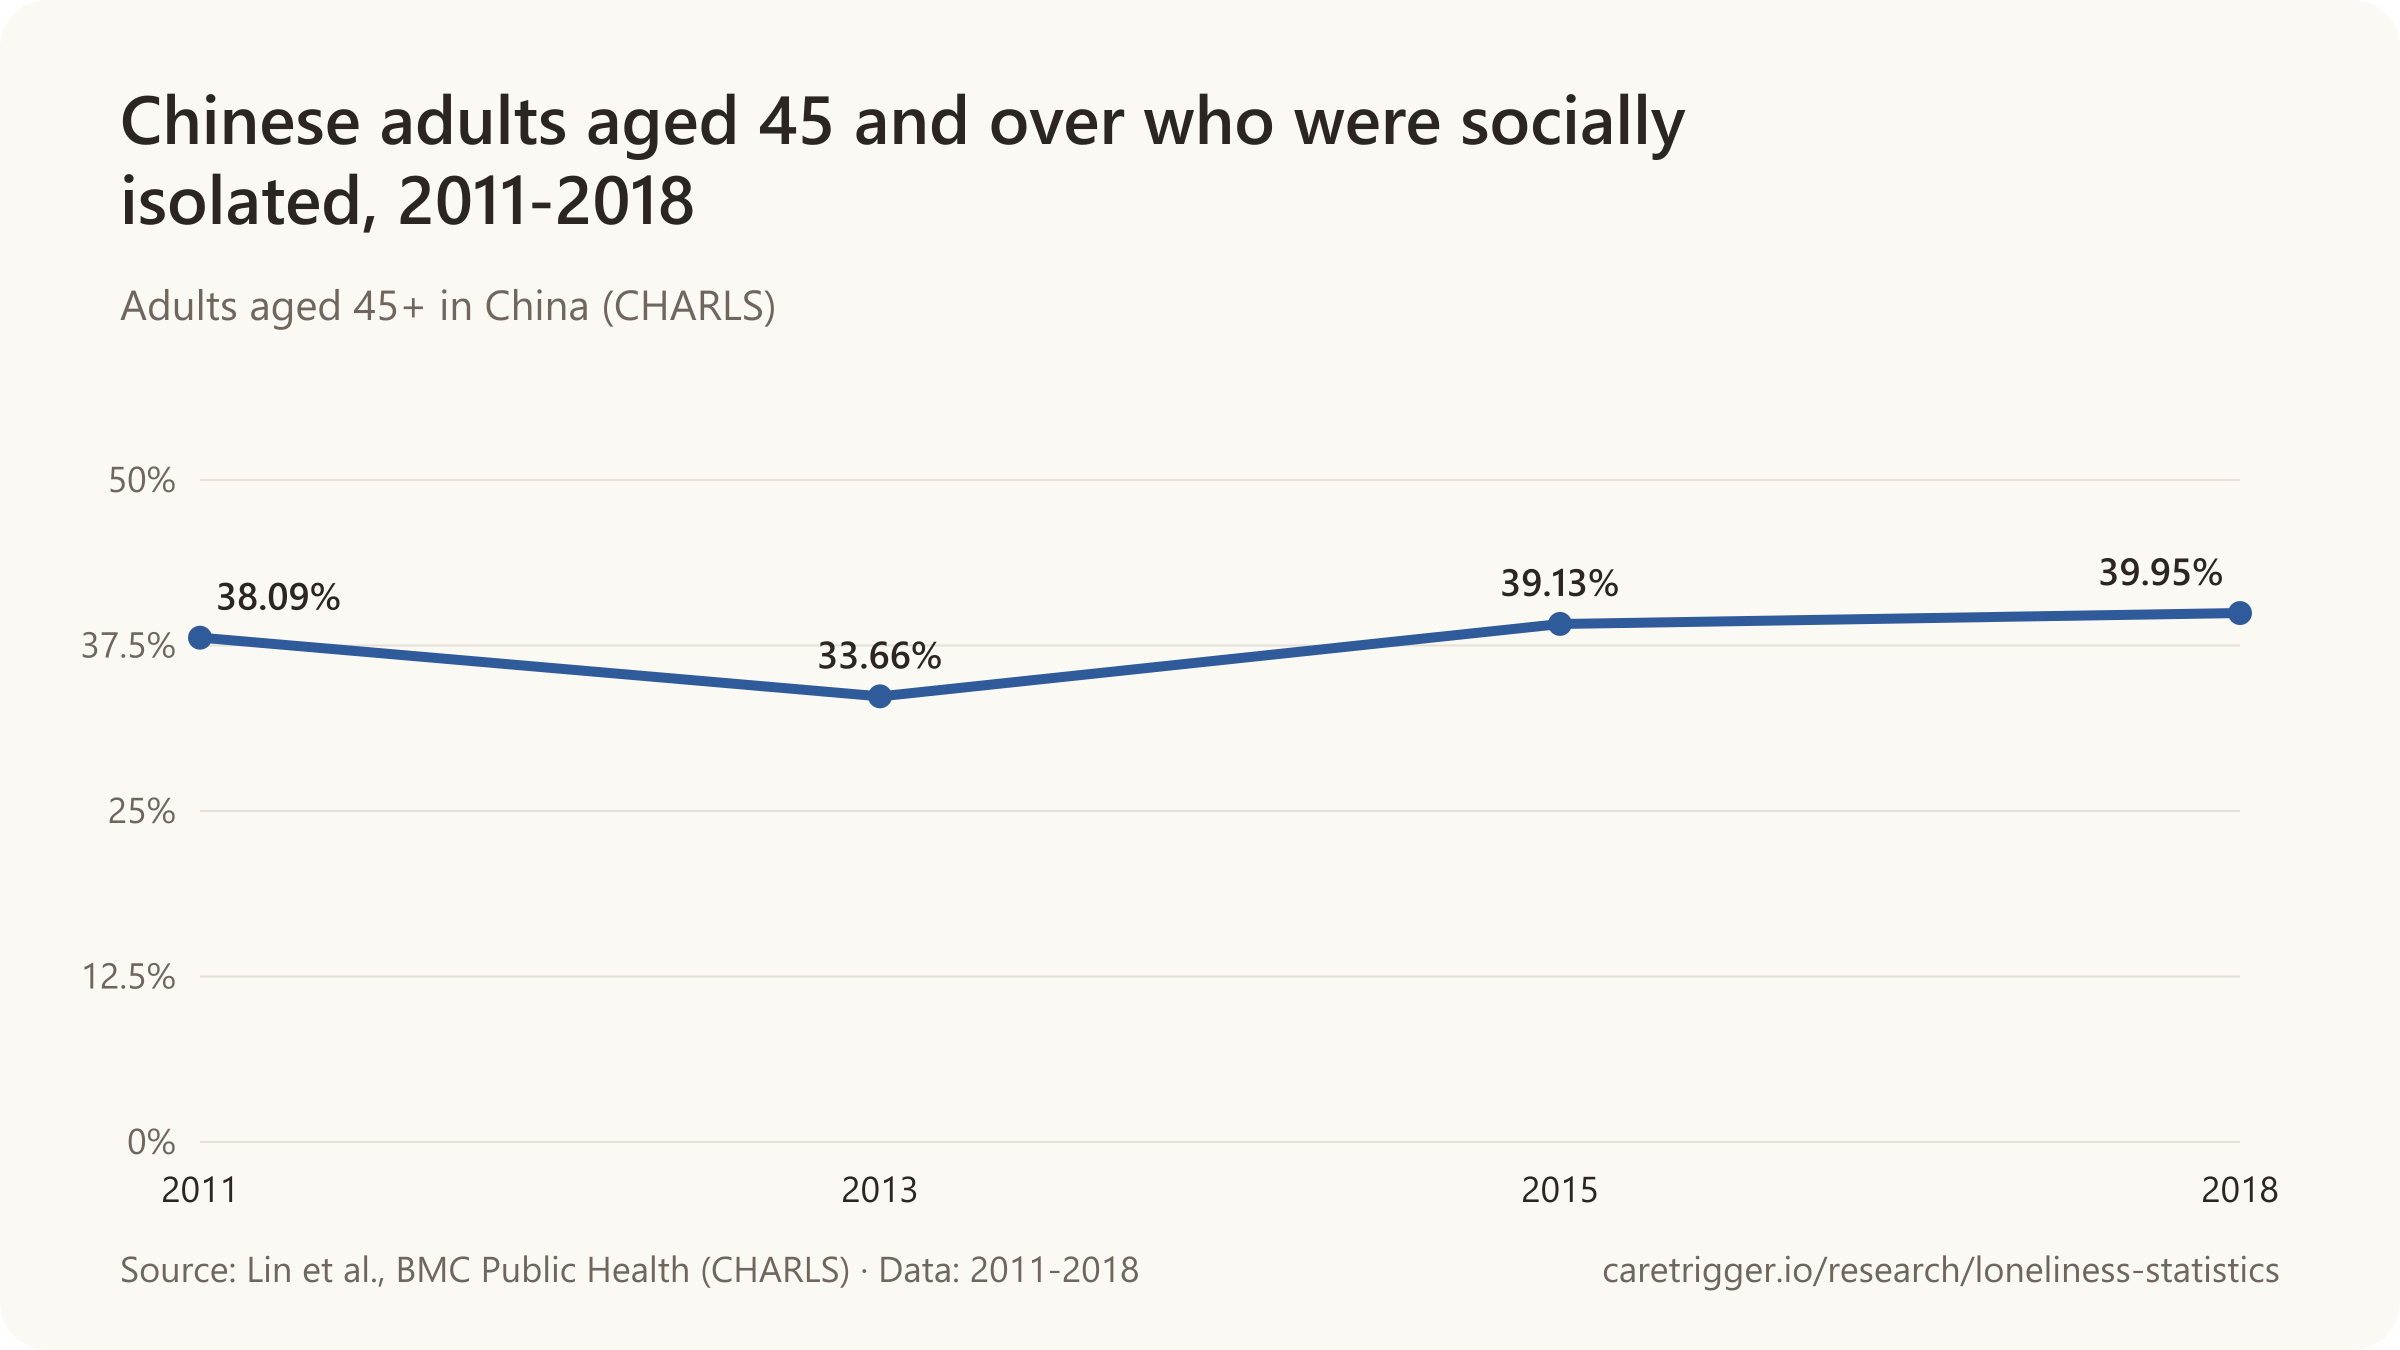
- 25% to 34% of older people are socially isolated, according to meta-analytic estimates covering 1990-2022 cited by the WHO Commission on Social Connection (WHO, 2025).
- 39.4% of South Koreans aged 60 and over were socially isolated in 2025 (no one to help with housework when sick or no one to talk to when down), 15.0 points above the 24.4% of adults aged 19-29 (Ministry of Data and Statistics, Social Survey via e-Nara indicators, 2026).
- 33.6% of people aged 80 and over were socially isolated (95% CI 28.9-38.2%) in a meta-analysis of 22 studies, the high end of WHO's 25-34% range for older people (Hajek et al., Social Psychiatry and Psychiatric Epidemiology, 2023).
- 3.3% of South Koreans aged 13 and over both have no social network and feel lonely, rising to 4.5% of those aged 65 and over, in 2025 (Ministry of Data and Statistics, 2025 Social Survey).
- 4.5% of South Koreans aged 65 and over both have no social network and feel lonely, the highest of any life stage, in 2025 (Ministry of Data and Statistics, 2025 Social Survey).
- 32.6% of South Koreans aged 80 and over have no one to talk to when they feel down or depressed, against 21.2% of all people aged 13 and over, in 2025 (Ministry of Data and Statistics, 2025 Social Survey).
- 28.7% of South Koreans aged 65 and over have no one to talk to when they feel down or depressed in 2025 (Ministry of Data and Statistics, 2025 Social Survey).
Europe
- 11.4% of people aged 65 and over in 21 European OECD countries never got together with friends in person in a typical year in 2022, nearly double the 5.9% of 2015 (OECD analysis of EU-SILC, 2025).
- 11% of older people never meet friends in person in a typical year, more than double the rate for the general population, across OECD countries with comparable data (OECD, 2025).
- 5.9% of people aged 65 and over in 21 European OECD countries never got together with friends in person in a typical year in 2015 (OECD analysis of EU-SILC, 2025).
- 3.0% of men aged 75+ in Denmark showed signs of loneliness in 2023, the lowest of any group, against 6.7% of women aged 75+ (Danish National Health Profile, 2024).
Other figures
- 11.3% of people aged 75 and over in the EU had no one to rely on in case of need in 2022, our calculation from Eurostat's 88.7% who did (Eurostat, EU-SILC, 2026).
- 2 million people aged 60+ in France were isolated from both family and friends in 2025, unchanged since 2021 and up from 900,000 in 2017 (Petits Frères des Pauvres barometer, 2025).
- 5.7 million people aged 60+ in France, about 30%, had no one to talk to about intimate or personal matters in 2025 (Petits Frères des Pauvres barometer, 2025).
- 532,000 people aged 60+ living at home in France never saw friends or family in 2015, or had none, about a tenth of the number of older people living alone (DREES, CARE-Ménages survey, 2022).
- 3.2% of people aged 75+ living alone in Italy had no relatives, friends or neighbours they could count on in 2023, while 92.8% could count on relatives, 69.2% on neighbours and 58.9% on friends (ISTAT, 2026).
- People aged 16-29 went from the least lonely age group in Australia in 2001 to the most lonely by 2023 on the single-item measure, while social isolation rose most among people aged 65 and over, in the HILDA survey (Hagani et al., International Journal of Epidemiology, 2026).
- 12.8% of Chinese adults aged 60 and over often felt they lacked companionship in 2018, the most common of the three UCLA loneliness items; 7.3% often felt left out and 5.7% isolated (Yu et al., BMC Geriatrics, 2026).
- 31.2% of older adults were socially isolated during the COVID-19 pandemic, pooling studies conducted up to November 2021 (Su et al., International Psychogeriatrics, 2023).
- 33% of older adults were socially isolated in a meta-analysis of studies published up to June 2023, with higher rates among people over 80 and those living alone (Ran et al., Geriatric Nursing, 2024).
- 29.8% of 94 near-centenarians and centenarians aged 95 to 107 were both socially isolated and lonely, while 21.3% were isolated but not lonely and 20.2% lonely but not isolated (Zaccaria et al., International Journal of Environmental Research and Public Health, 2022).
- 21.4% of male caregivers of older Americans with dementia were socially isolated in 2022, against 12.4% of female caregivers (Pomeroy et al., Innovation in Aging, 2025).
- 9.2% of older Americans in NHATS were socially isolated in 2020, up from 4.1% in 2019, falling back to 5.6% in 2021-2022 (Yang et al., Innovation in Aging, 2025).
- 13.5% of older Americans in the Health and Retirement Study were socially isolated in 2022, up from 12.9% in 2020 and 12% in 2016-2018 (Yang et al., Innovation in Aging, 2025).
- 22% of Americans aged 65 and over are at risk of being 'elder orphans', living alone with little or no support system, by a rough estimate from Census and Health and Retirement Study data (Carney et al., Current Gerontology and Geriatrics Research, 2016).
- 28% higher odds of social isolation over 8 years were found among older Americans with hearing impairment alone, compared with those without sensory impairment (Huang et al., BMC Public Health, 2024).
- 1.71 times the odds of social isolation were found among Americans over 70 with both measured hearing and vision impairment, compared with those with neither (Xu et al., Innovation in Aging, 2023).
- 10.8% of older adults in England were lonely at two surveys two years apart, about half the 23.2% who were socially isolated at both, in the English Longitudinal Study of Ageing (Ma et al., Nature Communications, 2026).
Sources: Aging and Mental Health; JAMA; Innovation in Aging (2023-2026); Journal of the American Geriatrics Society (2021, 2022); Journal of Aging and Health; Journal of General Internal Medicine; AARP and National Alliance for Caregiving; Pew Research Center (2025); BMC Public Health (2024); World Health Organization; Ministry of Data and Statistics, South Korea; Social Psychiatry and Psychiatric Epidemiology; Archives of Gerontology and Geriatrics; Ministry of Data and Statistics; BJPsych Open; OECD (2025); National Institute of Public Health, University of Southern Denmark, for the Danish Health Authority; Eurostat; Petits Frères des Pauvres, survey by CSA Research; DREES; ISTAT; International Journal of Epidemiology; BMC Geriatrics; International Psychogeriatrics; Geriatric Nursing; International Journal of Environmental Research and Public Health; Journals of Gerontology: Series B; Current Gerontology and Geriatrics Research; Nature Communications
08 / Risk
Who is most at risk of loneliness in later life?
51% of Americans 65 and older who live alone feel lonely or isolated at least sometimes, against 35% of all 65 and older (Pew, 2025).
- Widowed Americans 45 and older spend 11 hours a day alone, yet 41% are lonely, about the 40% average (AARP, 2025).
- 30.9% of widowed Canadians 65 and older were lonely, against 12.5% of those married or living common-law (2019-2020).
- 63% of Americans 45 and older with household incomes under $25,000 were lonely, against 32% at $100,000 or more (2025).
- 50.8% of family carers of people with dementia were lonely, pooling 27 studies in 17 countries (2024).
Living alone, widowhood, low income, poor health, hearing loss, dementia and caring for someone are the factors that recur across countries. Living alone is not the same as being lonely: many people who live alone are not, and our statistics on seniors living alone cover living alone itself. Free apps such as CareTrigger alert family when an older relative's phone goes unusually quiet.
Sources: Pew Research Center; AARP Research; Statistics Canada; International Journal of Geriatric Psychiatry; Cabinet Office of Japan
More statistics (126)
51% of US adults aged 65 and older who live alone said they feel lonely or isolated at least sometimes in September 2025, against 35% of all adults 65 and older (Pew Research Center, 2025).
- 11 hours a day are spent alone on average by widowed US adults aged 45 and older, yet 41% of them were lonely in 2025, about the same as the 40% average (AARP Research, 2025).
- 26% of US adults aged 65 and older lived alone in 2023, down from 29% in 1990 (Pew Research Center analysis of Census data, 2025).
- 20% of US adults aged 65 and older who lived alone, one in five, were in poverty in 2023, against 6% of older adults who did not live alone (Pew Research Center analysis of Census data, 2025).
Living alone

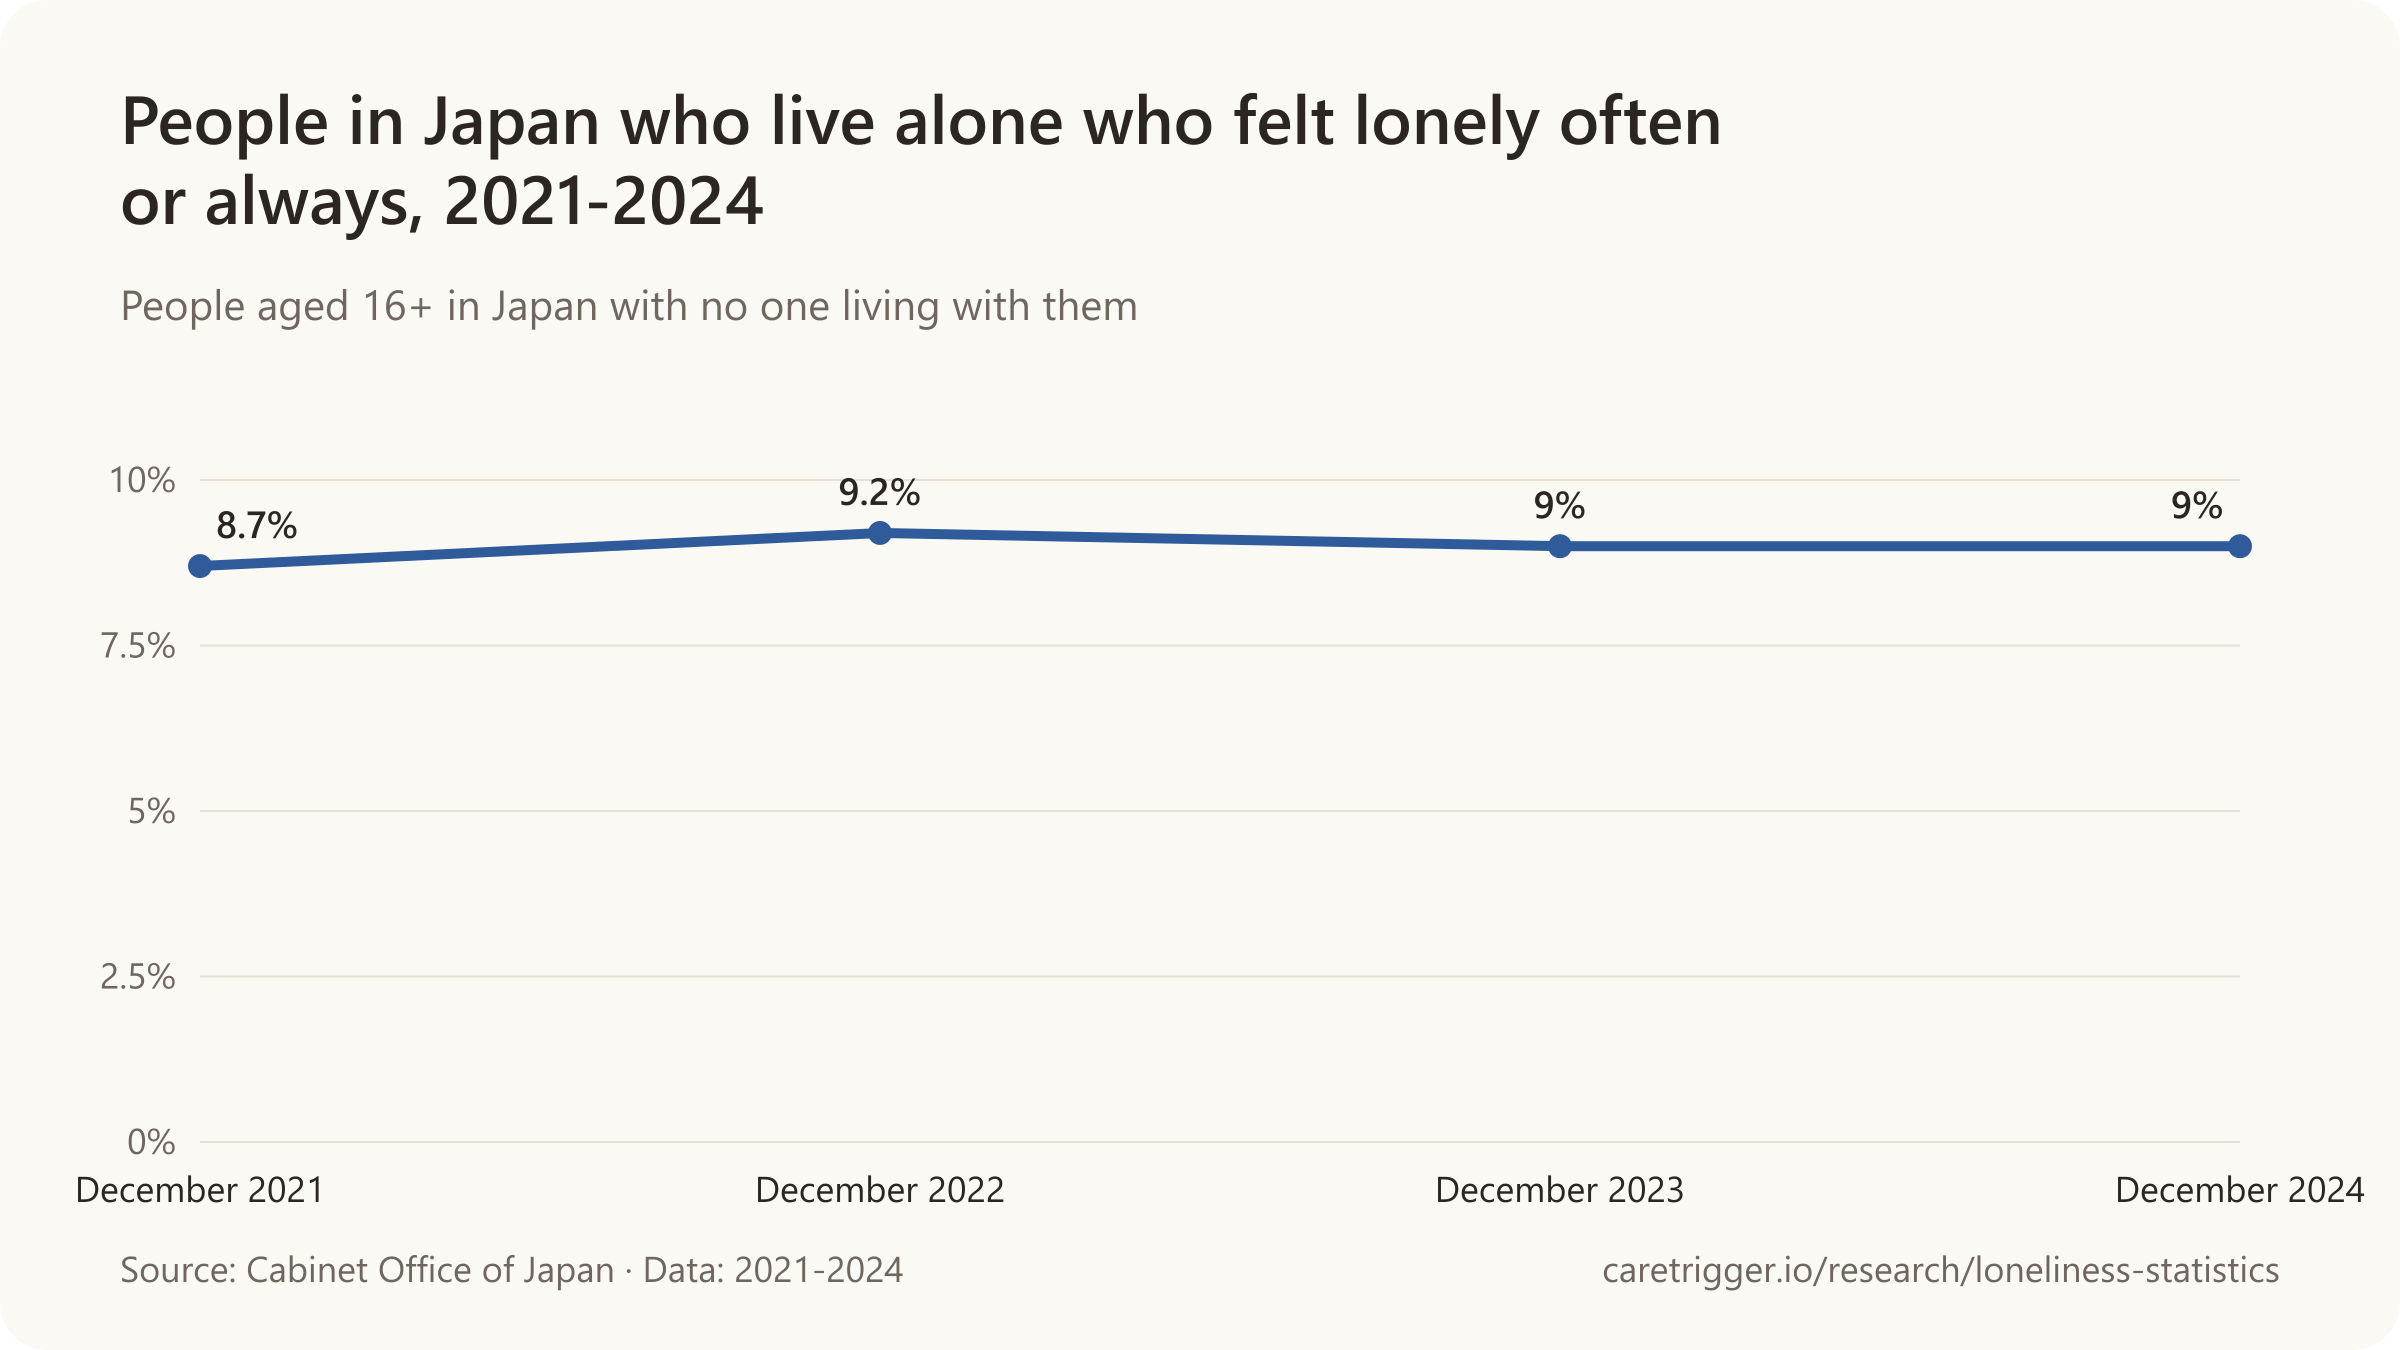
- 9.0% of people in Japan who live alone felt lonely often or always in December 2024, against 3.5% of those who live with others (Cabinet Office of Japan, national loneliness survey).
- 69% of widowed older homeowners living alone with long-term health conditions reported feeling lonely 'occasionally' or more often, versus 46% of all adults (ONS analysis of the Community Life Survey 2016-17).
- Among 1,306 French patients aged 75+ admitted via emergency departments, 45% of those who lived alone did not feel lonely, while 34% of those who lived with others did feel lonely; living alone was associated with longer, not shorter, survival (Simo et al., Gériatrie et Psychologie Neuropsychiatrie du Vieillissement, 2025).
- People aged 50+ in England who live alone are 1.6 times more likely to be often lonely than those who live with somebody, independent of age, gender and how often they meet people; being widowed (5.2x), having no one to open up to (5.5x) and poor health (3.7x) are stronger predictors (Age UK analysis of ELSA, All the Lonely People, 2018).
- 13.4% of working-age adults (16 to 64) living alone in Great Britain felt lonely often or always in April 2020, against 5.0% of all adults (ONS Opinions and Lifestyle Survey, 2020).
- 37% of adults aged 70+ in Ireland who live alone were in the loneliest group, against 21% of those living with others (TILDA and ALONE, 2020).
- Over 70% of people aged 85+ in Sweden live alone, against under 20% of people aged 35-54, in a country where 41% of households are one-person households (Public Health Agency of Sweden).
- 53% of older Norwegians living alone felt lonely at least a little of the time in the past four weeks in 2022, against 19% of those not living alone, and 8% felt lonely all or almost all of the time against 1% (Statistics Norway, 2024).
- 1.37 times the odds of loneliness (OR, 95% CI 1.14-1.65) were found among Chinese adults aged 60 and over who lived alone, and 1.51 times among those with reduced social participation, in 2018 (Yu et al., BMC Geriatrics, 2026).
- 1.42 times the prevalence of loneliness (pooled prevalence ratio, 95% CI 1.32-1.52) was found among people aged 65 and over living alone in Latin America, China and India, 2003-2007 (Gao et al., International Journal of Public Health, 2021).
- 29% of older New Zealanders assessed for home care who lived alone said they were lonely, against 14% of those living with others, among 71,859 people with an average age of 82.7 (Jamieson et al., Australasian Journal on Ageing, 2018).
- 36.0% of Americans aged 65 and over with probable dementia were living alone in 2022, up from earlier NHATS estimates of 16% in 2015 (Singer, Nelson and Menne, Innovation in Aging, 2025).
- 13.1% of Americans with probable dementia who live alone felt lonely most days of the week and 4.3% every day, in 2022 (Singer, Nelson and Menne, Innovation in Aging, 2025).
- 13% higher risk of loneliness was found among Americans aged 50 and over who lived alone than among those who did not, once marital status and other factors were taken into account (Surkalim et al., Journals of Gerontology: Series B, 2023).
- 8% higher likelihood of chronic loneliness, on average, was found among adults aged 50 and over who had ever lived alone, ranging from 2% to 25% across 20 countries, the most consistent risk factor studied (Sheftel, Margolis and Verdery, Journals of Gerontology: Series B, 2024).
- 38% of US adults aged 85 and older lived alone in 2023, against 24% of those aged 65-84 (Pew Research Center analysis of Census data, 2025).
- 58.6% of US adults aged 50-80 who lived alone said they felt a lack of companionship some of the time or often in the past year in 2018, against 28.5% of those living with others (Malani et al., JAMA, 2025).
| Group | Usually or always | Scope |
|---|---|---|
| Live alone | 9.0% | US adults 18+ living alone vs with others · United States · 2024 |
| Previously married US adults (widowed, divorced or separated) | 8.6% | US adults 18+ by marital status · United States · 2024 |
| US adults with a disability | 13.6% | US adults 18+ with vs without disability (Washington Group Short Set: a lot of difficulty or unable in at least one domain) · United States · 2024 |
| US adults with family incomes below the federal poverty level | 10.3% | US adults 18+ by family income as % of federal poverty level · United States · 2024 |
| American Indian or Alaska Native adults in the US | 12.2% | non-Hispanic American Indian or Alaska Native adults 18+ · United States · 2024 |
| Bisexual US adults | 11.3% | US adults 18+ by sexual orientation · United States · 2024 |
Widowhood
- 30.9% of widowed Canadians aged 65 and over were lonely in 2019-2020, against 12.5% of those married or living common-law (Statistics Canada, Health Reports, 2023).
- 40.3% of widowed people in Northern Ireland felt lonely at least some of the time in 2024/25, against 9.1% of married people or civil partners (Individual Wellbeing in Northern Ireland data tables, 2026).
- 1.67 was the pooled estimate linking widowhood with loneliness in adults aged 60 and over (95% CI 1.13-2.48), across 70 studies (Susanty et al., Archives of Gerontology and Geriatrics, 2025).
- 136% higher risk of sustained loneliness was found among widowed Americans aged 50 and over than among those married or partnered, and 71% higher risk of loneliness in a given week (Surkalim et al., Journals of Gerontology: Series B, 2023).
- About 50% of widowed men and 40% of widowed women in Australia agreed they often felt very lonely about a year after their spouse died, up from around 40% and 30% at the time of the death (Freak-Poli et al., Journals of Gerontology: Series B, 2022).
- 1.53 points higher loneliness on a 1-to-7 scale was found for Australian men in the year they were widowed at age 50 or over, against 0.91 points for women, and men's loneliness stayed elevated for many years (Kapelle and Monden, Journal of Health and Social Behavior, 2024).
- 26 longitudinal studies of widowhood agree that loneliness peaks directly after a spouse's death and that widowers report more loneliness than widows, but not on how long it lasts (Niino et al., Journal of the American Geriatrics Society, 2025).
- 38 studies comparing marital groups found widowhood associated with a greater likelihood and intensity of loneliness than other marital statuses, especially divorce, and widowers lonelier on average than widows (Vedder et al., Innovation in Aging, 2022).
- 40% to 60% more time alone than comparable partnered women was spent by widowed older women in national time-use diaries from France, Poland, the UK and the US, the factor the authors find behind widows' lower well-being (Adena et al., Journal of Happiness Studies, 2023).
- 2 or more hours of volunteering a week, started around the time of widowhood, was associated with loneliness levels among recently widowed older Americans similar to those of people who stayed married and volunteered as much (Carr et al., Journals of Gerontology: Series B, 2018).
Money, health and disability
- 63% of US adults aged 45 and older with household incomes under $25,000 were lonely on the UCLA Loneliness Scale in 2025 (AARP Research, 2025).
- 1.52 times the odds of loneliness (95% CI 1.17-1.97) were found for older adults in countries with higher income inequality, across the US, England and 15 European countries, after adjusting for population make-up and GDP (Tapia-Muñoz et al., PLOS ONE, 2022).
- 88% higher likelihood of reporting loneliness was found for people in England who rated their health fair, bad or very bad than for those in good or very good health, other factors held constant (ONS analysis of the Community Life Survey 2016/17, 2018).
- 1.7% of adults in two-adult households with at least one person aged 65 or over in Great Britain felt lonely often or always in April 2020, against 5.0% of all adults (ONS Opinions and Lifestyle Survey, 2020).
- 26.3% of adults in Great Britain who rated their health bad or very bad felt lonely often or always in April 2020, against 5.0% of all adults (ONS Opinions and Lifestyle Survey, 2020).
- 43.6% of people in Northern Ireland who rated their health bad or very bad felt lonely at least some of the time in 2024/25, against 7.1% of those in very good health (Individual Wellbeing in Northern Ireland, 2026).
- 9 in 10 people aged 65+ who are often lonely also say they are unhappy or depressed, against 4 in 10 of those who are hardly ever lonely (Age UK analysis of Understanding Society, 2024).
- More than five times the odds of chronic loneliness were found for people aged 16 to 34 compared with those aged 65 or older, other factors held constant (DCMS, Investigating factors associated with loneliness in adults in England, 2022).
- 23.7% of adults aged 75+ without a disability in Germany agreed that they often feel lonely in 2023, about the same as the 23.3% of young adults aged 18-40, with 34.9% and 40.5% among people with disabilities in those age groups (BMBFSFJ, Einsamkeitsbarometer 2026).
- People aged 30-44 were the most likely to be chronically lonely in Australia once other factors were accounted for; those aged 60-74 and 75 and over were less likely, 2014-2018 (Lim et al., Scientific Reports, 2023).
- 25.3% of Canadians aged 65 and over in the lowest income fifth were lonely in 2019-2020, against 15.3% in the highest (Statistics Canada, Health Reports, 2023).
- 2.35 was the pooled estimate linking poor health with loneliness in adults aged 60 and over (95% CI 1.59-3.45), across 70 studies (Susanty et al., Archives of Gerontology and Geriatrics, 2025).
- 4% of adults aged 50 and over in Denmark were chronically lonely, against 15% in Greece, the extremes across 20 countries covering 47% of the world's population in that age group (Sheftel, Margolis and Verdery, Journals of Gerontology: Series B, 2024).
- 70% of US adults aged 65 and older said they have people they can turn to for support all or most of the time in September 2025, falling to 57% among lower-income older adults (Pew Research Center, 2025).
| Group | Often or always | Scope |
|---|---|---|
| Disabled people aged 16+ | 14% | disabled people aged 16+ in England; direct question, often or always · England · October 2025 to March 2026 (survey year 2025/26) |
| Women aged 16+ | 7% | women aged 16+ in England (survey asks 'What is your sex?'); direct question, often or always · England · October 2025 to March 2026 (survey year 2025/26) |
| Gender identity differs from sex registered at birth | 18% | people aged 16+ in England whose gender identity differs from sex registered at birth; direct question, often or always · England · October 2025 to March 2026 (survey year 2025/26) |
| Bisexual people aged 16+ | 14% | bisexual people aged 16+ in England; direct question, often or always · England · October 2025 to March 2026 (survey year 2025/26) |
| Never worked or long-term unemployed | 14% | people aged 16+ in England, never worked or long-term unemployed (NS-SEC); direct question, often or always · England · October 2025 to March 2026 (survey year 2025/26) |
| People in England's most deprived areas | 11% | people aged 16+ in the most deprived decile of areas (Index of Multiple Deprivation 2025); direct question, often or always · England · October 2025 to March 2026 (survey year 2025/26) |
| Social housing tenants aged 16+ | 14% | people aged 16+ in England renting from the social rented sector; direct question, often or always · England · October 2025 to March 2026 (survey year 2025/26) |
| People aged 16+ in England who did not live with a partner | 12% | people aged 16+ in England not living in the household as a couple; direct question, often or always · England · October 2025 to March 2026 (survey year 2025/26) |
| People aged 16+ in rural England | 5% | people aged 16+ in rural England; direct question, often or always · England · October 2025 to March 2026 (survey year 2025/26) |
| Group | At least some of the time | Scope |
|---|---|---|
| Adults aged 75 and over | 25% | adults aged 75 and over in Scotland; lonely at least some of the time in the past week · Scotland · 2024 |
| Adults aged 16-24 | 23% | adults aged 16 to 24 in Scotland; lonely at least some of the time in the past week · Scotland · 2024 |
| Single pensioners | 41% | single-pensioner households in Scotland; lonely at least some of the time in the past week · Scotland · 2024 |
| Disabled adults | 38% | disabled adults 16+ in Scotland; lonely at least some of the time in the past week · Scotland · 2024 |
| Adults in Scotland's most deprived areas | 28% | adults 16+ in the 20% most deprived areas of Scotland (SIMD); lonely at least some of the time in the past week · Scotland · 2024 |
Hearing, vision and dementia
- 50.8% of informal carers of people with dementia were lonely, pooling 27 studies of 11,134 carers in 17 countries (Liao et al., International Journal of Geriatric Psychiatry, 2024).
- 2.98 was the pooled estimate linking cognitive impairment with loneliness in adults aged 60 and over (95% CI 1.30-6.81), the strongest of the risk factors pooled across 70 studies (Susanty et al., Archives of Gerontology and Geriatrics, 2025).
- 50.9% of very old people with dementia in northern Sweden reported loneliness, not significantly more than the 46.0% of those without dementia (Lampinen et al., European Journal of Ageing, 2022).
- 30.1% of people with mild-to-moderate dementia felt moderately lonely and 5.2% severely lonely on the 6-item De Jong Gierveld scale, in the IDEAL cohort of 1,547 people in Great Britain (Victor et al., International Journal of Geriatric Psychiatry, 2020).
- 42.7% of people living with dementia were lonely, pooling studies in a 10-study systematic review and meta-analysis (Hajek and König, BJPsych Open, 2025).
- 43.7% of family carers of people with dementia in Great Britain reported moderate loneliness and 17.7% severe loneliness (Victor et al., Aging and Mental Health, 2021).
- 13% of US caregivers of people with dementia felt lonely every day or most days, against 7.4% of those caring for someone with mild cognitive impairment and 7.1% of other caregivers (Couch, Howe and Southerland, Innovation in Aging, 2024).
- 7.4% of US caregivers of people with mild cognitive impairment felt lonely every day or most days (Couch, Howe and Southerland, Innovation in Aging, 2024).
- 7.1% of US caregivers of older people without dementia or cognitive impairment felt lonely every day or most days (Couch, Howe and Southerland, Innovation in Aging, 2024).
Carers
- 37% higher likelihood of reporting loneliness was found for people with caring responsibilities in England than for those without, other factors held constant (ONS analysis of the Community Life Survey 2016/17, 2018).
- 19% of carers aged 65+ in the UK, about 287,000 people, said they felt lonely because of the care or support they provide, in a poll for a charity (Age UK, 2024).
- 27% of US family and unpaid caregivers of older Medicare beneficiaries, about 6.3 million people, were lonely in 2022 (Qian et al., Journals of Gerontology: Series B, 2025).
- 8.5% of US caregivers of Medicare beneficiaries, over 750,000 people, felt lonely every day or most days (Couch, Howe and Southerland, Innovation in Aging, 2024).
- 24% of US family caregivers said they feel alone in 2025, up slightly from 21% in 2020, in AARP and the National Alliance for Caregiving's national survey (AARP Research and NAC, Caregiving in the US 2025).
- 21% of US family caregivers said they felt alone in 2020, in AARP and the National Alliance for Caregiving's national survey (AARP Research and NAC, Caregiving in the US 2025).
- 45.4% of US family caregivers aged 50-80 said they lacked companionship in the January 2021 poll, against 35.9% of non-caregivers (Li et al., National Poll on Healthy Aging analysis, Innovation in Aging, 2025).
Other risk factors
- 63% lower likelihood of reporting loneliness was found for people aged 75 and over than for 16-to-24-year-olds in England, other factors held constant (ONS analysis of the Community Life Survey 2016/17, 2018).
- 56% higher likelihood of reporting loneliness was found for people with a long-term health condition or disability in England than for those without, other factors held constant (ONS analysis of the Community Life Survey 2016/17, 2018).
- 84% higher likelihood of loneliness was found for people in England who met friends and family less than once a month or never than for those who met them daily, other factors held constant (ONS analysis of the Community Life Survey 2016/17, 2018).
- 43% higher likelihood of feeling lonely was found for people in England who never chatted to their neighbours than for those who did, other factors held constant (ONS analysis of the Community Life Survey 2016/17, 2018).
- 19.4% of non-European immigrant men aged 65 and over in Canada were lonely in 2019-2020, against 13.3% of Canadian-born men (Statistics Canada, Health Reports, 2023).
- 2.95 was the pooled estimate linking living in an institution such as a care home with loneliness in adults aged 60 and over (95% CI 1.48-5.88), across 70 studies (Susanty et al., Archives of Gerontology and Geriatrics, 2025).
- 1.92 was the pooled estimate linking being a woman with loneliness in adults aged 60 and over (95% CI 1.53-2.41), across 70 studies (Susanty et al., Archives of Gerontology and Geriatrics, 2025).
- 1.18 was the pooled estimate linking rural residence with loneliness in adults aged 60 and over (95% CI 1.04-1.34), the weakest of the risk factors pooled across 70 studies (Susanty et al., Archives of Gerontology and Geriatrics, 2025).
- 120 different risk factors for loneliness were tested across 34 longitudinal studies of older adults, but only a few were consistently associated with it: no partner or partner loss, a small network, little social activity, poor self-rated health and depression (Dahlberg et al., Aging and Mental Health, 2022).
- 1.84 times the odds of loneliness were found among rural Chinese older adults with both hearing and vision impairment, against 1.34 with vision impairment alone and 1.32 with hearing impairment alone (Wang et al., JMIR Public Health and Surveillance, 2022).
- 16.2% of older Americans whose transport problems kept them from seeing family and friends or going out felt lonely every day in 2023, against 2.9% of those without such barriers (Choi and Marti, Innovation in Aging, 2025).
- 4.4% of Americans aged 65 and over, about 2 million people, said transport problems kept them from visiting family or friends, attending religious services or clubs, or going out for enjoyment in 2023 (Choi and Marti, Innovation in Aging, 2025).
More tables
| Region | Lonely | Scope |
|---|---|---|
| Eastern Europe | 21.3% | Adults aged 60+; problematic loneliness on single-item direct questions · Eastern Europe · studies published 2000-2019 |
| Southern Europe | 15.7% | Adults aged 60+; problematic loneliness on single-item direct questions · Southern Europe · studies published 2000-2019 |
| Western Europe | 8.7% | Adults aged 60+; problematic loneliness on single-item direct questions · Western Europe · studies published 2000-2019 |
| Northern Europe | 5.2% | Adults aged 60+; problematic loneliness on single-item direct questions · Northern Europe · studies published 2000-2019 |
More charts

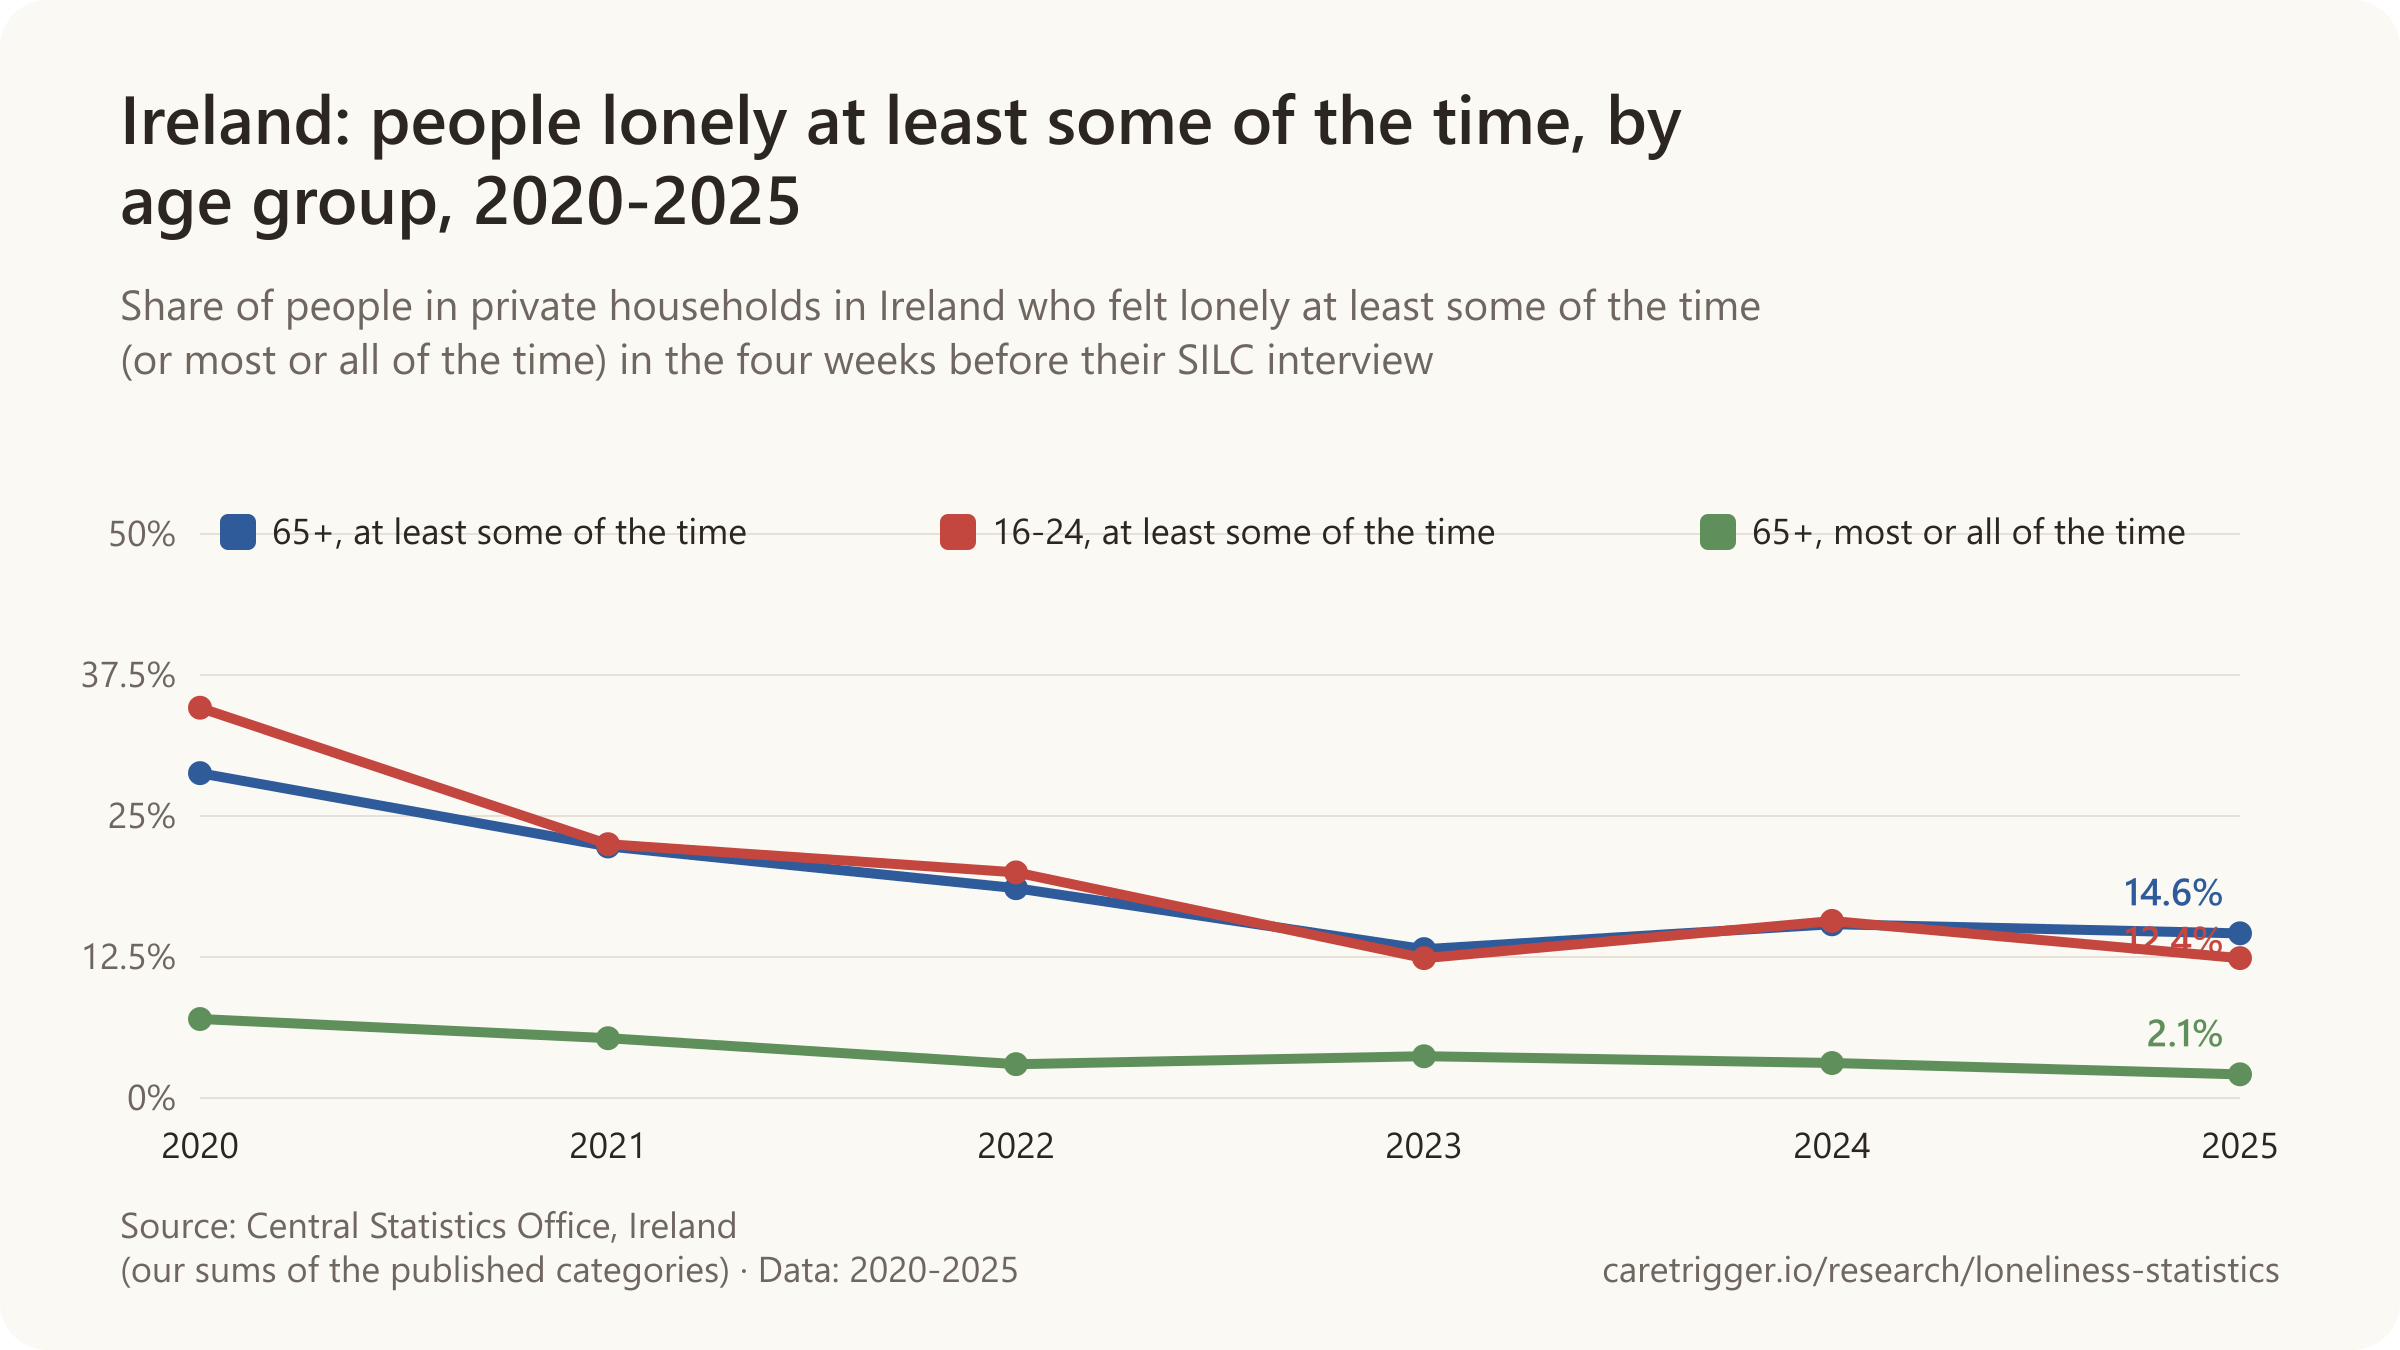
Other figures
- 22% of U.S. adults 50+ who live alone said loneliness is the worst part of living alone, while 35% named freedom and autonomy as the best part (AARP Research survey, 2025).
- Loneliness scores 0.060 points lower on a 0-2 scale over eight years were associated with internet use among older adults in the US Health and Retirement Study (2006-2014), with 0.025 points of that running through more contact with family and friends (Yu, Wu and Chi, Journals of Gerontology Series B, 2021).
- 13.9% of people living alone, 13.0% of those in the bottom income fifth, 11.9% of unemployed people and 8.4% of those aged 65 and over felt lonely most or all of the time in the past four weeks in 2022, against 5.9% of all adults in European OECD countries (OECD analysis of EU-SILC, 2025).
- 22.7% of people aged 75 and over in Northern Ireland felt lonely at least some of the time in 2024/25, the highest of any age group, against 17.9% of all people aged 16+ (Individual Wellbeing in Northern Ireland data tables, 2026).
- 38.0% of people without access to a car in Northern Ireland felt lonely at least some of the time in 2024/25, against 14.7% of those with a car (Individual Wellbeing in Northern Ireland data tables, 2026).
- 31.7% of separated or divorced Canadians aged 65 and over were lonely in 2019-2020 on a 3-item loneliness scale (Statistics Canada, Health Reports, 2023).
- 19.3% of Indians aged 60 and over not in a marital union (widowed, divorced, separated or never married) felt alone often or most of the time in 2017-2018, against 10.0% of those married (Srivastava & Srivastava, Indian Journal of Psychiatry, 2023).
- 28.5% of people aged 60 and over in high-income countries were lonely, pooling 31 studies published from 2008 to 2020 that measured loneliness in general older populations (Chawla et al., PLOS ONE, 2021).
- 7.9% of people aged 60 and over in high-income countries were severely lonely, against 25.9% who were moderately lonely, in 29 studies that graded loneliness by severity (Chawla et al., PLOS ONE, 2021).
- 31.6% of community-dwelling adults over 60 were lonely, pooling 101 prevalence rates from 45 studies of 168,473 people, with estimates lowest for single-item questions and highest for the 20-item UCLA scale (Stegen et al., International Psychogeriatrics, 2024).
- 65.6% of lonely people aged 85 and over without dementia wished to meet their family more often, against 45.1% of those who were not lonely (Lampinen et al., European Journal of Ageing, 2022).
- 3.6% of Americans aged 50 and over reported loneliness in three consecutive Health and Retirement Study waves in 2014-2018, down from 4.6% in 1998-2002 (Surkalim et al., Journals of Gerontology: Series B, 2023).
- 44.7% of Swedes aged 77 and over had little contact with relatives and friends in 2021, up from 24.4% in 2002, while the share living alone fell from 59.2% to 45.3% (Dahlberg et al., Frontiers in Public Health, 2024).
- 13.0% of Americans aged 50 and over in the Health and Retirement Study had no children, and they were substantially lonelier than parents in adjusted models (Rataj et al., Innovation in Aging, 2024).
- 1.1 points lower loneliness on the 3-item UCLA scale (range 3-9) was found after four weeks of empathy-focused phone calls from trained young volunteers, compared with a control group, in a randomised trial of 240 Meals on Wheels clients (Kahlon et al., JAMA Psychiatry, 2021).
- A standardised mean difference of -0.27 (95% CI -0.42 to -0.12) linked digital cognitive behavioural therapy with lower loneliness in adults aged 60 and over, pooling 6 randomised trials with 653 participants, low-certainty evidence (Fu et al., Journal of Affective Disorders, 2026).
- 1.16 times the odds of loneliness in the US Health and Retirement Study, and 1.30 in England's ELSA, were found among older adults who did not use the internet, compared with internet users (Zhong and Wang, BMC Geriatrics, 2025).
- 52.13% of older adults in the US Health and Retirement Study did not regularly use the internet, against 33.54% in England's ELSA and 96.20% in China's CHARLS (Zhong and Wang, BMC Geriatrics, 2025).
- -0.01 was the adjusted association between having video calls with family or friends and loneliness among 7,537 older Americans in 2023, effectively zero, although video calls were linked with fewer depressive and anxiety symptoms (Choi and Marti, Innovation in Aging, 2025).
- 50.0% of Americans aged 65 and over without transport barriers, who make up 95.6% of that age group, never felt lonely in the past month in 2023, while 3.1% felt lonely most days (Choi and Marti, Innovation in Aging, 2025).
- 72 was the age at which loneliness was lowest among older Americans, rising after that, while older adults did not become lonelier over 2005-2016 (Hawkley et al., Psychology and Aging, 2019).
- 7 hours a day, more than half their measured waking time, are spent alone on average by Americans aged 60 and older, rising to over 10 hours for those who live alone (Pew Research Center analysis of American Time Use Survey data, 2019).
Sources: Pew Research Center (2019, 2025); AARP Research (2025); Cabinet Office of Japan; Office for National Statistics (2018, 2020); Gériatrie et Psychologie Neuropsychiatrie du Vieillissement; Age UK (2018, 2024); European Journal of Ageing (2009, 2021, 2022); Archives of Gerontology and Geriatrics (2023, 2024); The Irish Longitudinal Study on Ageing and ALONE; Public Health Agency of Sweden; Statistics Norway; BMC Geriatrics (2025, 2026); International Journal of Public Health; Australasian Journal on Ageing; Innovation in Aging (2022, 2024, 2025); Journals of Gerontology: Series B (2018-2025); JAMA; medRxiv; Statistics Canada; The Executive Office, Programme for Government Analytics (2026); Journal of Health and Social Behavior; Journal of the American Geriatrics Society; Journal of Happiness Studies; PLOS ONE (2021, 2022); Department for Digital, Culture, Media and Sport; Federal Ministry of Education, Family Affairs, Senior Citizens, Women and Youth; Scientific Reports; Department for Culture, Media and Sport and Ministry of Housing, Communities and Local Government; Department for Culture, Media and Sport; Scottish Government; International Journal of Geriatric Psychiatry (2020, 2024); BJPsych Open; Aging and Mental Health (2020, 2021); AARP and National Alliance for Caregiving; JMIR Public Health and Surveillance; The BMJ; Central Statistics Office, Ireland; OECD; Indian Journal of Psychiatry; International Psychogeriatrics; Frontiers in Public Health; JAMA Psychiatry; Journal of Affective Disorders; Psychology and Aging
09 / Care homes
How lonely are people in nursing homes?
35% of care-home residents were severely lonely and 61% moderately lonely, pooling 13 studies (Gardiner et al., Age and Ageing, 2020).
- 20.7% of long-stay US nursing home residents felt lonely or isolated sometimes or more often, among 732,808 residents (2023).
- In Germany, 35.2% of people 80 and older in care homes felt lonely most or all of the time, against 9.5% at home (2020-21).
- 50.7% of older adults living in institutions were lonely, the highest of any setting in a 126-study meta-analysis (2025).
Sources: Age and Ageing; Journal of the American Medical Directors Association; Cologne Center for Ethics, Rights, Economics, and Social Sciences of Health and German Centre of Gerontology; Humanities and Social Sciences Communications
More statistics (25)
35% of older people living in residential and nursing care homes were severely lonely, pooling 13 studies (Gardiner et al., Age and Ageing, 2020).
- 20.7% of long-stay US nursing home residents aged 50 and over who could answer for themselves felt lonely or isolated sometimes, often or always, among 732,808 residents in 13,491 homes in late 2023 (Nielsen et al., Journal of the American Medical Directors Association, 2026).
- 35.2% of people aged 80+ living in care homes in Germany felt lonely most or all of the time in the past week in 2020-21, against 9.5% of those in private households (D80+ study, ceres and German Centre of Gerontology, 2022).
- 50.7% of older adults living in institutions such as nursing homes were lonely, the highest rate of any setting in a 126-study meta-analysis (Salari et al., Humanities and Social Sciences Communications, 2025).
- A mean difference of -0.44 points on the 20-80 UCLA Loneliness Scale at three months (95% CI -3.28 to 2.41): video-call interventions made little to no difference to loneliness compared with usual care in three trials with 201 older nursing-home residents, and the evidence is very uncertain (Noone et al., Cochrane Database of Systematic Reviews, 2020).
- 16% of people aged 10+ in Germany, about 12.2 million, said they often feel lonely in 2022, one in six (Destatis, Time Use Survey 2022).
- 24% of young adults aged 18-29 in Germany said they often feel lonely in 2022, the highest share of any age group (Destatis, Time Use Survey 2022).
- 10% of people aged 65+ in Germany said they often feel lonely in 2022, the lowest share of any age group, though the very old are underrepresented and care-home residents were not surveyed (Destatis, Time Use Survey 2022).
- 18% of women in Germany said they often feel lonely in 2022, against about 15% of men (Destatis, Time Use Survey 2022).
- 8% of men aged 65+ in Germany said they often feel lonely in 2022, the least lonely group, against 12% of women aged 65+ and 26% of women aged 18-29 (Destatis, Time Use Survey 2022).
- 26% of people living alone in Germany said they often feel lonely in 2022, against 9% of people in couple households without children (Destatis, Time Use Survey 2022).
- 40% of single mothers and fathers in Germany said they often feel lonely in 2022, the highest share of any household type (Destatis, Time Use Survey 2022).
- 9% of people in couple households without children in Germany said they often feel lonely in 2022, the lowest share of any household type (Destatis, Time Use Survey 2022).
- 12.1% of people aged 80+ in Germany felt lonely most or all of the time in the past week in 2020-21, about twice the share reported before the pandemic (D80+ study, ceres and German Centre of Gerontology, 2022).
- 22.1% of people aged 90+ in Germany felt lonely most or all of the time in the past week in 2020-21, against 8.7% of those aged 80-84 (D80+ study, ceres and German Centre of Gerontology, 2022).
- 22.7% of older clients of home care, service housing and institutional care in Finland suffered from loneliness often or all the time in 2024 (THL, Sotkanet indicator 6025).
- 27.1% of people aged 80 and over were severely lonely (95% CI 23.7-30.4%) and a further 32.1% moderately lonely, in a meta-analysis of 22 studies (Hajek et al., Social Psychiatry and Psychiatric Epidemiology, 2023).
- 61% of older people living in residential and nursing care homes were moderately lonely, the pooled estimate from 13 studies of 5,115 residents with a mean age of 83.5 (Gardiner et al., Age and Ageing, 2020).
- About 35% of the variation in US nursing home residents' loneliness or isolation lay between facilities, against about 2% between counties (Nielsen et al., Journal of the American Medical Directors Association, 2026).
- 77% of 193 Dutch long-term care residents reported loneliness 6 to 10 weeks into the COVID-19 visitor ban, 50% moderately, 16% strongly and 11% very strongly (Van der Roest et al., Journal of the American Medical Directors Association, 2020).
- 19% of Swedish nursing home residents aged 70 and over were often troubled by loneliness in spring 2020, up from 17% in 2019, a rise the authors explain by worse self-reported health rather than the national visiting ban (Gustafsson et al., Journals of Gerontology: Series B, 2022).
- About 50% less contact, in visits and calls from family and friends, followed nursing home admission compared with contact before admission, in interviews about 1,441 newly admitted residents in Maryland (Port et al., The Gerontologist, 2001).
- 14% of Canadians aged 75 and over always or often felt lonely in August-September 2021, more than the 9% of those aged 65 to 74 (Statistics Canada, Canadian Social Survey, 2021).
- 37.7% of 131 nursing home residents interviewed in the 2020 wave of the Health and Retirement Study said they felt lonely (Smith and Theeke, Innovation in Aging, 2025).
- 5.6% of community-dwelling Medicare beneficiaries aged 65 and over, about 2 million people, were completely or mostly homebound in 2011, rarely or never leaving home (Ornstein et al., JAMA Internal Medicine, 2015).
A number we will not publish. "60% of nursing home residents never have a visitor" circulates with a credit to the US National Center for Health Statistics; we found no such table, and the US nursing home assessment has no visitor item. The national count above asks residents themselves.
Sources: Age and Ageing; Journal of the American Medical Directors Association (2020, 2026); Cologne Center for Ethics, Rights, Economics, and Social Sciences of Health and German Centre of Gerontology; Humanities and Social Sciences Communications; Cochrane Database of Systematic Reviews; Federal Statistical Office of Germany; Finnish Institute for Health and Welfare, Sotkanet statistics service; Social Psychiatry and Psychiatric Epidemiology; Journals of Gerontology: Series B; The Gerontologist; Statistics Canada; Innovation in Aging; JAMA Internal Medicine
10 / Contact
How often are older adults in touch with family and friends?
15.5% of EU residents 75 and older never contacted a friend by phone, message or online, against 1.1% of 16- to 24-year-olds (Eurostat, 2022).

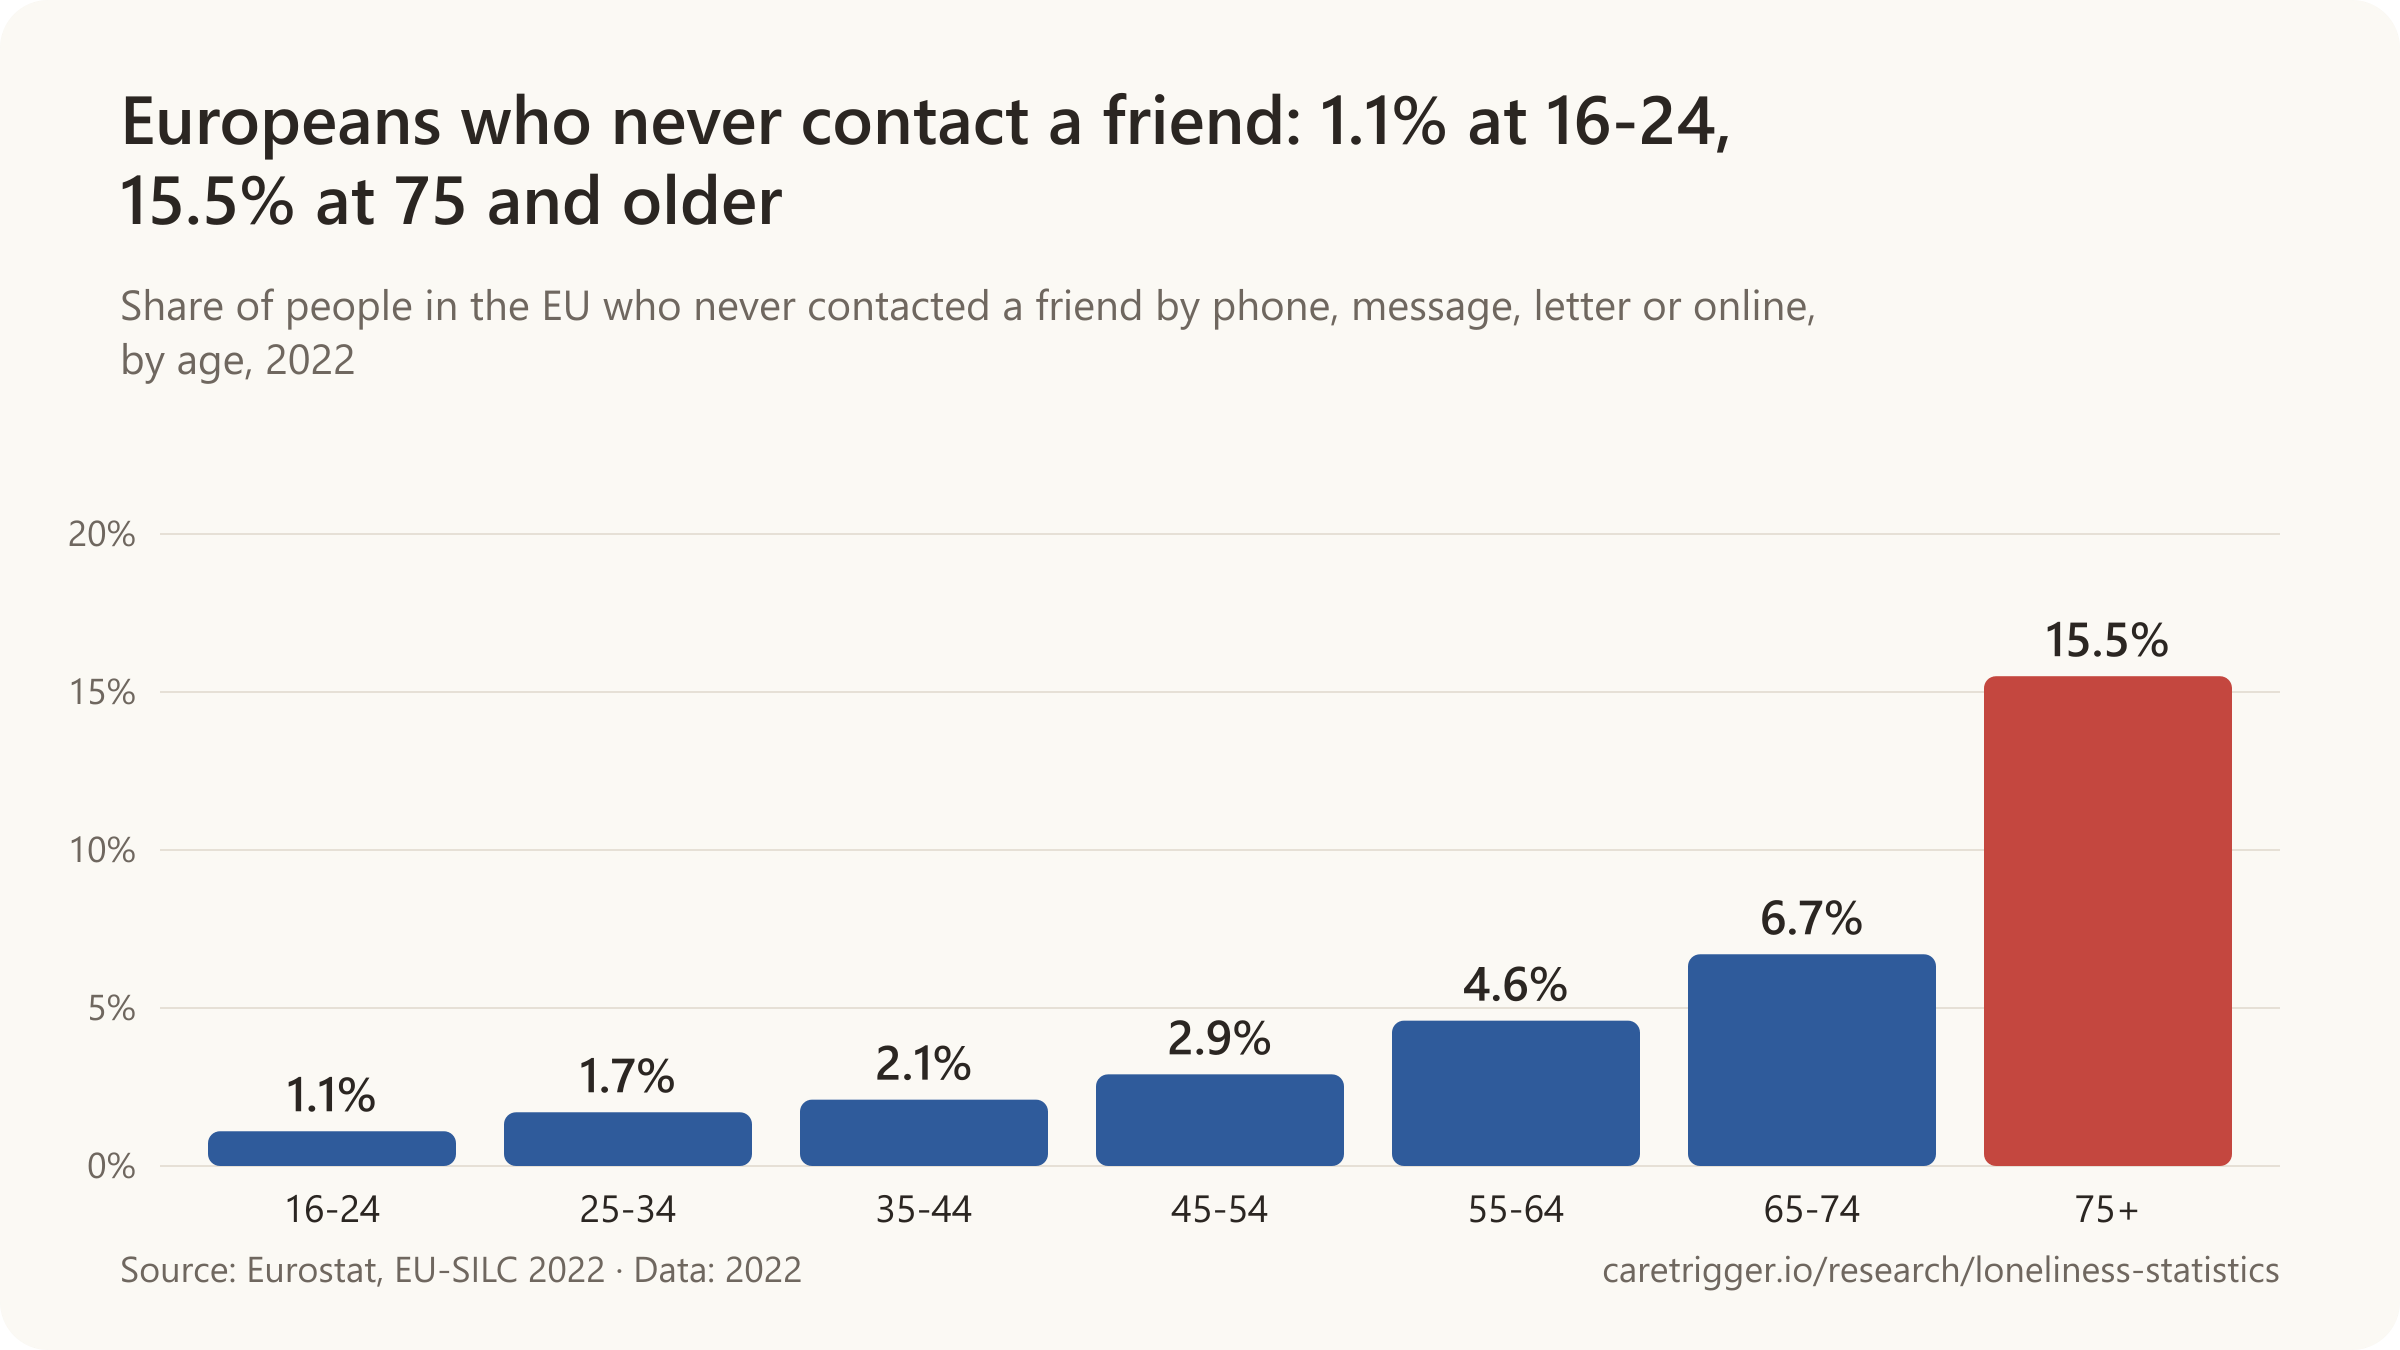
- Americans 65 and older spent 442 minutes a day alone, more than seven hours, against 211 for those aged 25 to 34 (2003-2019).
- 270,000 people 65 and older in England go a week without speaking to a friend or family member, by a charity's analysis (2024).
- 1.5 million people 65 and older in the UK expected to eat Christmas dinner alone in 2025, in a poll for a charity (Age UK).
How far adult children live from their parents and how often they visit and call are on our page of statistics on living far from aging parents. Contact and loneliness are linked, not the same: people with frequent contact can be lonely, and people who see few others can be content.
Sources: Eurostat; Cabinet Office of Japan; SSM - Population Health; Age UK (2025, 2024); Innovation in Aging
More statistics (69)
15.5% of people aged 75 and over in the EU never contacted a friend by phone, message, letter or online in 2022 (Eurostat, EU-SILC 2022).
- 10.8% of people aged 65 and over in the EU never contacted a friend by phone, message, letter or online in 2022 (Eurostat, EU-SILC 2022).
- 4.8% of people aged 16 and over in the EU never contacted a friend by phone, message, letter or online in 2022 (Eurostat, EU-SILC 2022).
At Christmas
The Christmas figures come from a charity's polls of people 65 and older in the UK, not from official surveys.
- 1.5 million people aged 65+ in the UK expected to eat Christmas dinner alone in 2025, according to a poll of 2,659 older people for a charity (Age UK, 2025).
- 514,000 people aged 65+ in the UK (4%) expected to feel lonely at Christmas in 2018, and 79% of them had not sought help, in a face-to-face poll of 1,917 people for a charity (Age UK, 2018).
- 670,000 people aged 65+ in the UK expected not to see or speak to anyone on Christmas Day 2025, and 1 million said they feel more isolated at Christmas than at any other time of year, in a poll for a charity (Age UK, 2025).
Friends
- 270,000 people aged 65 and over in England, about 3%, go a week without speaking to a friend or family member (Age UK analysis of the English Longitudinal Study of Ageing, 2024).
- 87% of Canadians aged 65 and over kept in touch with friends both in person and by phone or online in 2025, and 4% saw friends only in person, more than any other age group (Statistics Canada, 2025).
- 24% of Canadians whose contact with friends was only by phone or online always or often felt lonely in 2025, against 15% of those who also met friends in person (Statistics Canada, 2025).
- 15.4% of people aged 65 and over in the EU were in contact with friends by phone, message, letter or online every day in 2022 (Eurostat, EU-SILC 2022).
- 29.2% of people aged 16 and over in the EU were in contact with friends by phone, message, letter or online every day in 2022 (Eurostat, EU-SILC 2022).
- 59.7% of South Koreans aged 65 and over met friends, neighbours or acquaintances in person at least once a week in 2023 (Ministry of Health and Welfare, 2024).
- 30% of Americans aged 45 and over whose good friend had moved away in the past five years kept a close, frequent connection with that friend in 2025, and 23% of the lonely did (AARP Research, 2025).
- 20 minutes a day was the average time Americans aged 15 and over spent with friends in 2020, down from 60 minutes in 2003 and 34 in 2019 (Kannan and Veazie, SSM - Population Health, 2023).
- 60 minutes a day were spent with friends by the average American aged 15 and older in 2003 (American Time Use Survey analysis, Kannan & Veazie, SSM Population Health, 2023).
- 34 minutes a day were spent with friends by the average American aged 15 and older in 2019 (American Time Use Survey analysis, Kannan & Veazie, SSM Population Health, 2023).
- 377 fewer hours a year were spent with friends by Americans aged 15-24 in 2019 than in 2003 (American Time Use Survey analysis, Kannan & Veazie, SSM Population Health, 2023).
| Age | Every day | Scope |
|---|---|---|
| 16-24 | 66.2% | People aged 16-24 in private households, EU-27; usually in contact with friends daily by phone, SMS, letter or online · European Union - 27 countries (from 2020) · 2022 |
| 25-34 | 42.4% | People aged 25-34 in private households, EU-27; usually in contact with friends daily by phone, SMS, letter or online · European Union - 27 countries (from 2020) · 2022 |
| 35-44 | 29.9% | People aged 35-44 in private households, EU-27; usually in contact with friends daily by phone, SMS, letter or online · European Union - 27 countries (from 2020) · 2022 |
| 45-54 | 25.1% | People aged 45-54 in private households, EU-27; usually in contact with friends daily by phone, SMS, letter or online · European Union - 27 countries (from 2020) · 2022 |
| 55-64 | 19.9% | People aged 55-64 in private households, EU-27; usually in contact with friends daily by phone, SMS, letter or online · European Union - 27 countries (from 2020) · 2022 |
| 65-74 | 17.0% | People aged 65-74 in private households, EU-27; usually in contact with friends daily by phone, SMS, letter or online · European Union - 27 countries (from 2020) · 2022 |
| 75+ | 13.6% | People aged 75 and over in private households, EU-27; usually in contact with friends daily by phone, SMS, letter or online · European Union - 27 countries (from 2020) · 2022 |
Time alone and conversation
- 442 minutes a day, more than 7 hours, were spent alone on average by Americans aged 65 and older in 2003-2019, against 211 minutes for those aged 25-34 (American Time Use Survey analysis, Kannan & Veazie, SSM Population Health, 2023).
- 43 minutes a day was the average time Americans aged 65 and over spent with family members who did not live with them in 2003-2019, and 38 minutes with friends (Kannan and Veazie, SSM - Population Health, 2023).
- 22 minutes a day was the average time Americans aged 15 and over spent with family members outside their household in 2020, down from 35 minutes in 2003 (Kannan and Veazie, SSM - Population Health, 2023).
- 229 minutes a day was the average time Americans aged 35-44 spent alone in 2003-2019 (Kannan and Veazie, SSM - Population Health, 2023).
- 290 minutes a day was the average time Americans aged 45-54 spent alone in 2003-2019 (Kannan and Veazie, SSM - Population Health, 2023).
- 174 minutes a day of companionship (shared leisure, sport, eating out) were recorded for the average American aged 15 and older in 2020, down from 202 in 2003 (American Time Use Survey analysis, Kannan & Veazie, SSM Population Health, 2023).
- 351 minutes a day were spent alone on average by Americans aged 55-64 in 2003-2019 (American Time Use Survey analysis, Kannan & Veazie, SSM Population Health, 2023).
- 211 minutes a day were spent alone on average by Americans aged 25-34 in 2003-2019, the least of any age group (American Time Use Survey analysis, Kannan & Veazie, SSM Population Health, 2023).
- 234 minutes a day were spent alone on average by Americans aged 15-24 in 2003-2019, while they spent 115 minutes a day with friends, the most of any age group (American Time Use Survey analysis, Kannan & Veazie, SSM Population Health, 2023).
- 344 minutes a day were spent alone on average by Black Americans in 2003-2019, against 285 minutes for White Americans (American Time Use Survey analysis, Kannan & Veazie, SSM Population Health, 2023).
- 1,405 more hours a year were spent alone by Americans aged 65 and older than by those aged 25-34, on average in 2003-2019 (American Time Use Survey analysis, Kannan & Veazie, SSM Population Health, 2023).
| Country | Almost never | Scope |
|---|---|---|
| Sweden | 9.9% | People aged 60+ in the community in Sweden; talk face to face with anyone (household members and home helpers included) almost never · Sweden · 2020-2021 |
| United States | 7.7% | People aged 60+ in the community in United States; talk face to face with anyone (household members and home helpers included) almost never · United States · 2020-2021 |
| Japan | 7.6% | People aged 60+ in the community in Japan; talk face to face with anyone (household members and home helpers included) almost never · Japan · 2020-2021 |
| Germany | 4.7% | People aged 60+ in the community in Germany; talk face to face with anyone (household members and home helpers included) almost never · Germany · 2020-2021 |
Contact and loneliness
- 46% of Americans aged 50 to 80 reported infrequent social contact with people outside their home in June 2020, up from 28% in 2018 (University of Michigan National Poll on Healthy Aging; Solway, 2021).
- 60% of Americans aged 45 and over whose adult child had moved away in the past five years kept a close, frequent connection with that child in 2025, against 45% of those who were lonely (AARP Research, 2025).
- 10% of Americans aged 45 and over whose adult child had moved away in the past five years had drifted apart or lost contact with that child in 2025, rising to 18% among the lonely (AARP Research, 2025).
- 57% of American internet users aged 45 and over said they relied on technology to stay connected and in touch with friends and family in 2025 (AARP Research, 2025).
- 59% of Americans aged 45 and over agreed in 2025 that communicating online is less satisfying than talking on the phone or in person, up from 50% in 2010 (AARP Research, 2025).
- Almost 3 times as likely to be lonely: people aged 65 and over in England who go a week without speaking to a friend or family member, compared with those who speak to them more often (Age UK analysis of the English Longitudinal Study of Ageing, 2024).
Other countries
- 10.9% of people aged 60 and over in Japan met or phoned a child living elsewhere almost every day in 2020-2021 (Cabinet Office of Japan, 2021).
- 53% of Australians aged 15 and over had face-to-face contact with family or friends outside their household at least once a week in 2025, up from 42% in 2020 but below 68% in 2019 (Australian Bureau of Statistics, 2026).
- 68% of Australians aged 15 and over had face-to-face contact with family or friends outside their household at least once a week in 2019 (Australian Bureau of Statistics, 2026).
- 42% of Australians aged 15 and over had face-to-face contact with family or friends outside their household at least once a week in 2020 (Australian Bureau of Statistics, 2026).
- 58% of people in 142 countries had interacted with friends or family who live with or near them at least once a day in the past 7 days (Meta-Gallup Global State of Social Connections, a Gallup survey for Meta, 2023).
- 30% of people in 142 countries had interacted daily with friends or family who live far away in the past 7 days, and 20% had not interacted with them at all (Meta-Gallup Global State of Social Connections, a Gallup survey for Meta, 2023).
| Country | Almost every day | Scope |
|---|---|---|
| United States | 31.2% | People aged 60+ in the community in United States (all respondents, including those without a separately living child); contact with separately living children almost every day · United States · 2020-2021 |
| Sweden | 20.2% | People aged 60+ in the community in Sweden (all respondents, including those without a separately living child); contact with separately living children almost every day · Sweden · 2020-2021 |
| Germany | 16.7% | People aged 60+ in the community in Germany (all respondents, including those without a separately living child); contact with separately living children almost every day · Germany · 2020-2021 |
| Japan | 10.9% | People aged 60+ in the community in Japan (all respondents, including those without a separately living child); contact with separately living children almost every day · Japan · 2020-2021 |
Sources: Eurostat; Age UK (2018, 2024, 2025); Statistics Canada; Cabinet Office of Japan (2021, 2026); Ministry of Health and Welfare and KIHASA; AARP Research (2025); SSM - Population Health; National Institute of Population and Social Security Research; Innovation in Aging (2019, 2021); Economics & Human Biology; Australian Bureau of Statistics; Gallup
11 / Health
What are loneliness and social isolation linked to?
Loneliness was associated with a 14% higher risk of early death and social isolation with 32%, across 90 cohort studies (Wang et al., 2023).

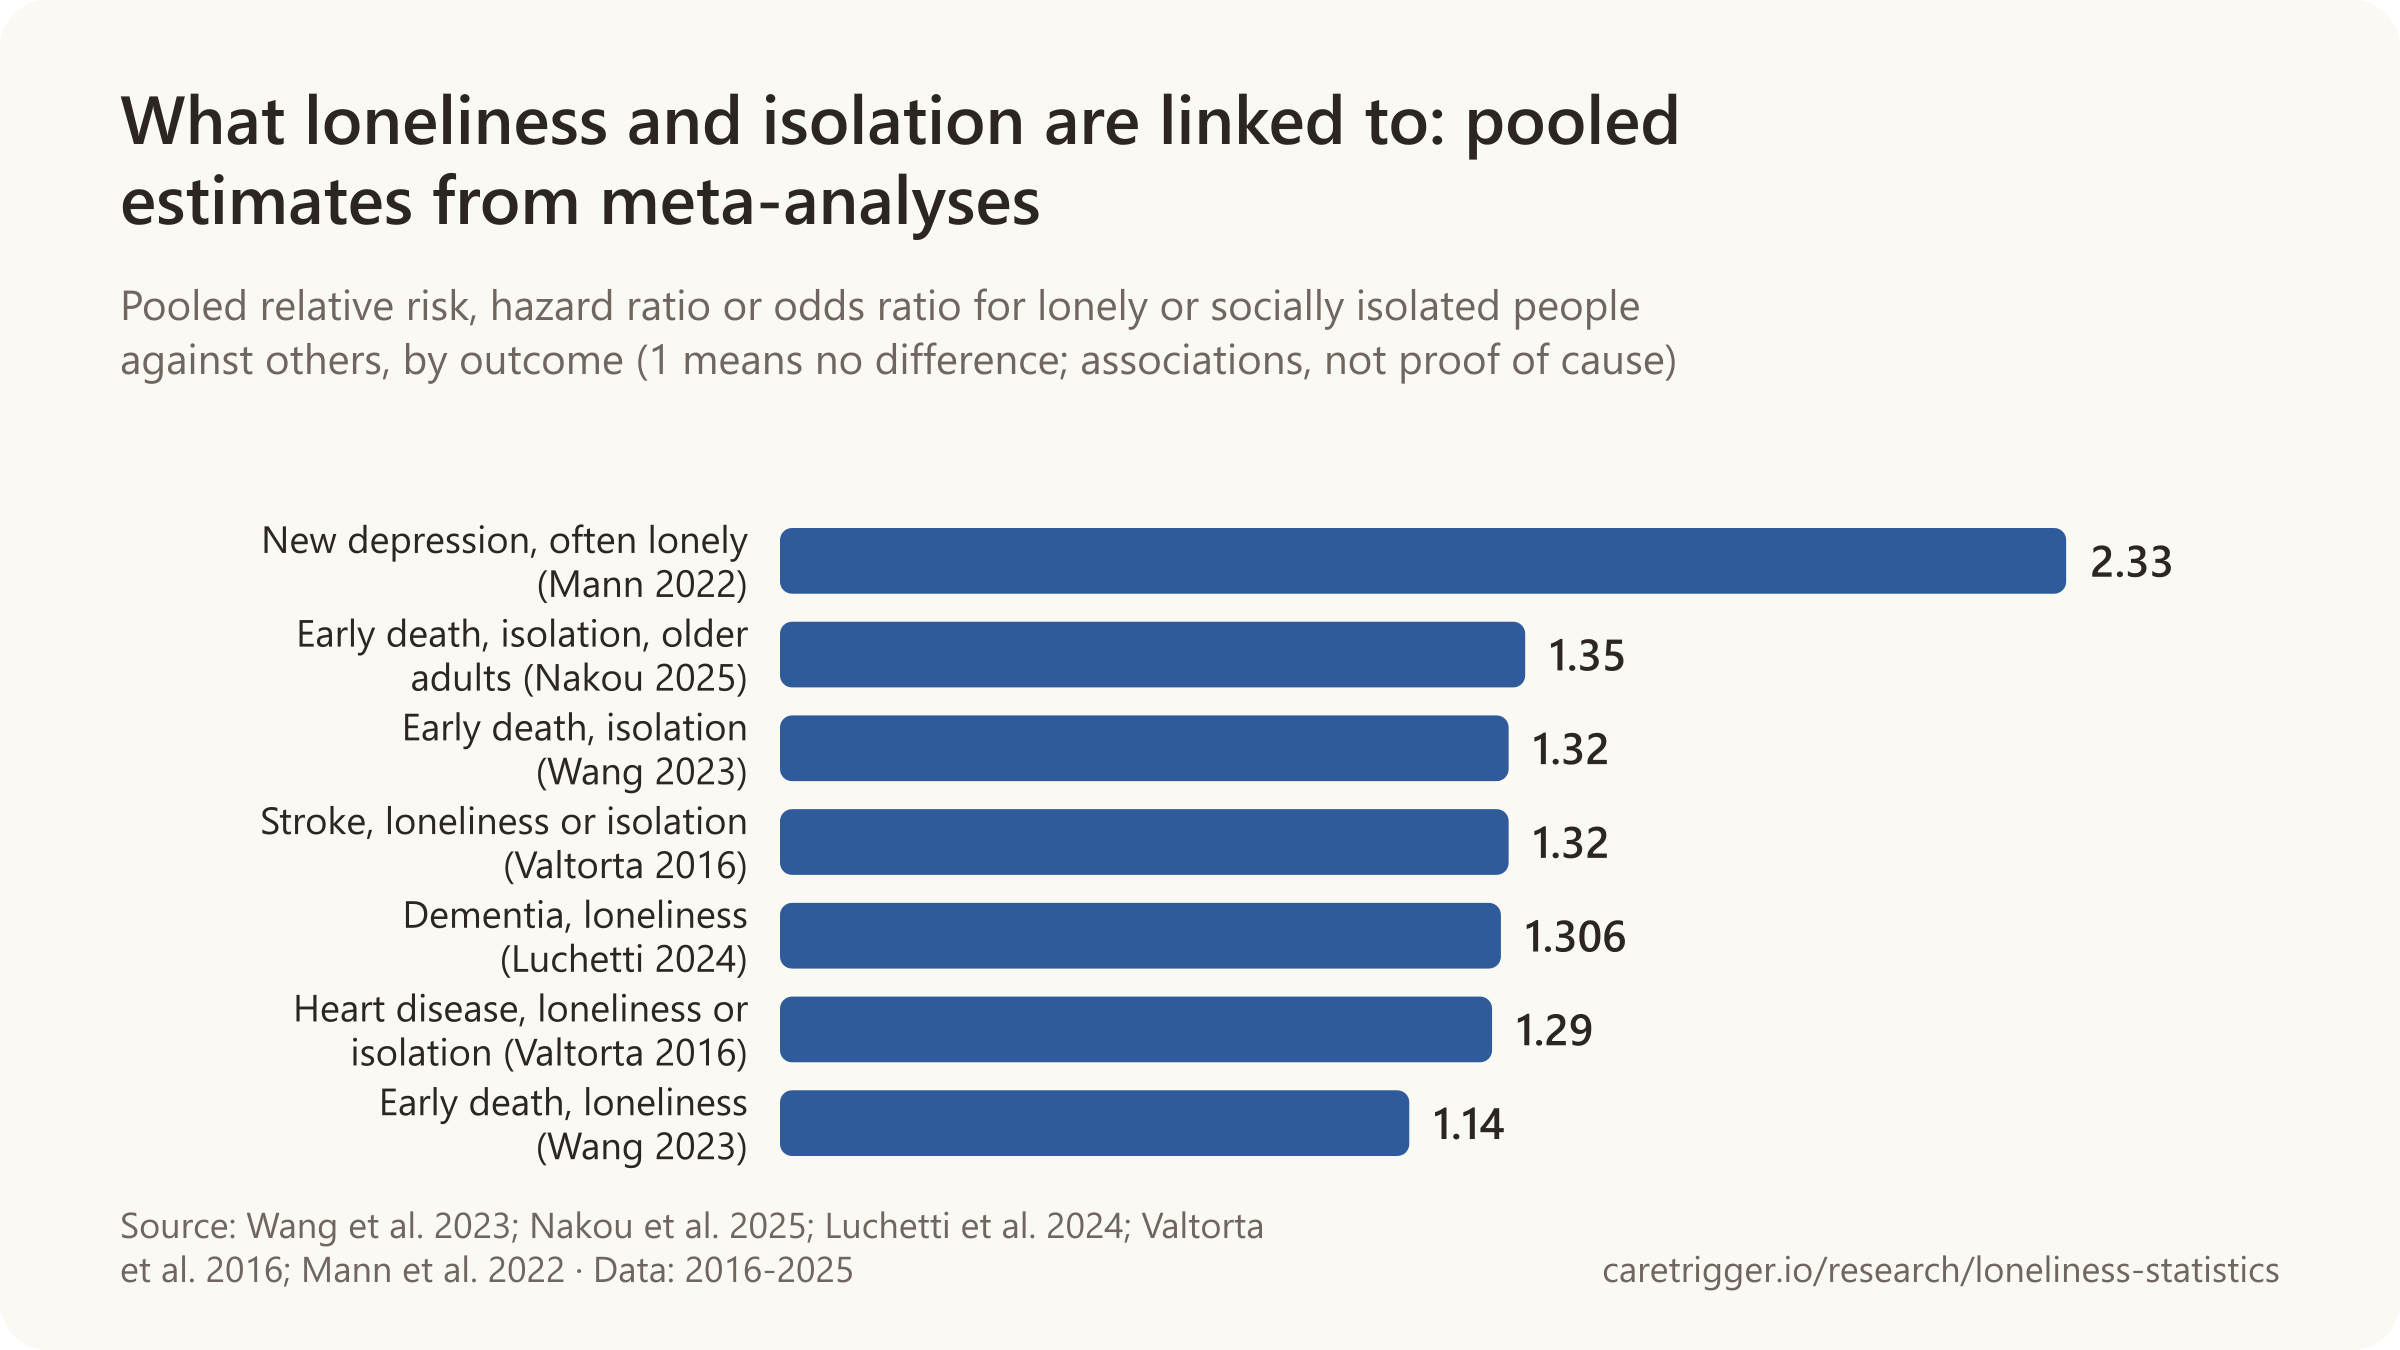
- Loneliness was associated with a 31% higher risk of dementia, in a meta-analysis of 608,561 people (2024).
- Adults who were often lonely had 2.33 times the odds of new depression, pooling eight cohort studies (2022).
- For 20 of 26 diseases linked to loneliness, a genetic analysis found the link was probably not causal (Nature Human Behaviour, 2024).
Is loneliness as bad as smoking 15 cigarettes a day? The comparison comes from a 2010 meta-analysis of social relationships and survival. Its authors word it as "lacking social connection is comparable to smoking up to 15 cigarettes per day", for social connection measured several ways, loneliness among them; it is not a finding about loneliness alone.
These are associations from observational studies: lonely and isolated people differ from others in many ways, and poor health can cause loneliness as well as follow it. Effects shrink when studies adjust for health and circumstances.
Sources: Nature Human Behaviour (2024, 2023); Social Psychiatry and Psychiatric Epidemiology; Aging Clinical and Experimental Research; Heart; Nature Mental Health
More statistics (116)
Loneliness was associated with a 14% higher risk of all-cause mortality (pooled effect size 1.14, 95% CI 1.08-1.20), less than half the excess seen for social isolation, in the 90-cohort meta-analysis (Wang et al., 2023).
- Loneliness (the subjective feeling) was associated with a 26% higher likelihood of death (odds ratio 1.26) in the 70-study meta-analysis, the smallest of the three social-deficit effects (Holt-Lunstad et al., 2015).
- Living alone is associated with a 32% higher likelihood of death (odds ratio 1.32), slightly more than social isolation (1.29) or loneliness (1.26), in a meta-analysis of studies from 1980 to 2014 (Holt-Lunstad et al., Perspectives on Psychological Science, 2015).
- An odds ratio of 1.19 (95% CI 0.99-1.44), not statistically significant, linked living with others rather than alone to survival, the weakest of the social measures in the 148-study meta-analysis (Holt-Lunstad, Smith and Layton, PLoS Medicine, 2010).
- 50% greater likelihood of survival for people with adequate social relationships is an effect the authors called comparable with quitting smoking, the origin of the much-repeated smoking comparison (Holt-Lunstad, Smith and Layton, PLoS Medicine, 2010).
- 9% higher risk of cancer death (pooled effect size 1.09, 95% CI 1.01-1.17) was associated with loneliness in the general population, in a meta-analysis of 90 cohort studies (Wang et al., Nature Human Behaviour, 2023).
Early death
- In the English Longitudinal Study of Ageing (4,888 people followed 8.5 years), living alone was associated with a 20% higher risk of death (HR 1.20, 95% CI 1.04-1.38) after adjusting for wealth, health, behaviours and loneliness (Abell & Steptoe, Age and Ageing, 2021).
- Lonely older adults were more likely to die within six years (22.8% vs 14.2%; adjusted HR 1.45, 95% CI 1.11-1.88) and to lose ability in daily activities (24.8% vs 12.5%; adjusted RR 1.59) (Perissinotto et al., 2012).
- 22% higher risk of death from any cause (pooled hazard ratio 1.22, 95% CI 1.10-1.35) was associated with loneliness in a meta-analysis of 35 articles covering 77,220 participants (Rico-Uribe et al., PLoS One, 2018).
- 9% higher risk of death from any cause (pooled hazard ratio 1.09, 95% CI 1.06-1.12) was associated with loneliness among older adults, pooling 36 studies of 128,927 people (Zhou, Yang and Gao, Psychiatry Research, 2023).
- 10% higher risk of death (pooled hazard ratio 1.10, 95% CI 1.06-1.14) was associated with loneliness in older adults, an effect the authors describe as small (Schutter et al., European Journal of Ageing, 2022).
- A hazard ratio of 0.92 (95% CI 0.78-1.09), not statistically significant, linked loneliness to death among 6,500 English adults aged 52 and over once demographics and baseline health were taken into account (Steptoe et al., PNAS, 2013).
- 77% higher risk of death from any cause (hazard ratio 1.77, 95% CI 1.61-1.95) was found among UK Biobank participants who lived alone and never had visits from friends or family, compared with those who had daily visits and did not live alone (Foster et al., BMC Medicine, 2023).
- 33% higher risk of death from any cause (hazard ratio 1.33, 95% CI 1.22-1.46) was found among UK Biobank participants who never had visits from friends or family but did not live alone, compared with daily visits (Foster et al., BMC Medicine, 2023).
- 63% higher risk of cardiovascular death (hazard ratio 1.63, 95% CI 1.51-1.76) was found among UK Biobank participants isolated on both functional and structural measures of social connection (Foster et al., BMC Medicine, 2023).
- 2.34 times the risk of death (hazard ratio 2.34, 95% CI 1.58-3.46) was found for the most socially isolated Black men compared with the least isolated, in a US cohort of 580,182 adults followed from 1982-83 to 2012 (Alcaraz et al., American Journal of Epidemiology, 2019).
- 60% higher risk of death (hazard ratio 1.60, 95% CI 1.41-1.82) was found for the most socially isolated white men compared with the least isolated, in a US cohort of 580,182 adults (Alcaraz et al., American Journal of Epidemiology, 2019).
- 2.13 times the risk of death (hazard ratio 2.13, 95% CI 1.44-3.15) was found for the most socially isolated Black women compared with the least isolated, in a US cohort of 580,182 adults (Alcaraz et al., American Journal of Epidemiology, 2019).
- 84% higher risk of death (hazard ratio 1.84, 95% CI 1.68-2.01) was found for the most socially isolated white women compared with the least isolated, in a US cohort of 580,182 adults (Alcaraz et al., American Journal of Epidemiology, 2019).
- 30% higher risk of cardiovascular death (combined hazard ratio 1.30, 95% CI 1.09-1.54) was associated with loneliness in older adults (Nakou et al., Aging Clinical and Experimental Research, 2025).
- 49% higher risk of death from any cause (hazard ratio 1.49, 95% CI 1.21-1.84) was associated with living alone among older men, higher than among older women (Nakou et al., Aging Clinical and Experimental Research, 2025).
- 91% higher risk of death from any cause (hazard ratio 1.91, 95% CI 1.22-3.01) was associated with loneliness among older adults with cardiovascular disease, the highest of the subgroups (Nakou et al., Aging Clinical and Experimental Research, 2025).
- 13% higher risk of death (pooled hazard ratio 1.13, 95% CI 1.01-1.26) was associated with loneliness among adults aged 65 and over across Latin American countries in the 10/66 Dementia Research Group surveys (Gao et al., International Journal of Public Health, 2021).
- 58% higher risk of death (hazard ratio 1.58, 95% CI 1.03-2.41) was associated with loneliness among adults aged 65 and over in China, while no association was found in India (Gao et al., International Journal of Public Health, 2021).
- 25% higher risk of cancer death (hazard ratio 1.25, 95% CI 1.01-1.54) was associated with social isolation among 16,044 US adults followed 17 to 23 years in NHANES III, adjusting for age, gender and race or ethnicity (Fleisch Marcus et al., PLoS One, 2017).
- 34% higher risk of death from any cause (pooled hazard ratio 1.34, 95% CI 1.26-1.42) was associated with loneliness or social isolation among people with cancer, pooling 13 studies (Cheng et al., BMJ Oncology, 2025).
- 29% higher risk of death from any cause (hazard ratio 1.29, 95% CI 1.18-1.42) was associated with living alone in studies of people aged 65 and over, higher than in studies of people aged 50 or 75 and over (Nakou et al., Aging Clinical and Experimental Research, 2025).
- 3.74 times the risk of death (hazard ratio 3.74, 95% CI 1.82-7.70) was found among heart failure patients in southeast Minnesota who reported high perceived social isolation, compared with those reporting low isolation (Manemann et al., Journal of the American Heart Association, 2018).
- 10% higher risk of developing physical multimorbidity (adjusted hazard ratio 1.10, 95% CI 1.05-1.17) was associated with loneliness among adults aged 45 and over in five ageing cohorts across 19 countries (Zhou et al., Nature Communications, 2026).
- 25% higher risk of later loneliness (adjusted hazard ratio 1.25, 95% CI 1.20-1.30) was associated with physical multimorbidity among adults aged 45 and over in five ageing cohorts across 19 countries (Zhou et al., Nature Communications, 2026).
- 9% to 22% higher all-cause mortality for loneliness, and 32% to 33% for social isolation, is how the WHO Commission summarises recent meta-analyses of mostly older adults (WHO Commission on Social Connection, 2025).
Dementia
- 31% higher risk of dementia from any cause (hazard ratio 1.31, 95% CI 1.20-1.43) was associated with loneliness in a meta-analysis of 21 samples covering 608,561 people (Luchetti et al., Nature Mental Health, 2024).
- The 2024 Lancet standing Commission estimates that 14 modifiable risk factors, including social isolation, together account for 45.3% of dementia cases worldwide (Livingston et al., The Lancet, 2024).
- 58% higher risk of dementia (relative risk 1.58, 95% CI 1.19-2.09) was associated with more loneliness in a meta-analysis of 19 longitudinal cohort studies of the general population (Kuiper et al., Ageing Research Reviews, 2015).
- A relative risk of 1.38 (95% CI 0.98-1.94), not statistically significant, linked loneliness to dementia in a meta-analysis of 33 studies (Penninkilampi et al., Journal of Alzheimer's Disease, 2018).
- 40% higher risk of dementia was associated with loneliness among 12,030 US adults in the Health and Retirement Study followed for up to 10 years, an association that held after accounting for social isolation (Sutin et al., Journals of Gerontology: Series B, 2020).
- 39% higher risk of Alzheimer's disease (hazard ratio 1.39, 95% CI 1.29-1.50) was associated with loneliness, pooling 5 samples (Luchetti et al., Nature Mental Health, 2024).
- 74% higher risk of vascular dementia (hazard ratio 1.74, 95% CI 1.48-2.03) was associated with loneliness, pooling 3 samples (Luchetti et al., Nature Mental Health, 2024).
- 15% higher risk of cognitive impairment (hazard ratio 1.15, 95% CI 1.11-1.19) was associated with loneliness, pooling 16 samples of 103,387 people (Luchetti et al., Nature Mental Health, 2024).
- 49% higher risk of dementia (hazard ratio 1.49, 95% CI 1.37-1.61) was associated with prolonged loneliness and social isolation in older people, in a meta-analysis of 10 studies (Lazzari and Rabottini, International Journal of Psychiatry in Clinical Practice, 2022).
- 72% higher risk of Alzheimer's disease (relative risk 1.72, 95% CI 1.32-2.23) was associated with loneliness in a meta-analysis of 16 cohort studies of 62,345 people (Qiao et al., Frontiers in Human Neuroscience, 2022).
- 23% higher risk of dementia (relative risk 1.23, 95% CI 1.16-1.31) was associated with loneliness in a meta-analysis of 16 cohort studies of 62,345 people (Qiao et al., Frontiers in Human Neuroscience, 2022).
- 26% higher risk of dementia (relative risk 1.26, 95% CI 1.14-1.40) was associated with loneliness, pooling 8 longitudinal studies of adults with mean ages from 64.9 to 83.1 years (Lara et al., Ageing Research Reviews, 2019).
- 42% higher risk of dementia (relative risk 1.42, 95% CI 1.26-1.60) was associated with loneliness in a meta-analysis of 32 longitudinal studies of social integration (Wang et al., Journal of the American Geriatrics Society, 2023).
- 30% higher risk of dementia (relative risk 1.30, 95% CI 1.15-1.46) was associated with living alone, pooling 12 longitudinal studies (Desai et al., Ageing Research Reviews, 2020).
- 20% faster cognitive decline over 12 years was associated with loneliness among 8,382 US adults aged 65 and over, controlling for baseline depression and other confounders (Donovan et al., International Journal of Geriatric Psychiatry, 2017).
- 64% higher odds of developing dementia within 3 years (odds ratio 1.64, 95% CI 1.05-2.56) were found for older people who felt lonely, while social isolation showed no association, among 2,173 community-living older people in Amsterdam (Holwerda et al., Journal of Neurology, Neurosurgery and Psychiatry, 2014).
- More than twice the risk of Alzheimer disease was found for the loneliest older adults, at the 90th percentile of a 5-item loneliness scale, compared with the least lonely, among 823 people from Chicago-area senior facilities followed up to 4 years (Wilson et al., Archives of General Psychiatry, 2007).
Heart disease and stroke
- 29% higher risk of coronary heart disease (pooled relative risk 1.29, 95% CI 1.04-1.59) was associated with poor social relationships, meaning loneliness or social isolation, in a meta-analysis of 11 longitudinal studies from high-income countries (Valtorta et al., Heart, 2016).
- Among Chinese adults over 65 living alone, often feeling lonely was associated with twice the risk of new cardiovascular disease (HR 2.17, 95% CI 1.20-3.93) compared with never feeling lonely; loneliness overall was associated with a 28% higher risk (HR 1.28), while living alone per se showed no association (Tan et al., Journals of Gerontology A, 2024).
- 84% of the excess heart-attack risk linked to social isolation was explained by conventional risk factors, leaving a hazard ratio of 1.07 (95% CI 0.99-1.16) among 479,054 UK Biobank participants followed 7.1 years (Hakulinen et al., Heart, 2018).
- 83% of the excess stroke risk linked to social isolation was explained by conventional risk factors, leaving a hazard ratio of 1.06 (95% CI 0.96-1.19) among 479,054 UK Biobank participants (Hakulinen et al., Heart, 2018).
- A hazard ratio of 1.06 (95% CI 0.96-1.17), not statistically significant, linked loneliness to a first heart attack once other risk factors were accounted for, down from 1.49 before adjustment, in UK Biobank (Hakulinen et al., Heart, 2018).
- 27% higher odds of new heart disease or stroke (odds ratio 1.27, 95% CI 1.01-1.57) were associated with loneliness among 5,397 adults over 50 in England followed 5.4 years, while social isolation showed no association (Valtorta et al., European Journal of Preventive Cardiology, 2018).
- 56% higher risk of stroke (hazard ratio 1.56, 95% CI 1.11-2.18) was found among US adults aged 50 and over whose loneliness stayed high across two assessments, compared with those whose loneliness stayed low (Soh et al., eClinicalMedicine, 2024).
- 25% higher risk of stroke (hazard ratio 1.25, 95% CI 1.06-1.47) was associated with high loneliness, above 6 on the 3-9 UCLA scale, among 12,161 US adults aged 50 and over followed 10 to 12 years (Soh et al., eClinicalMedicine, 2024).
- 13% to 27% higher risk of cardiovascular disease was found among US women aged 65 to 99 with both high social isolation and high loneliness scores, compared with women low on both (Golaszewski et al., JAMA Network Open, 2022).
- 19% higher risk of heart failure (adjusted hazard ratio 1.19, 95% CI 1.11-1.27) was associated with loneliness among 464,773 UK Biobank participants followed a median 12.3 years (Liang et al., JACC: Heart Failure, 2023).
- 23% higher risk of heart failure needing hospital care (hazard ratio 1.23, 95% CI 1.08-1.41) was associated with social isolation among 36,457 postmenopausal US women followed a median 15 years (Cene et al., Journal of the American Heart Association, 2022).
- 68% higher risk of hospitalization (hazard ratio 1.68, 95% CI 1.18-2.39) was found among heart failure patients who reported high perceived social isolation, compared with low (Manemann et al., Journal of the American Heart Association, 2018).
- 16% higher risk of new cardiovascular disease (hazard ratio 1.16, 95% CI 1.10-1.22) was associated with high loneliness or social isolation in a meta-analysis of six studies of 104,511 middle-aged and older people published 2015-2023 (Albasheer et al., Scientific Reports, 2024).
- 20% higher risk of a cardiovascular disease diagnosis (adjusted hazard ratio 1.20, 95% CI 1.03-1.40) within five years was associated with loneliness among 24,687 Danish adults (Christiansen et al., Annals of Behavioral Medicine, 2021).
Depression, suicide and mental health
- 2.33 times the odds of new-onset depression (pooled adjusted odds ratio 2.33, 95% CI 1.62-3.34) were found for adults who were often lonely compared with those who were not, pooling eight cohorts (Mann et al., Social Psychiatry and Psychiatric Epidemiology, 2022).
- 60% higher odds of depression (pooled odds ratio 1.60, 95% CI 1.39-1.84) were found among socially isolated or digitally excluded older adults, pooling analyses of about 111,784 participants (Byeon, Medicine, 2026).
- 2.24 times the odds of suicidal ideation (odds ratio 2.24, 95% CI 1.73-2.90) were associated with perceived loneliness among older adults, pooling 31 studies of 203,152 participants (Chang, Chan and Yip, Social Science & Medicine, 2017).
- 2.16 times the risk of death by suicide (hazard ratio 2.16, 95% CI 1.51-3.09) was found among UK Biobank men who lived alone, independent of loneliness, over nine years of follow-up (Shaw et al., Journal of Affective Disorders, 2021).
- 23.5% of lonely people in Spain had taken antidepressants or stimulants in the previous two weeks, against 5.3% of people who were not lonely (SoledadES, 2023).
Other conditions and how strong the evidence is
- 20 of 26 diseases linked to loneliness showed non-causal associations in Mendelian randomization analysis, including cardiovascular diseases, type 2 diabetes and obesity; only 6 were potentially causal (Liang et al., Nature Human Behaviour, 2024).
- 14.4 mm Hg greater rise in systolic blood pressure over four years was predicted for the loneliest compared with the least lonely, in a five-year study of 229 Chicago adults aged 50 to 68 (Hawkley, Thisted, Masi and Cacioppo, Psychology and Aging, 2010).
- 25% higher risk of Parkinson disease (hazard ratio 1.25, 95% CI 1.12-1.39) was associated with loneliness among 491,603 UK Biobank participants over 15 years, after accounting for depression, genetic risk and other factors (Terracciano et al., JAMA Neurology, 2023).
- 89% higher risk of hospital admission for self-harm (hazard ratio 1.89, 95% CI 1.57-2.28) was associated with loneliness among UK Biobank women in fully adjusted models (Shaw et al., Journal of Affective Disorders, 2021).
- 74% higher risk of hospital admission for self-harm (hazard ratio 1.74, 95% CI 1.40-2.16) was associated with loneliness among UK Biobank men in fully adjusted models (Shaw et al., Journal of Affective Disorders, 2021).
- 41% higher odds of worsening frailty (pooled odds ratio 1.41, 95% CI 1.16-1.72) were associated with loneliness at baseline among community-dwelling older adults, pooling two longitudinal studies (Kojima et al., Ageing Research Reviews, 2022).
- 83% higher odds of frailty (pooled odds ratio 1.83, 95% CI 1.76-1.89) were associated with loneliness in a meta-analysis of 8 cohort studies of 78,769 participants published 2018-2025 (Zhao et al., Archives of Gerontology and Geriatrics, 2026).
- 24% higher risk of type 2 diabetes (hazard ratio 1.24, 95% CI 1.14-1.34) was associated with feeling lonely often among 465,290 Danish adults aged 16 and over followed 6.3 years on average (Rosenkilde et al., BMJ Open Diabetes Research & Care, 2024).
- 2.19 times the odds of developing type 2 diabetes over 20 years (adjusted odds ratio 2.19, 95% CI 1.16-4.15) were found for the loneliest participants compared with those not lonely, among 24,024 adults in central Norway (Henriksen, Nilsen and Strandberg, Diabetologia, 2023).
- 32% higher risk of type 2 diabetes (hazard ratio 1.32, 95% CI 1.11-1.57) was associated with loneliness in a meta-analysis of nine prospective cohorts of 1,112,887 people followed 10.7 years on average (Ezzatvar et al., Diabetes Research and Clinical Practice, 2025).
- 1.90 times the risk of a type 2 diabetes diagnosis within five years (adjusted hazard ratio 1.90, 95% CI 1.42-2.55) was associated with loneliness among 24,687 Danish adults (Christiansen et al., Annals of Behavioral Medicine, 2021).
- 30 of 56 diseases were associated with loneliness in UK Biobank over a median 12.2 years, yet genetic (Mendelian randomization) analysis found no causal link for 20 of the 26 that could be tested (Liang et al., Nature Human Behaviour, 2024).
- 15% more emergency department visits (incidence rate ratio 1.15, 95% CI 1.06-1.24) were associated with loneliness among older adults, in a meta-analysis of 34 studies (Hou et al., Innovation in Aging, 2026).
- 2.13 times the odds of moving into a care home (odds ratio 2.13, 95% CI 1.43-3.17) were associated with loneliness measured by the depression-scale item, among older adults in the English Longitudinal Study of Ageing, 2002-2015 (Hanratty et al., Age and Ageing, 2018).
- 33.1% of lonely people in Spain had taken tranquilizers or relaxants in the previous two weeks, against 12.9% of people who were not lonely, in a survey for the State Observatory on Unwanted Loneliness (SoledadES, 2023).
Sources: Nature Human Behaviour (2023, 2024); Association for Psychological Science; Perspectives on Psychological Science; PLoS Medicine; Dr. Julianne Holt-Lunstad, Social Connection and Health; Age and Ageing (2018, 2021); The Lancet Public Health; Neurology; Archives of Internal Medicine; Maturitas; BMJ Open; PLoS One (2017, 2018, 2023); Psychiatry Research; European Journal of Ageing; Proceedings of the National Academy of Sciences; BMJ Global Health; BMC Medicine; American Journal of Epidemiology; Aging Clinical and Experimental Research; International Journal of Public Health; BMJ Oncology; Journal of the American Heart Association (2018, 2022); Nature Communications; World Health Organization; Office of the US Surgeon General; Nature Mental Health; The Lancet; Ageing Research Reviews (2015-2022); Journal of Alzheimer's Disease; Journals of Gerontology: Series B; International Journal of Psychiatry in Clinical Practice; Journal of the American Geriatrics Society (2022, 2023); Frontiers in Human Neuroscience; International Journal of Geriatric Psychiatry; Journal of Neurology, Neurosurgery and Psychiatry; Archives of General Psychiatry; Journals of Gerontology: Series A (2024); Heart (2016, 2018); National Academies of Sciences, Engineering, and Medicine; European Journal of Preventive Cardiology; eClinicalMedicine; JAMA Network Open; JACC: Heart Failure; Scientific Reports; Annals of Behavioral Medicine; Social Psychiatry and Psychiatric Epidemiology; Medicine; Social Science & Medicine; Journal of Affective Disorders; Observatorio Estatal de la Soledad No Deseada, Fundación ONCE; Psychology and Aging; JAMA Neurology; Journal of the American Medical Directors Association; Archives of Gerontology and Geriatrics; BMJ Open Diabetes Research & Care; Diabetologia; Diabetes Research and Clinical Practice; Innovation in Aging; JAMA Internal Medicine
12 / Deaths and costs
How many deaths and how much money are linked to loneliness?
The WHO's model attributes about 871,000 deaths a year to loneliness, one risk estimate applied to every age and region (WHO, 2014-2019).

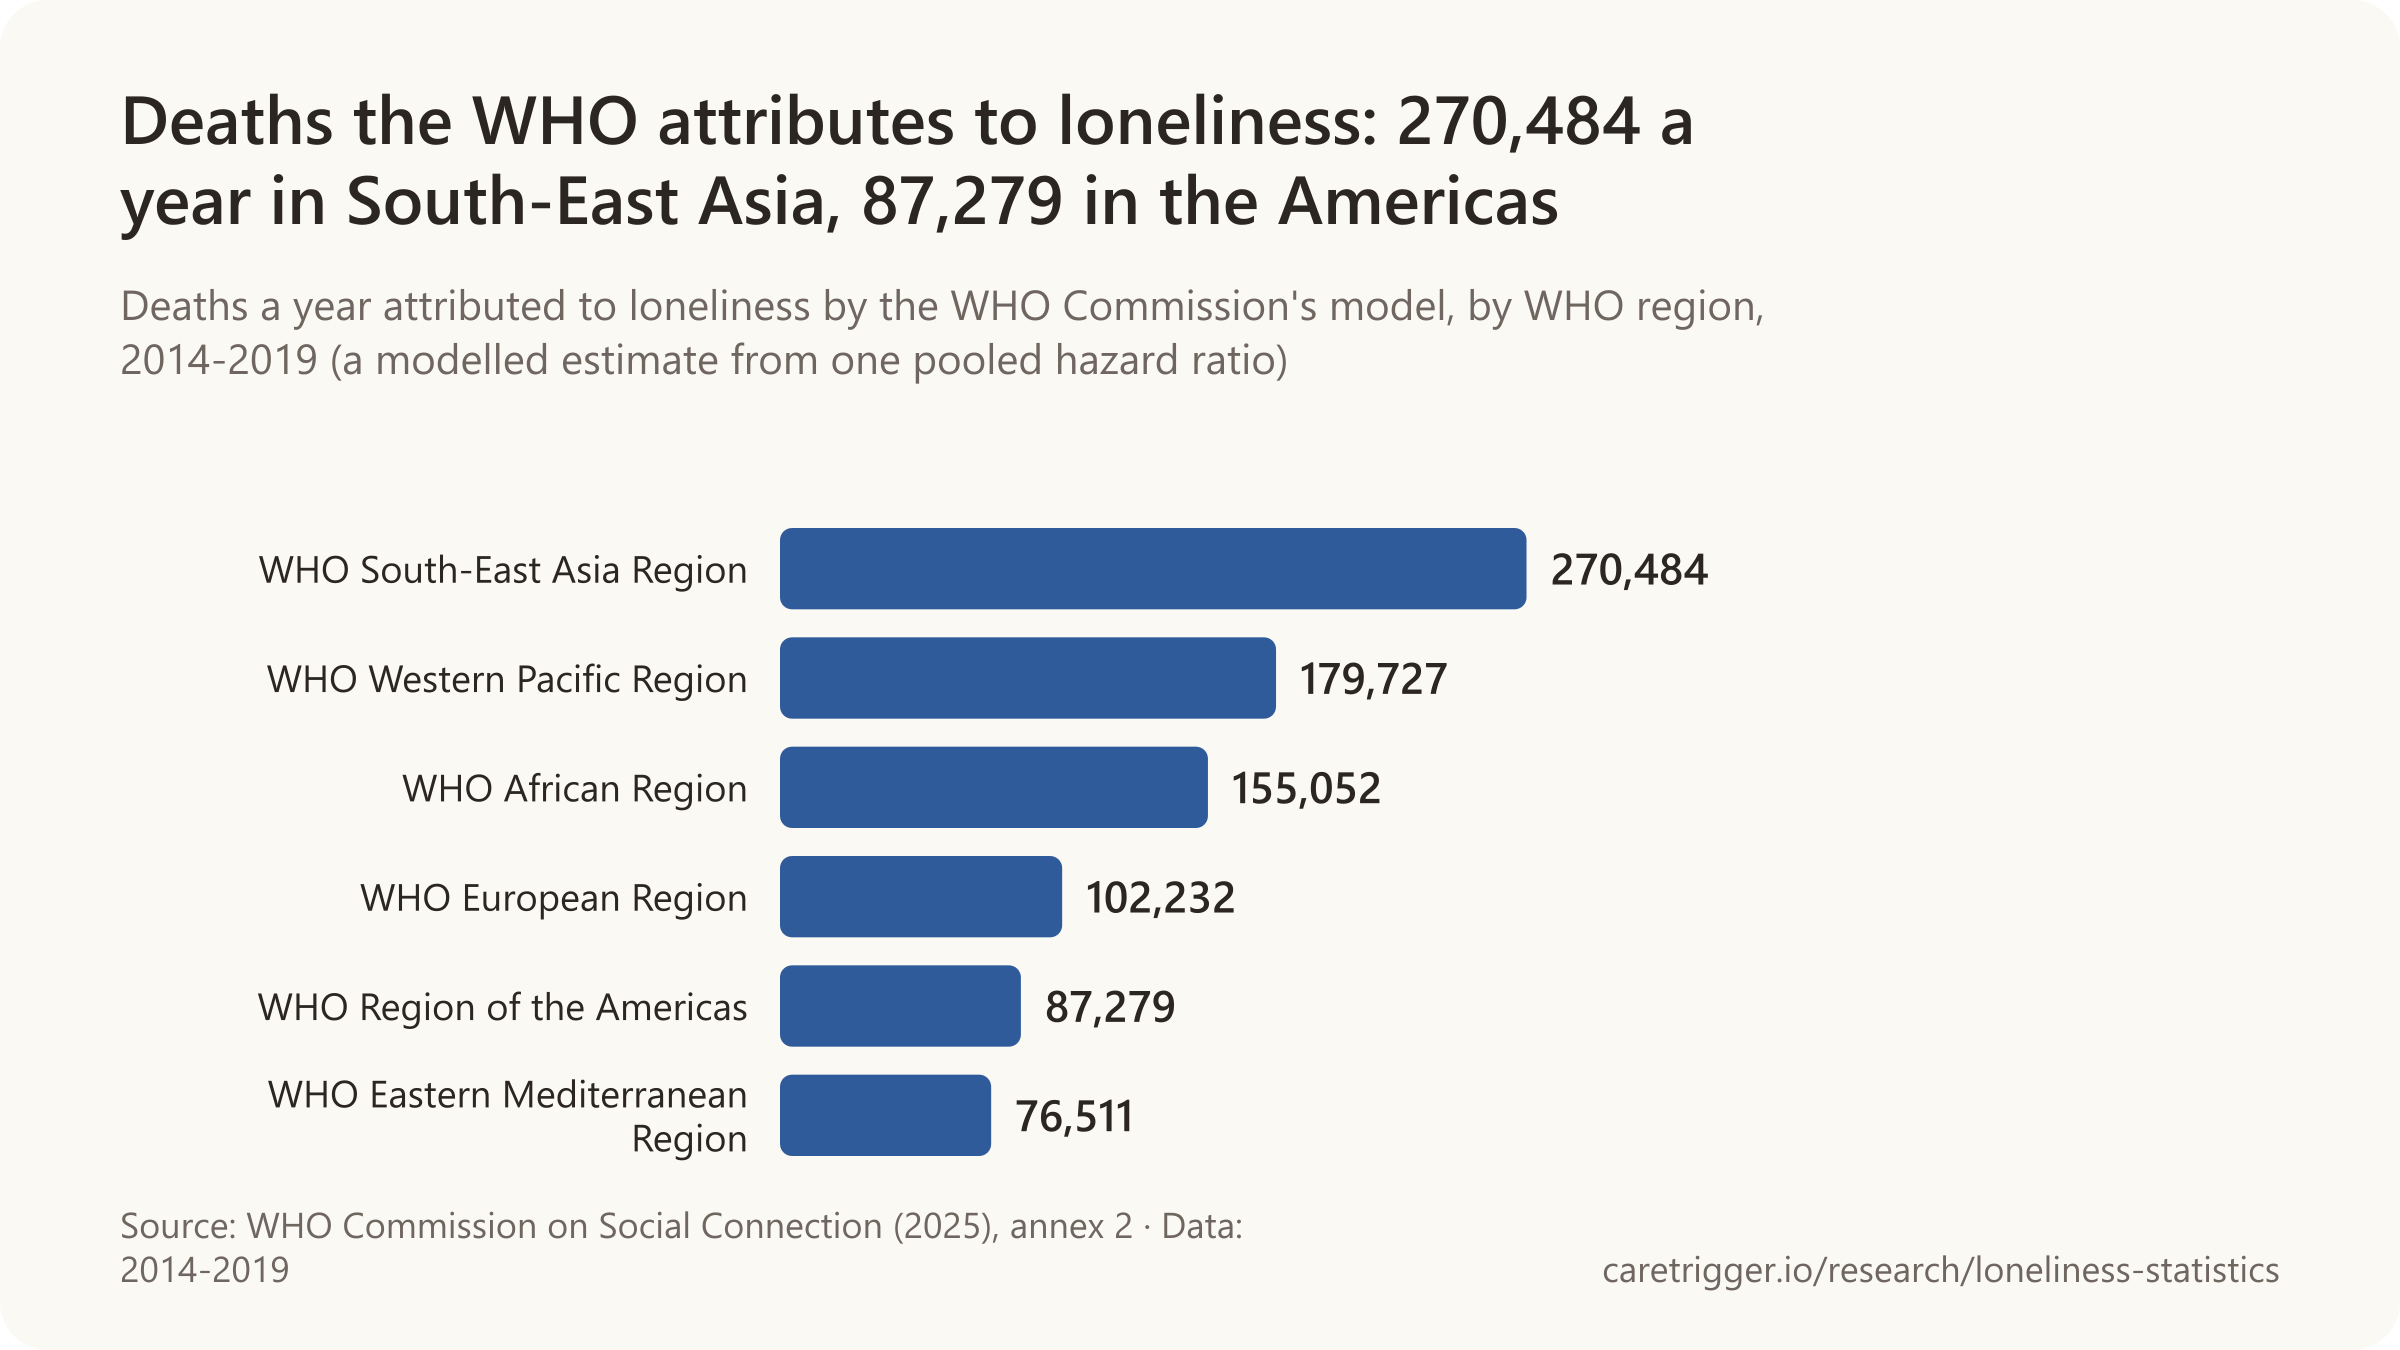
- Loneliness on its own was associated with $768 less Medicare spending a year, isolation with more (Journal of Aging and Health, 2017).
- The UK government values severe loneliness at about £9,900 a year per person in wellbeing, health and productivity (DCMS, 2020).
The WHO's 871,000 is not a count of people who died of loneliness, or of people who died alone. People found dead alone at home are on our page of statistics on dying alone at home.
Sources: World Health Organization; AARP Public Policy Institute; Journal of Aging and Health; Department for Digital, Culture, Media & Sport
More statistics (40)
871,286 deaths a year worldwide in 2014-2019 were attributed to loneliness by the WHO Commission, a modelled estimate that applies a population attributable fraction to all-cause deaths at ages 13 and over (WHO Commission on Social Connection, 2025).
- 66% of the deaths WHO attributes to loneliness, about 572,700 of 871,286 a year, were among people aged 60 and over, by our calculation from the WHO Commission's regional table (WHO Commission on Social Connection, 2025).
- 1.14, the hazard ratio for death linked to loneliness pooled by Wang et al. in 2023, is the single risk estimate the WHO Commission applied to every age group and region to model deaths attributed to loneliness (WHO Commission on Social Connection, 2025).
- 174,409 deaths a year among people aged 60 and over in WHO's South-East Asia Region were attributed to loneliness in 2014-2019, a population attributable fraction of 2.3%, by the Commission's model (WHO Commission on Social Connection, 2025).
- 143,811 deaths a year among people aged 60 and over in WHO's Western Pacific Region were attributed to loneliness in 2014-2019, a population attributable fraction of 1.3%, by the Commission's model (WHO Commission on Social Connection, 2025).
- 81,228 deaths a year among people aged 60 and over in WHO's European Region were attributed to loneliness in 2014-2019, a population attributable fraction of 1.1%, by the Commission's model (WHO Commission on Social Connection, 2025).
- 75,361 deaths a year among people aged 60 and over in WHO's African Region were attributed to loneliness in 2014-2019, a population attributable fraction of 3.1%, by the Commission's model (WHO Commission on Social Connection, 2025).
- 56,771 deaths a year among people aged 60 and over in WHO's Region of the Americas were attributed to loneliness in 2014-2019, a population attributable fraction of 1.2%, by the Commission's model (WHO Commission on Social Connection, 2025).
- 41,100 deaths a year among people aged 60 and over in WHO's Eastern Mediterranean Region were attributed to loneliness in 2014-2019, a population attributable fraction of 2.3%, by the Commission's model (WHO Commission on Social Connection, 2025).
Health care and Medicare
- Social isolation among older adults is associated with an estimated $6.7 billion in additional Medicare spending each year, based on 5,270 Health and Retirement Study participants linked to Medicare claims 2006-2012 (Flowers et al., AARP Public Policy Institute, 2017).
- $768 less in Medicare spending per beneficiary each year was associated with loneliness, in contrast to higher spending for objective isolation (Shaw et al., Journal of Aging and Health, 2017).
- $1,608 a year ($134 a month) more was spent by Medicare on each socially isolated older adult than on enrollees with typical social contact, after adjusting for health and other factors (Flowers et al., AARP Public Policy Institute, 2017).
- 29% higher likelihood of using skilled nursing facility care was found among socially isolated Medicare enrollees, whose monthly costs for such care were $75 higher on average (Flowers et al., AARP Public Policy Institute, 2017).
- $1,644 more in Medicare spending per beneficiary each year was associated with objective social isolation, while loneliness was associated with $768 less, in Health and Retirement Study data linked to Medicare claims (Shaw et al., Journal of Aging and Health, 2017).
- 31% greater risk of death was found among objectively isolated older Medicare beneficiaries despite their higher health-care use, while loneliness did not predict mortality (Shaw et al., Journal of Aging and Health, 2017).
- 53 studies on loneliness and health-care costs or service use gave inconsistent results, some finding excess costs and use and others lower, so a 2025 review could draw no confident conclusion (Eager et al., BJPsych Open, 2025).
- €5.6 billion a year in health-care service use and €495.9 million in medicines are attributed to loneliness in Spain, in an analysis for the State Observatory on Unwanted Loneliness (SoledadES, 2023).
- AU$2.7 billion a year, about AU$1,565 per person, is the estimated health-care cost of loneliness to the Australian economy, in a KPMG report for the Groundswell Foundation (Groundswell Foundation and KPMG, 2022).
- 11.1% higher mental health-care spending was directly associated with loneliness among 341,376 Dutch adults in fully adjusted models, alongside 0.5% higher spending on GP care (Meisters et al., International Journal of Public Health, 2021).
Costs to employers and economies
- £9,900 a year per person is the combined well-being, health and work productivity cost of severe loneliness, being often or always lonely, in an analysis for the UK culture department (DCMS, Loneliness monetisation report, 2020).
- US$2 billion to US$25.2 billion a year is the range of excess costs linked to loneliness and social isolation in national cost-of-illness studies, in a review of 15 economic studies converted to 2024 US dollars (Engel et al., PharmacoEconomics, 2025).
- €14 billion a year is the estimated total cost of loneliness in Spain, counting health care, lost productivity and lost quality of life, in an analysis by university economists for the State Observatory on Unwanted Loneliness (SoledadES, 2023).
- 1.17% of Spain's gross domestic product in 2021 is the share the estimated cost of loneliness represents, in an analysis for the State Observatory on Unwanted Loneliness (SoledadES, 2023).
- €8 billion a year in lost productivity, about 0.67% of GDP, is attributed to loneliness in Spain, in an analysis for the State Observatory on Unwanted Loneliness (SoledadES, 2023).
- £2.5 billion a year is the estimated cost of loneliness to UK employers, including £2.1 billion in the private sector, in a New Economics Foundation model for the Co-op (New Economics Foundation, 2017).
- £1.62 billion a year in voluntary staff turnover is the largest part of the estimated cost of loneliness to UK employers (New Economics Foundation, 2017).
- £665 million a year in reduced productivity is attributed to employee loneliness in a New Economics Foundation model for the Co-op (New Economics Foundation, 2017).
- £220 million a year in time off by employees caring for relatives whose ill health is attributed to loneliness is part of the estimated cost to UK employers (New Economics Foundation, 2017).
- £20 million a year in sickness absence from depression, heart disease and stroke attributed to loneliness is the smallest part of the estimated cost to UK employers (New Economics Foundation, 2017).
- US$154 billion a year in stress-related absenteeism is the cost to US employers that Cigna-affiliated authors attribute to loneliness, an estimate from an insurer's survey of nearly 6,000 employees (Cigna, 2022).
- £9,537 a year per person, at least, is the wellbeing cost of severe loneliness in an analysis for the UK culture department (DCMS, Loneliness monetisation report, 2020).
- £109 a year per severely lonely person is the cost to health-care providers and employers of extra medical spending and sick days, in an analysis for the UK culture department (DCMS, Loneliness monetisation report, 2020).
- £330 a year per severely lonely person is the productivity loss borne by employers, in an analysis for the UK culture department (DCMS, Loneliness monetisation report, 2020).
Other figures
- 8.9% was the population attributable fraction of dementia the authors estimated for living alone, combining a pooled relative risk of 1.30 with UK Census data on how many people live alone (Desai et al., Ageing Research Reviews, 2020).
- 18% (95% CI 12-24) was the population attributable fraction for depression associated with loneliness one year on among adults aged 50 and over in England, falling to 11% after 12 years (Lee et al., The Lancet Psychiatry, 2021).
- 19.9% (95% CI 7.8-30.4) was the population attributable fraction of care home admissions associated with loneliness among older adults in England (Hanratty et al., Age and Ageing, 2018).
Estimates, not counts. Cost figures are modelled estimates from named studies, each with its own method: the UK government's wellbeing valuation, an economics think tank's estimate for employers, and an insurer-affiliated estimate of $154 billion in absenteeism for US employers, which we do not show as a fact.
Sources: World Health Organization; AARP Public Policy Institute; Journal of Aging and Health; BJPsych Open; Observatorio Estatal de la Soledad No Deseada, Fundación ONCE; Groundswell Foundation; International Journal of Public Health; Department for Digital, Culture, Media & Sport; PharmacoEconomics; New Economics Foundation for the Co-op; Cigna Newsroom; Personal Social Services Research Unit, London School of Economics; The Lancet; Ageing Research Reviews; The Lancet Psychiatry; Journals of Gerontology: Series A; Age and Ageing
13 / Data
Download the data
All 2,680 statistics on this page, each with its source, verbatim quote and locator: CSV · JSON
Data behind each chart (CSV, 39 files)
- How many Americans are lonely depends on the question: from 4.9% to 40.6%
- US adults lonely a lot of the previous day: 25% at the 2020 peak, 20% in February 2026
- Loneliness by age in the US: highest at 18-29 and again at 85 and older
- US adults usually or always lonely, by age, every Household Pulse cycle of 2024
- Japan: people lonely often or always, by age group, 2021-2025
- How often Europeans felt lonely in the past four weeks: 2018 and 2022
- Worldwide, girls aged 13-17 are the loneliest group and men 60 and older the least lonely
- Loneliness by world region: 24.3% in Africa, 10.1% in Europe
- Americans aged 50 to 80 lacking companionship: 33.9% in 2018, 41.6% in 2022, 33.4% in 2024
- Older Americans: 64% neither lonely nor isolated, 6% both
- Europeans who never contact a friend: 1.1% at 16-24, 15.5% at 75 and older
- What loneliness and isolation are linked to: pooled estimates from meta-analyses
- Deaths the WHO attributes to loneliness: 270,484 a year in South-East Asia, 87,279 in the Americas
- US adults lonely in 2024, every Household Pulse cycle: about 13% usually or always, about 41% at least sometimes
- Germany: adults lonely more often than sometimes, by age group, 2013-2021
- Germany: adults lonely more often than sometimes, all adults, women, men and people living alone, 2013-2021
- Germany: adults who fully agreed they often feel lonely, all adults and people over 75, 1992-2018
- Germany: people 70 to 85 and over 85 who were lonely, German Ageing Survey
- Finland: people lonely fairly often or all the time, adults and people 75 and older, 2013-2024
- Switzerland: people lonely very or quite often, all ages and 75 and older, 1997-2022
- Canada: people lonely always or often, by age group, every quarter since mid-2021
- Northern Ireland: people lonely often or always, and at least some of the time, by year
- Ireland: people lonely at least some of the time, by age group, 2020-2025
- Japan: women and men lonely often or always, 2021-2025
- South Korea: adults with no one to turn to, all adults and people 60 and older, 2009-2025
- People aged 16+ in England who felt lonely often or always, 2017-2026
- People aged 16 to 24 in England who felt lonely often or always, 2017-2025
- Adults in Great Britain lonely at least some of the time, every survey since March 2020
- People aged 50+ in England who said they often felt lonely, 2006-2016
- A fixed panel of adults aged 50+ in England who scored 3 or more on the 0-to-6 UCLA loneliness scale, 2008-2018
- People aged 15+ in the Netherlands who were strongly lonely, 2019-2025
- People aged 16 and over in Japan who felt lonely often or always, 2021-2025
- People aged 16 and over in Japan who felt lonely at least occasionally, 2021-2025
- People in Japan who live alone who felt lonely often or always, 2021-2024
- People aged 16 and over in Japan who scored 10-12 out of 12 on a 3-item UCLA loneliness scale, 2021-2025
- Chinese adults aged 45 and over who were socially isolated, 2011-2018
- Lonely often or always on a general loneliness question: Canada 14%, the US 12%, England 7%, Japan 5%
- US adults lonely a lot of the previous day, every Gallup reading since March 2020
- US adults aged 50-80 who said they felt isolated from others some of the time or often in the past year, 2018-2024
Charts and figures on this page may be reused with a link to https://caretrigger.io/research/loneliness-statistics as the source.
14 / Methodology
Methodology
What we included. Published figures on loneliness (the feeling) and social isolation (few contacts) for people of all ages, with older adults in focus: national statistics offices and government surveys, the WHO Commission on Social Connection, peer-reviewed studies and meta-analyses, and survey organisations' own polls (Gallup, Pew Research Center, AARP, the University of Michigan National Poll on Healthy Aging, Harvard's Making Caring Common). Commercial and charity surveys (an insurer's, a technology company's, charities') are labelled as such in each sentence.
How loneliness is measured. Surveys either ask directly ("How often do you feel lonely?") with answers such as always, usually or often, sometimes, rarely, never, over a reference period (the past week, four weeks or year), or score a short scale such as the 3-item UCLA Loneliness Scale (lacking companionship, feeling left out, feeling isolated) and count people above a cut-off. "Often or always" and "at least sometimes" give very different shares, so each statement names its question and threshold, each series keeps one question, and no chart or table mixes them. Online panels tend to find more loneliness than face-to-face or telephone samples.
Our calculations. The US figures by age from the National Health Interview Survey 2024 are our calculation from the public-use file, reproducing the published national estimate. Some country figures are sums of published answer categories (for example "often" plus "always"); the statement says so.
How each figure was verified. Every record carries the exact sentence or table cell from the source (quote) and where it sits (locator). A researcher confirmed each one against the source document, downloading and parsing PDFs, spreadsheets and statistical databases rather than reading web summaries of them; a script then re-fetched every source on the date shown at the top of the page, using publisher APIs and PDF text where the web page blocks automated access, and checked for the quote. Quotes the script could not reach were checked again against the researcher's saved copy of the source.
What we excluded. Figures we could not trace to a document, composite "loneliness rankings" with no published method, restatements that drop the question behind a number, and the claims described in the "Numbers we will not publish" notes. People found dead alone at home are on our dying alone page; distance from family and contact with adult children on our page on living far from aging parents.
Rounding and derivation. Numbers are reproduced as published. In the key statistics and in the short sentences at the top of each section, large counts may be rounded; the exact figure is under "More statistics" and in the dataset. Derived figures say so in the statement and name the inputs. The bold figure in each statement is a reading aid, not an edit.
Updates. Sources are re-checked and new figures added quarterly, timed to the releases that matter here: the Census Bureau's household surveys, Gallup's readings, the UK's Community and Engagement Survey and Opinions and Lifestyle Survey, Japan's national loneliness survey each spring, and the WHO's follow-up to its Commission. The next scheduled refresh is February 2027. Corrections are welcome through the support page.
Cite this page
CareTrigger. "Statistics on Loneliness and Social Isolation: How Many People Are Lonely, by Age and Country, and Who Is Most at Risk in Later Life." https://caretrigger.io/research/loneliness-statistics. Last updated 2026-11-17.
15 / FAQ
Frequently asked questions
How many people are lonely?
About one in six people worldwide (16%), by the WHO's 2025 estimate. In the US, 16.3 million adults always or usually feel lonely (Census, autumn 2026), 16% feel lonely or isolated all or most of the time (Pew) and 23.7% feel lonely at least sometimes (NHIS 2024); the answer depends on how often the question asks about.
What age group is the loneliest?
Young people, on most surveys: worldwide 20.9% of 13- to 17-year-olds are lonely against 11.8% of people 60 and older. Loneliness rises again among the oldest: 29.5% of Americans 85 and older feel lonely at least sometimes, as many as at 18 to 29. In the European Union's official survey people 65 and older are the loneliest group.
How many older adults are lonely?
In the US, 33.4% of adults aged 50 to 80 felt a lack of companionship some of the time or often in 2024, and 6% of people 65 and older feel lonely or isolated all or most of the time. Pooling 126 studies, 27.6% of adults 60 and older were lonely; in the UK, 940,000 people 65 and older are often lonely.
What is the difference between loneliness and social isolation?
Loneliness is the feeling of lacking connection; social isolation is having few contacts. They often occur apart: among older Americans in 2022-2023, 15% were lonely but not isolated, 15% isolated but not lonely, 6% both and 64% neither.
Is loneliness as bad as smoking 15 cigarettes a day?
Not as a statement about loneliness alone. The comparison comes from a 2010 meta-analysis of social relationships; its authors word it as lacking social connection being comparable to smoking up to 15 cigarettes a day. For loneliness on its own, a 2023 meta-analysis of 90 cohorts found a 14% higher risk of early death.
Are men lonelier than women?
About equally, overall: 15% of US men and 15% of women feel lonely or isolated all or most of the time, and worldwide 16.1% of women and 15.4% of men are lonely. Young US men stand out: 25% felt lonely a lot of the previous day, against an OECD median of 15%. Among people 65 and older, more women are lonely.
Which country is the loneliest?
It depends on the survey. In Gallup's 142-country survey of 2023, 45% of adults in Comoros felt lonely a lot of the previous day against 6% in Vietnam; by region, the WHO estimates 24.3% in Africa and 10.1% in Europe. In Europe's official survey, France had the highest share of people lonely most or all of the time in 2022.
How many people die from loneliness each year?
The WHO's model attributes about 871,000 deaths a year (2014-2019) to loneliness by applying one pooled hazard ratio to deaths in every age group and region; it is an estimate from associations, not a count of deaths caused by loneliness. About 66% of those modelled deaths are among people 60 and older.
Sources: World Health Organization (2025a, 2025b); U.S. Census Bureau; Pew Research Center (2025a, 2025b, 2025c); medRxiv; National Center for Health Statistics; OECD (2025a, 2025b); JAMA; Humanities and Social Sciences Communications; Age UK; Aging and Mental Health; Dr. Julianne Holt-Lunstad, Social Connection and Health; Nature Human Behaviour; Gallup (2025, 2024); Statistics Canada
16 / Sources
Sources
Every publication behind the figures on this page, by publisher. The dataset gives the source, the verbatim quote and its location for each statistic.
Show all 468 sources
Loading the list of sources…