Most older adults now carry a smartphone, and the share keeps rising: people who took up smartphones in middle age are turning 65, and those already older keep adopting them. Yet ownership still falls steeply after 75, differs widely between countries, and depends on how a survey asks. This page brings together how many seniors and older adults own or use a smartphone, cell phone or mobile phone and go online, by age and country and over time; what they use it for; who is still offline and why, the digital divide that remains, including among people who live alone; and what it means for health, getting help and scams. "Seniors" here means people aged 65 and over unless another age band is named.
01 / How many
How many seniors have a smartphone?
78% of US adults aged 65 and older own a smartphone (2025).[1]
Smartphones are now the norm among Americans past retirement age, and almost every older adult has a phone of some kind. The figures below come from different surveys, and each names what it counts: owning a smartphone, using one, or going online with a phone, and at what age.
- 95% of US adults aged 65 and older own a cellphone of any kind (2025).[1]
- 16% of US adults aged 65 and older own a cellphone that is not a smartphone (2025), against 2% of adults aged 18 to 29 (Pew Research Center, 2025).[1]
- 75.4% of US households headed by someone aged 65 or older had a smartphone in 2021, against 90.0% of all households and 97.9% of households headed by someone aged 15 to 34 (US Census Bureau, 2024).[8]
- 62.4% of US households headed by someone aged 65 or older had a smartphone in 2018, against 84.4% of all households (US Census Bureau, 2021).[9]
- 48.5% of US households headed by someone aged 65 or older had a smartphone in 2016, against 76.5% of all households (US Census Bureau, 2018).[10]
| Country, measure and age (year) | Share | Scope | Source |
|---|---|---|---|
| United Kingdom: personally use a smartphone, 65+ (2026) | 81% | UK adults aged 65 and over; personally use a smartphone (face-to-face survey, all participants base) · United Kingdom · 2026 (March-June) | [11] |
| Canada: have a smartphone for personal use, 65+ (2020) | 54.1% | Canadians aged 65+ (vs all 15+) who have a smartphone for personal use; percentage of all persons in the age group (asked of past-3-month internet users) · Canada (10 provinces) · 2020 | [12] |
| Japan: own a smartphone, 65+ (2025) | 59.2% | Persons aged 65+ in private households in Japan who own a smartphone (household-member survey, mail and online; share of all persons in the age group, non-response kept in the base) · Japan · 2025 (survey at end of August 2025) | [3] |
| South Korea: own a smartphone, 65+ (2023) | 76.6% | People aged 65+ in South Korea (community-dwelling, national survey), own a smartphone · South Korea · 2023 | [13] |
| Hong Kong: have a smartphone, 65+ (2025) | 89.7% | Persons aged 65+ in Hong Kong who had a smartphone at the time of enumeration · Hong Kong · 2025 | [14] |
| Singapore: own a smartphone, 60+ (2025) | 94% | Singapore residents aged 60+ who own a smartphone · Singapore · 2025 | [15] |
| Finland: have a smartphone in use, 65-74 (2025) | 87% | People aged 65-74 in Finland; have in use a mobile phone with a touch screen · Finland · 2025 | [16] |
| EU-27: went online on a mobile phone in the last 3 months, 65-74 (2025) | 70.3% | Individuals aged 65-74, EU-27; used the internet on a mobile phone or smartphone in the last 3 months, as % of ALL individuals in the age group · European Union (EU-27) · 2025 | [2] |
| Sweden: went online with a mobile phone, 65-74 (2025) | 88% | People aged 65-74 in Sweden; accessed the internet using a mobile phone or smartphone, % of all persons in the group · Sweden · 2025 | [17] |
| Switzerland: went online with a mobile phone, 60+ (2025) | 89.3% | Persons aged 60+ in Switzerland; device used for internet: mobile phone or smartphone, % of all persons in the group · Switzerland · 2025 | [18] |
| Netherlands: went online with a mobile phone, 75+ (2025) | 71.5% | Persons aged 75+ in the Netherlands; used a mobile phone or smartphone for internet (device used), % of all persons in the group · Netherlands · 2025 | [19] |
| Australia: went online with a mobile phone, 75+ (2025) | 88.1% | Australian adults aged 75+ who used a mobile phone to access the internet in the past 6 months (all adults 75+ in the base) · Australia · 6 months to June 2025 | [20] |
| Brazil: went online on a mobile phone in the last 3 months, 60+ (2025) | 58% | Individuals aged 60+ (vs all 10+) who used the internet on a mobile phone in the past 3 months · Brazil · 2025 | [21] |
| Chile: have a smartphone, 60+ (2022) | 51% | Persons aged 60+ who report having a smartphone (Encuesta Calidad de Vida en la Vejez 2022) · Chile · 2022 | [22] |
| 39 African countries: own a smartphone, 56+ (2021/2023) | 29% | Adults aged 56+ who personally own a mobile phone with internet access (Afrobarometer smartphone definition), 39-country average · 39 African countries (average) · 2021-2023 | [23] |
Why the numbers disagree
Four things move a figure by ten points or more: the age band, whether a survey asks about owning or using a phone, how it reaches people, and who runs it. Each pair below shows one of them.
- 90% of US adults aged 50+ own a smartphone in 2025, up from 55% in 2016.[24]
- 61% of US adults aged 65 and older owned a smartphone in early 2021, against 96% of adults aged 18 to 29 (Pew Research Center, 2022).[25]
- 65.6% of people aged 65 and older in the US used a smartphone or internet-connected cell phone in November 2021 (NTIA, 2024).[26]
- 72% of UK adults aged 75 and over personally used a smartphone in 2026, against 95% of all adults (Ofcom Technology Tracker, 2026).[11]
- 56% of UK adults aged 75 and over used a smartphone in autumn 2025 (Ofcom Adults' Media Literacy Tracker, 2026).[28]
- 74.5% of Brazilians aged 60 and older used the internet in the previous three months in 2025, compared with 90.5% of the whole population aged 10 and older (IBGE, PNAD Contínua ICT module 2025).[29]
- 54% of Brazilians aged 60 and older were internet users (used it in the past three months) in 2025, compared with 85% of the population aged 10 and older (Cetic.br, TIC Domicílios 2025).[30]
- 63% of people aged 75 and over in Ireland had used the internet in the last 3 months in 2025, up from 54% in 2024 (CSO, 2025).[31]
- 87.6% of people aged 75-89 in Ireland had used the internet in the last 3 months in 2025 (Eurostat ICT survey, 2026).[32]
| Period | Share of 50+ | Scope | Source |
|---|---|---|---|
| 2017 (November 16-27) | 70% | US adults aged 50+ who say they have/own a smartphone (AARP technology survey); GfK KnowledgePanel web survey · United States | [33] |
| 2019 (June 25-July 9) | 77% | US adults aged 50+ who say they have/own a smartphone (AARP technology survey); Ipsos online panel survey · United States | [34] |
| 2020 | 85% | US adults aged 50+ who say they have/own a smartphone (AARP technology survey); online survey (NORC panel and Dynata) · United States | [35] |
| 2021 | 84% | US adults aged 50+ who say they have/own a smartphone (AARP technology survey); online survey (NORC panel and Dynata) · United States | [35] |
| 2022 | 86% | US adults aged 50+ who say they have/own a smartphone (AARP technology survey); online survey (NORC panel and Dynata) · United States | [35] |
| 2023 | 89% | US adults aged 50+ who say they have/own a smartphone (AARP technology survey); online survey (NORC panel and Dynata) · United States | [35] |
| 2024 | 91% | US adults aged 50+ who say they have/own a smartphone (AARP technology survey); online survey (NORC panel and Dynata) · United States | [35] |
What changes a figure. Age band: AARP's widely quoted figure covers adults aged 50 and over, not seniors. Measure: owning a smartphone, using one, and having gone online with a phone in the last three months are different questions, and a household measure counts a home where anyone has one. Survey mode: Pew moved from telephone to web and mail interviews in 2023, which accounts for part of the jump in its figures after 2021, and online panels miss people who are not online at all. Survey house: two official surveys in the same country can differ by more than ten points. On this page every figure names its age band and its measure.
Numbers we will not publish. Several figures circulate without the age band or date that makes them true. "Up to 90% of people 65 and older now own smartphones" and "smartphone use among older adults soared from 55% to 90%" relabel AARP's figures for adults aged 50 and over. Pew's 2016 figures (17% of Americans aged 80 and over own a smartphone; 81% of richer seniors against 27% of poorer ones) are still presented as current; they are ten years old, and this page shows them with their year. "77% of seniors need help with a new device" comes from a 2013 survey. "45.2% of smartphone time goes on social media" and "two and a half hours a day" do not appear in the small Norwegian study they are attributed to. "43% of older Australians stopped using their smartphones" misreads a 2017 survey of smartphone access. "27.2% of Koreans aged 70 and over have a smartphone" is the share who call the smartphone their essential medium, not the share who own one, which is far higher. "80% of UK over-65s own a smartphone" comes from Statista, not from Ofcom's own surveys. If you know the original source of any of these, tell us.
02 / Growth
Is smartphone use among seniors growing?
71.7% of people aged 65 and older in the US used a smartphone or internet-connected cell phone in November 2023, up from 6.6% in July 2011 (NTIA, 2024).[26]
Yes, and from two directions. Each year the generation turning 65 arrives with smartphones already in hand, and people who are already older keep taking them up. The charts below set each older age group beside the one ten years younger in the same survey, so the next seniors can be seen coming.
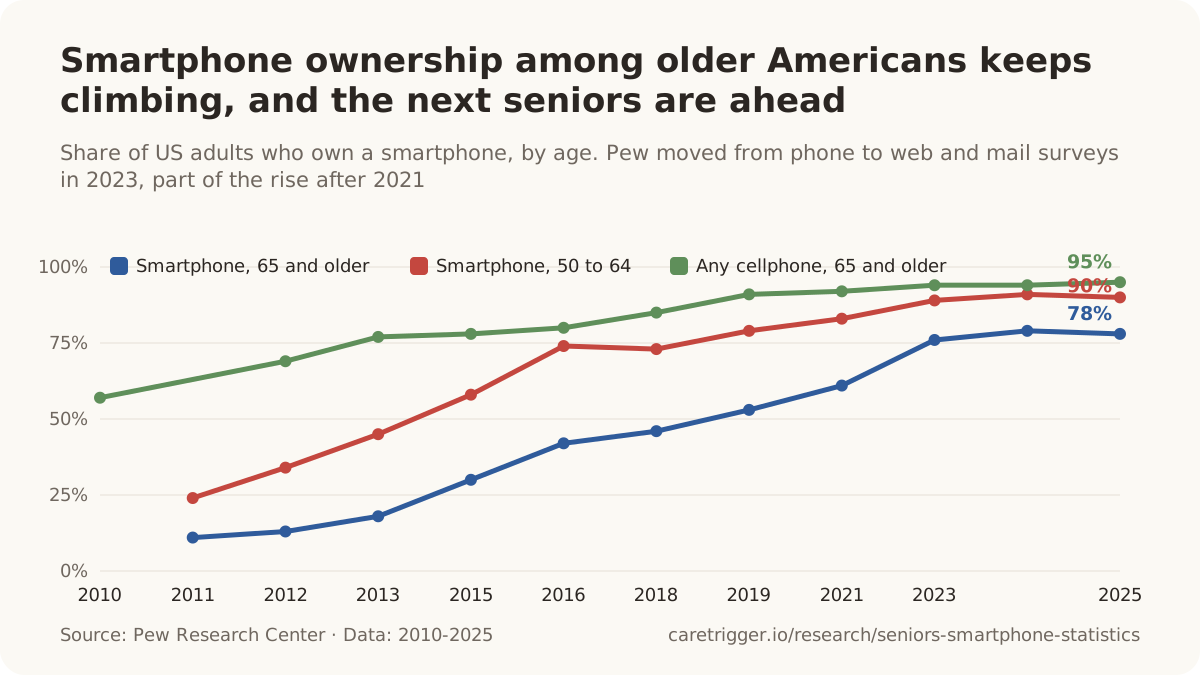
- 79% of US adults aged 65 and older owned a smartphone in 2024, against 91% of those aged 50 to 64 (Pew Research Center, 2024).[36]
- 92% of US adults aged 18 to 49 owned a smartphone in 2025, statistically level with 90% of adults aged 50 and older (AARP Research, 2025).[37]
| Period | Share of 65+ | Scope | Source |
|---|---|---|---|
| 2011 (July) | 6.6% | US civilian non-institutional population aged 65+ who use an internet-enabled mobile phone (NTIA variable mobilePhoneUser; 2017-2023 question: "What about a smartphone, or a cell phone that connects to the Internet?"; household respondent may report for others) · United States | [26] |
| 2013 (July) | 17.0% | US civilian non-institutional population aged 65+ who use an internet-enabled mobile phone (NTIA variable mobilePhoneUser; 2017-2023 question: "What about a smartphone, or a cell phone that connects to the Internet?"; household respondent may report for others) · United States | [26] |
| 2015 (July) | 31.6% | US civilian non-institutional population aged 65+ who use an internet-enabled mobile phone (NTIA variable mobilePhoneUser; 2017-2023 question: "What about a smartphone, or a cell phone that connects to the Internet?"; household respondent may report for others) · United States | [26] |
| 2017 (November) | 49.0% | US civilian non-institutional population aged 65+ who use an internet-enabled mobile phone (NTIA variable mobilePhoneUser; 2017-2023 question: "What about a smartphone, or a cell phone that connects to the Internet?"; household respondent may report for others) · United States | [26] |
| 2019 (November) | 57.6% | US civilian non-institutional population aged 65+ who use an internet-enabled mobile phone (NTIA variable mobilePhoneUser; 2017-2023 question: "What about a smartphone, or a cell phone that connects to the Internet?"; household respondent may report for others) · United States | [26] |
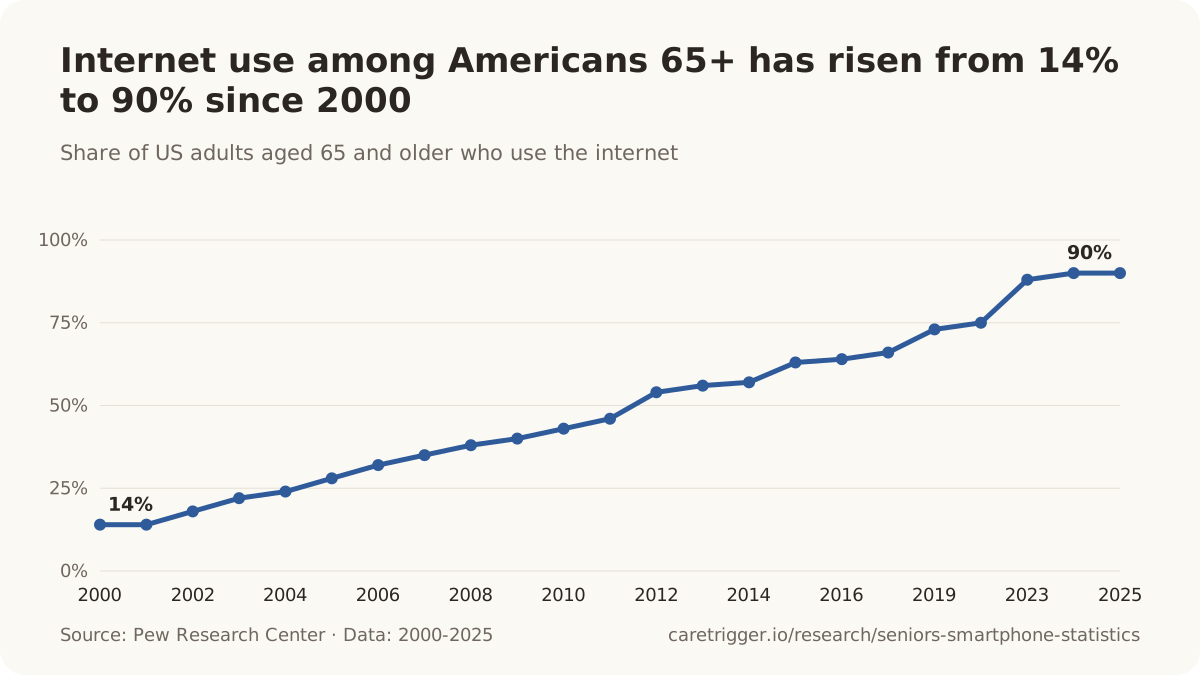
- 90% of US adults aged 65 and older said they use the internet in 2025, up from 14% in 2000; 96% of all US adults do (Pew Research Center, 2025).[38]
- 76.8% of people aged 65 and older in the US used the internet in November 2023, up from 7.2% in December 1998, against 83.3% of everyone aged 3 and older (NTIA, 2024).[26]
- 88.2% of people aged 65 and older in US households had a broadband internet subscription in 2024, up from 67.0% in 2015, against 94.6% of the whole household population (US Census Bureau, American Community Survey, 2025).[39]
The next seniors are already connected
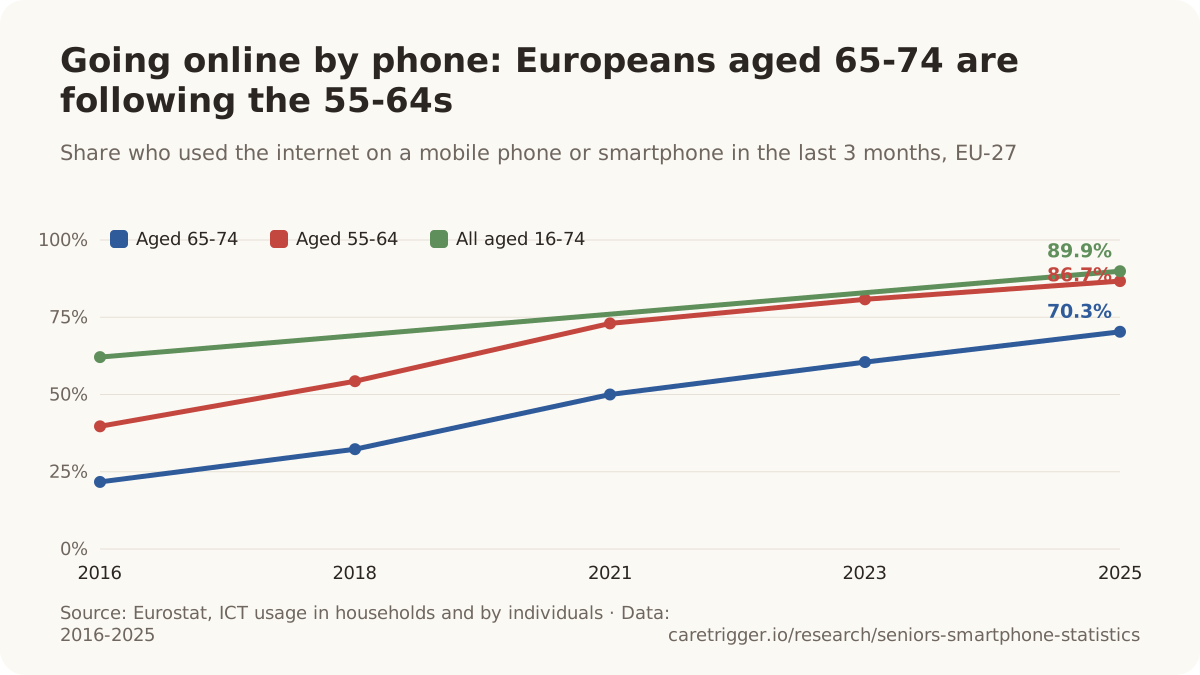
In every country that publishes comparable age bands, the group ten years younger is further along, and the older group follows on much the same path a few years later.
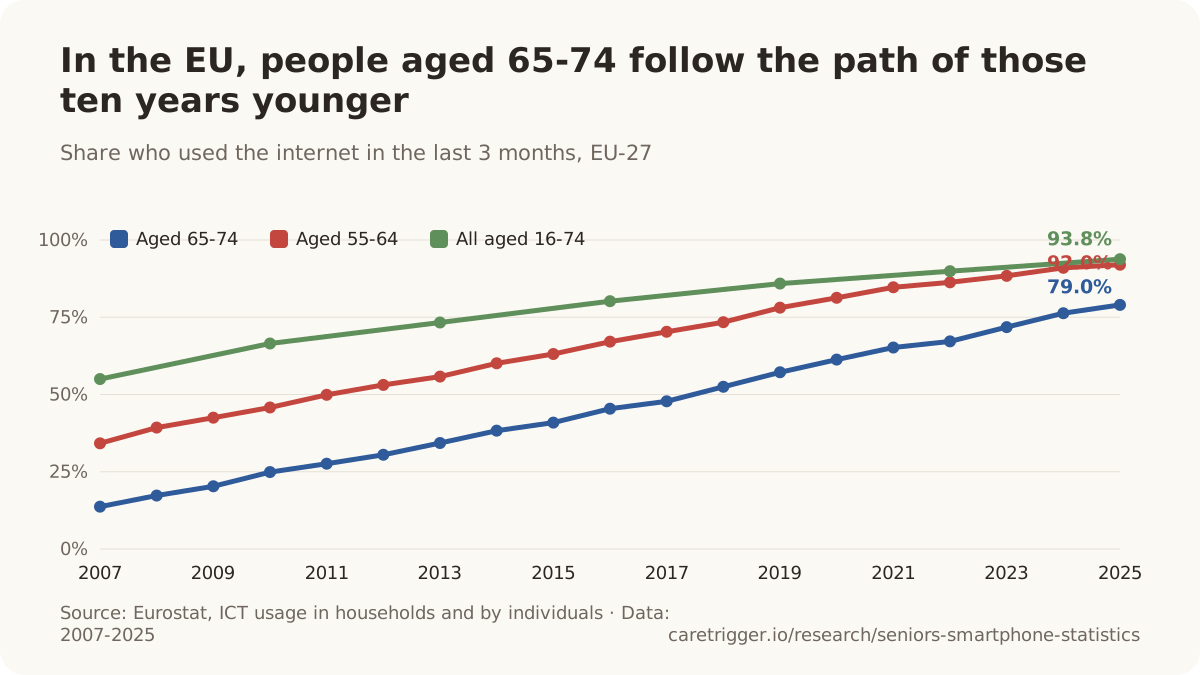
- 79.0% of people aged 65-74 in the EU-27 had used the internet in the 3 months before the survey in 2025, up from 13.7% in 2007 (Eurostat ICT survey, 2026).[32]
- 92.0% of people aged 55-64 in the EU-27 had used the internet in the 3 months before the survey in 2025, against 79.0% of those aged 65-74 and 93.8% of all people aged 16-74 (Eurostat ICT survey).[32]
- 86.7% of people aged 55-64 in the EU-27 used the internet on a mobile phone or smartphone in the last 3 months in 2025, against 70.3% of those aged 65-74 and 89.9% of all people aged 16-74 (Eurostat ICT survey).[2]
- 93.8% of all people aged 16-74 in the EU-27 had used the internet in the last 3 months in 2025, up from 55.0% in 2007 (Eurostat ICT survey, 2026).[32]
- 89.9% of people aged 16-74 (all individuals) in the EU-27 used the internet on a mobile phone or smartphone in the last 3 months in 2025, up from 62.1% in 2016 (Eurostat ICT survey, 2026).[2]
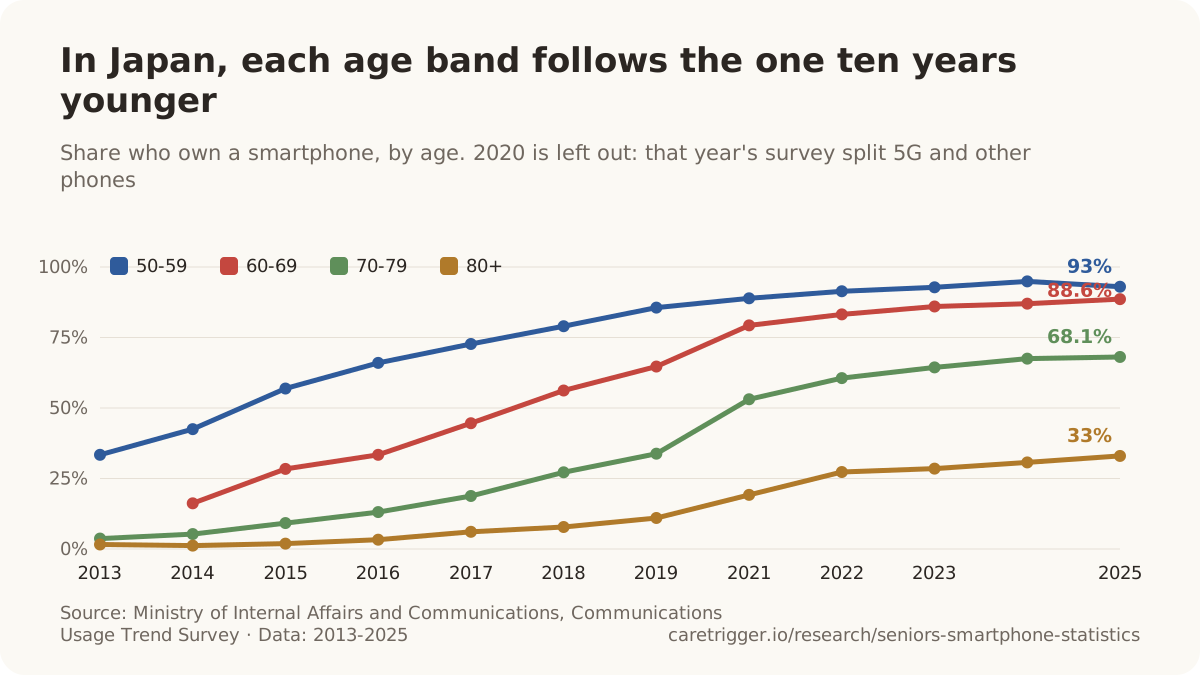
| Period | Share of 65+ | Scope | Source |
|---|---|---|---|
| 2013 (survey at end of 2013) | 4.2% | Persons aged 65+ in private households in Japan who own a smartphone (household-member survey, mail and online; share of all persons in the age group, non-response kept in the base) · Japan | [40] |
| 2014 (survey at end of 2014) | 5.8% | Persons aged 65+ in private households in Japan who own a smartphone (household-member survey, mail and online; share of all persons in the age group, non-response kept in the base) · Japan | [41] |
| 2015 (survey at end of 2015) | 10.2% | Persons aged 65+ in private households in Japan who own a smartphone (household-member survey, mail and online; share of all persons in the age group, non-response kept in the base) · Japan | [42] |
| 2016 (survey at end of September 2016) | 14.1% | Persons aged 65+ in private households in Japan who own a smartphone (household-member survey, mail and online; share of all persons in the age group, non-response kept in the base) · Japan | [43] |
| 2017 (survey at end of September 2017) | 20.4% | Persons aged 65+ in private households in Japan who own a smartphone (household-member survey, mail and online; share of all persons in the age group, non-response kept in the base) · Japan | [44] |
| 2018 (survey at end of September 2018) | 26.8% | Persons aged 65+ in private households in Japan who own a smartphone (household-member survey, mail and online; share of all persons in the age group, non-response kept in the base) · Japan | [45] |
| 2019 (survey at end of September 2019) | 32.1% | Persons aged 65+ in private households in Japan who own a smartphone (household-member survey, mail and online; share of all persons in the age group, non-response kept in the base) · Japan | [46] |
| 2021 (survey at end of August 2021) | 46.4% | Persons aged 65+ in private households in Japan who own a smartphone (household-member survey, mail and online; share of all persons in the age group, non-response kept in the base) · Japan | [47] |
| 2022 (survey at end of August 2022) | 53.7% | Persons aged 65+ in private households in Japan who own a smartphone (household-member survey, mail and online; share of all persons in the age group, non-response kept in the base) · Japan | [48] |
| 2023 (survey at end of August 2023) | 56.2% | Persons aged 65+ in private households in Japan who own a smartphone (household-member survey, mail and online; share of all persons in the age group, non-response kept in the base) · Japan | [49] |
| 2024 (survey at end of August 2024) | 58.2% | Persons aged 65+ in private households in Japan who own a smartphone (household-member survey, mail and online; share of all persons in the age group, non-response kept in the base) · Japan | [50] |
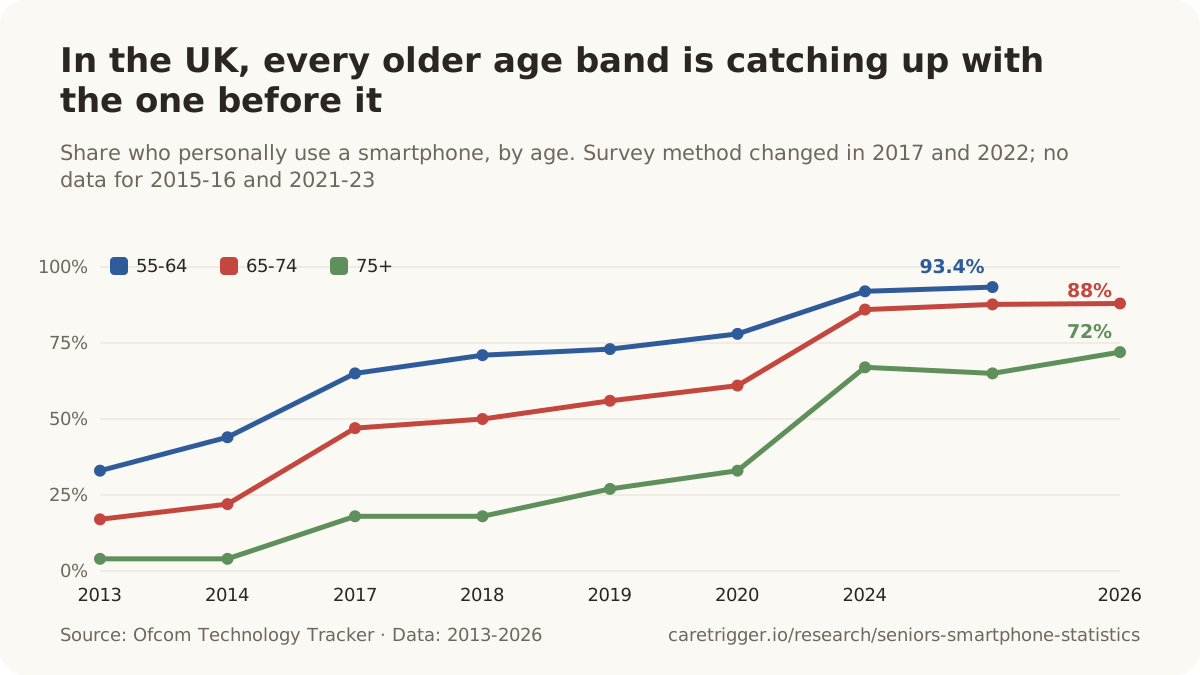
- 93.4% of UK adults aged 55-64 personally used a smartphone in 2025, against 92% of all adults (derived from Ofcom Technology Tracker 2025 tables).[51]
- 88% of UK adults aged 65-74 personally used a smartphone in 2026, against 95% of all adults (Ofcom Technology Tracker, 2026).[11]
- 53% of adults aged 65 and over in Great Britain used a smartphone for private use in 2020, against 84% of all adults (ONS, 2020).[52]
| Period | Share of 65+ | Scope | Source |
|---|---|---|---|
| 2013 (13 May-27 July) | 11% | UK adults aged 65 and over; personally use a smartphone (QD4 (QD24B) 'Do you personally use a smartphone?', base all respondents; face-to-face in-home survey) · United Kingdom | [53] |
| 2014 (12 May-26 July) | 13% | UK adults aged 65 and over; personally use a smartphone (QD4 (QD24B) 'Do you personally use a smartphone?', base all respondents; face-to-face in-home survey) · United Kingdom | [54] |
| 2017 (3 January-28 February) | 33% | UK adults aged 65 and over; personally use a smartphone (QD4 (QD24B) 'Do you personally use a smartphone?', base all respondents; face-to-face in-home survey) · United Kingdom | [55] |
| 2018 (3 January-28 February) | 35% | UK adults aged 65 and over; personally use a smartphone (QD4 (QD24B) 'Do you personally use a smartphone?', base all respondents; face-to-face in-home survey) · United Kingdom | [56] |
| 2019 (3 January-28 February) | 42% | UK adults aged 65 and over; personally use a smartphone (QD4 (QD24B) 'Do you personally use a smartphone?', base all respondents; face-to-face in-home survey) · United Kingdom | [57] |
| 2020 (9 January-7 March) | 48% | UK adults aged 65 and over; personally use a smartphone (QD5 (QD24B) 'Do you personally use a smartphone?', base all respondents; face-to-face in-home survey) · United Kingdom | [58] |
| 2024 (8 January-30 April) | 78% | UK adults aged 65 and over; personally use a smartphone (QM2 'Are any of the mobile phones in your household a smartphone?', answer 'Yes, and I personally use one', re-based on all respondents; mainly face-to-face, 20% online) · United Kingdom | [59] |
| 2025 | 78% | UK adults aged 65+; personally use a smartphone (all respondents base) · United Kingdom | [51] |
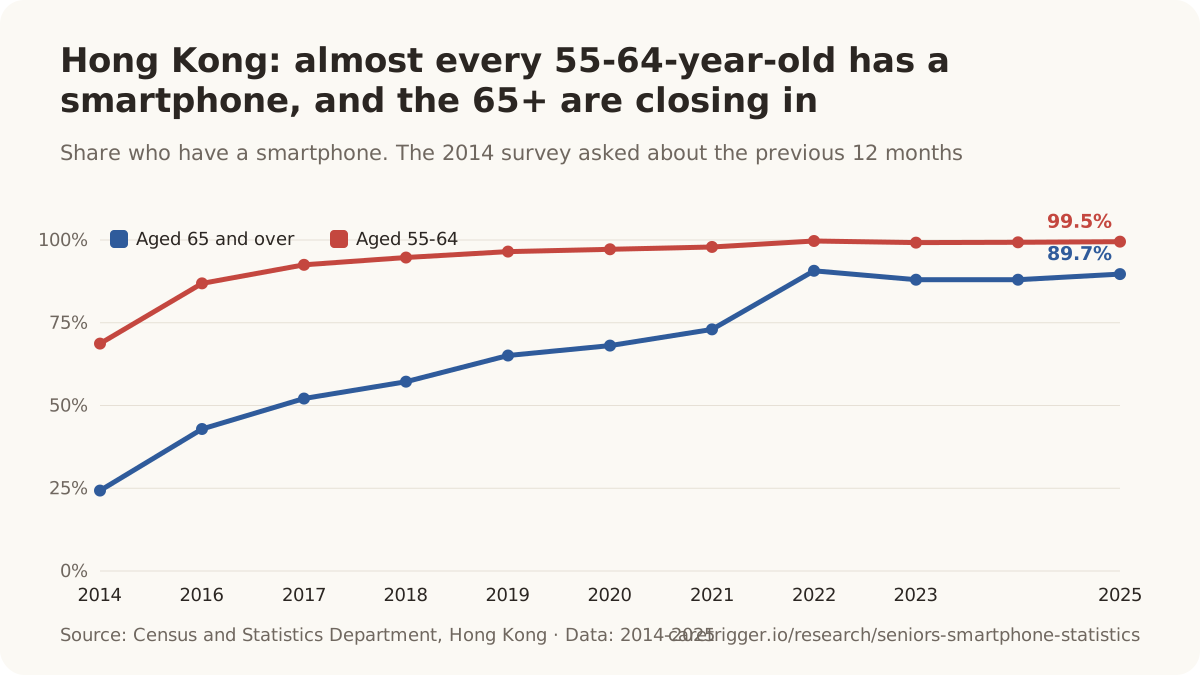
- 99.5% of people aged 55-64 in Hong Kong had a smartphone in 2025, against 89.7% of those aged 65 and over and 96.8% of all persons aged 10 and over (Census and Statistics Department, 2026).[14]
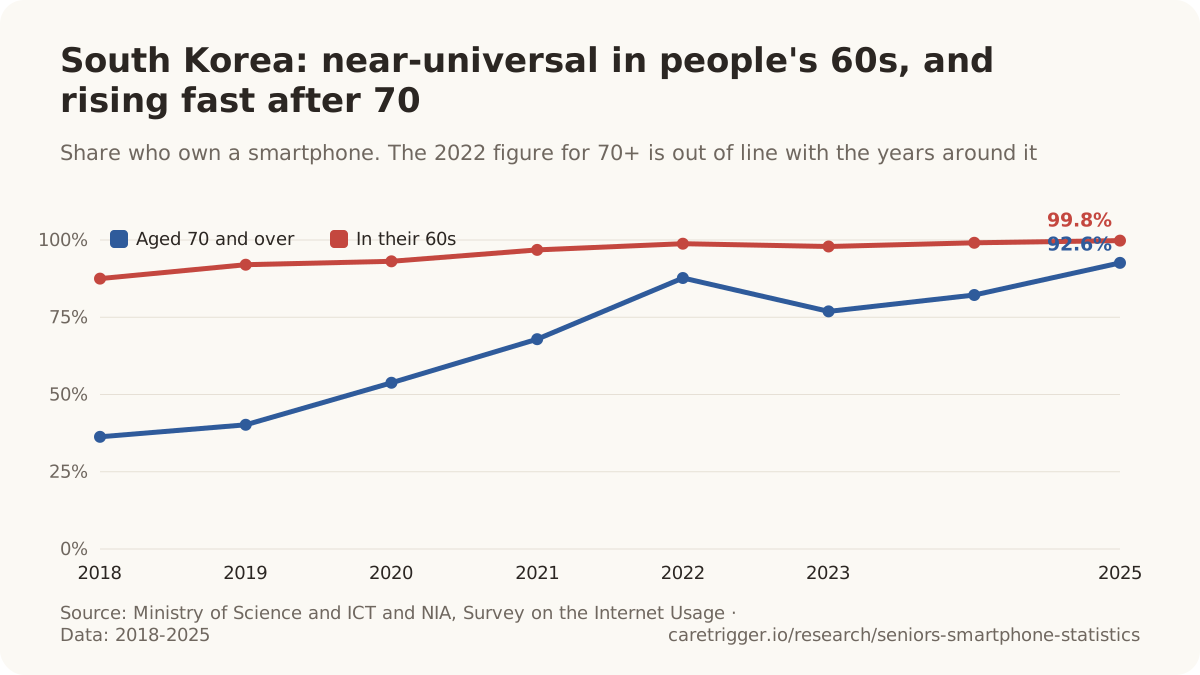
- 99.8% of people in their 60s in South Korea owned a smartphone in July 2025, against 92.6% of those aged 70 and over (50s: 100.0%; all aged 6+: 98.8%) (Ministry of Science and ICT and NIA, 2026).[60]
- 92.6% of people aged 70 and over in South Korea owned a smartphone in July 2025, up from 67.9% in 2021 (Ministry of Science and ICT and NIA, 2026).[60]
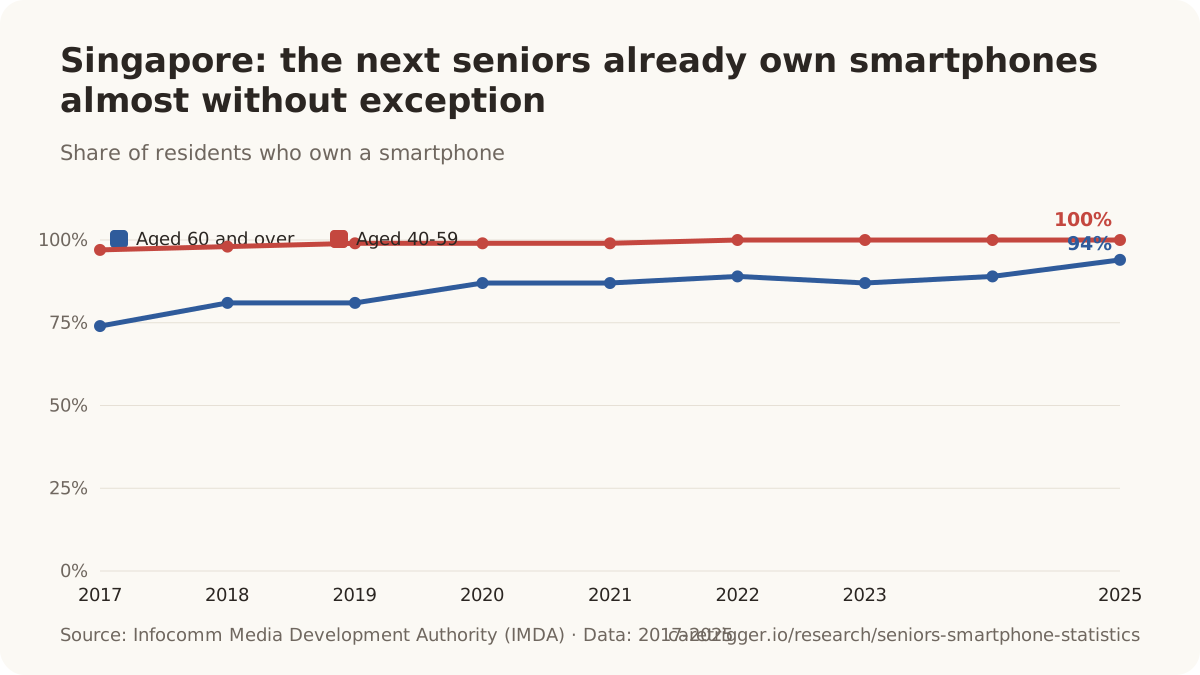
- 100% of Singapore residents aged 40-59 owned a smartphone in 2025, against 94% of residents aged 60 and over and 98% of all residents aged 18 and over (IMDA, 2026).[15]
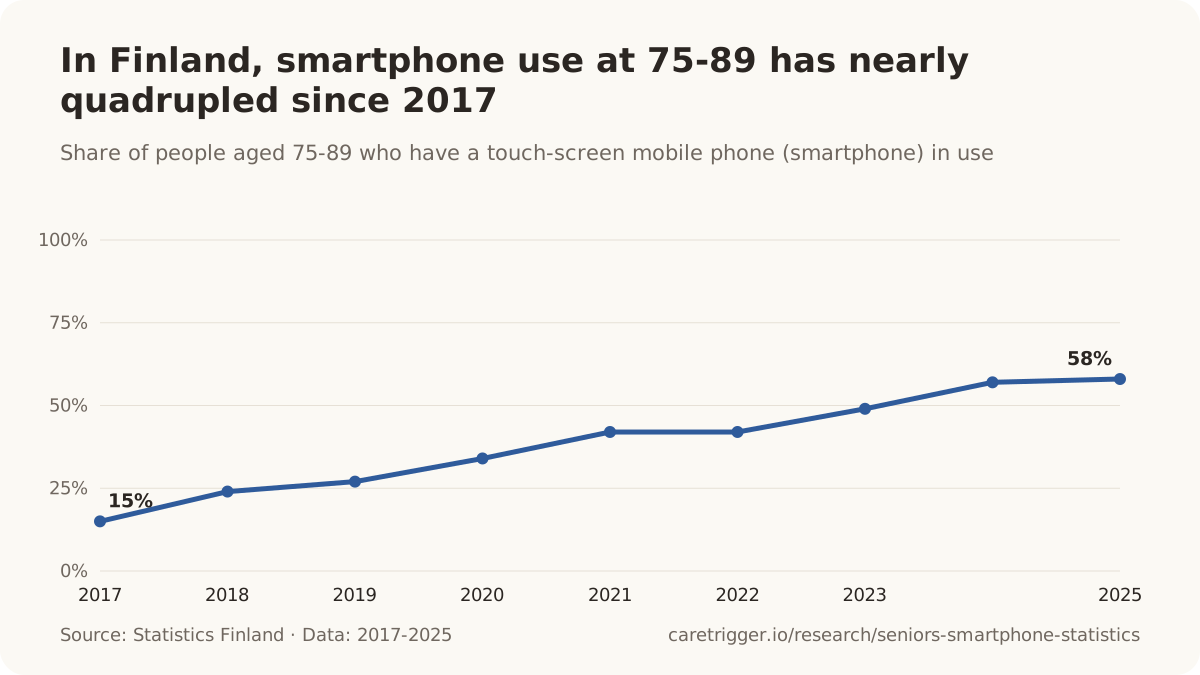
- 91% of all people aged 16-89 in Finland had a touch-screen mobile phone (smartphone) in use in 2025 (Statistics Finland).[16]
Two engines of growth
Split the ten-year rise of an older age group into the head start of the generation moving into it and the adoption that happened afterwards, and both turn out to matter. For smartphones, adoption after 60 did most of the work; for going online at all, the generation arriving from the age group below did.
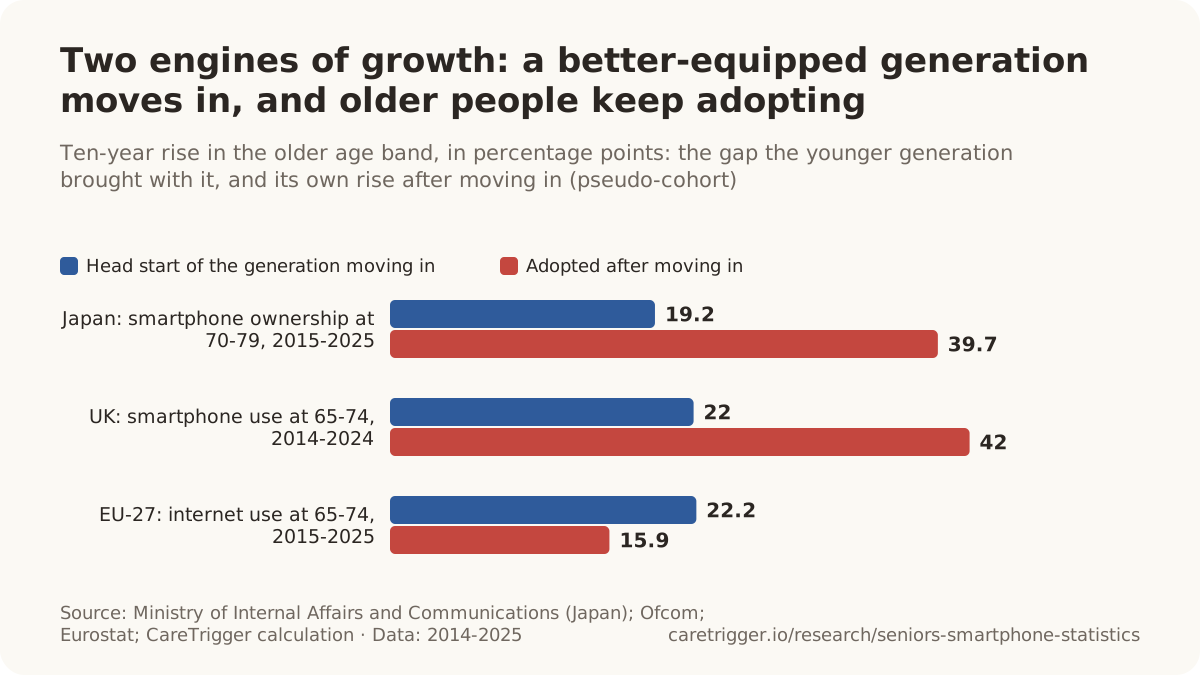
- 42 percentage points: personal smartphone use among UK adults born around 1949-1959 rose from 44% at ages 55-64 in May-July 2014 to 86% at ages 65-74 in January-April 2024 (derived from Ofcom Technology Tracker tables, 2014 and 2024).[59]
- 15.9 percentage points was the rise in internet use (last 3 months) in the EU-27 generation aged 55-64 in 2015 by the time it was aged 65-74 in 2025, from 63.1% to 79.0% (pseudo-cohort; Eurostat ICT survey).[32]
- 22 percentage points separated personal smartphone use among UK adults aged 55-64 (44%) and those aged 65-74 (22%) in May-July 2014 (derived from Ofcom Technology Tracker, 2014).[54]
- 22.2 percentage points separated internet use (last 3 months) among people aged 55-64 (63.1%) and those aged 65-74 (40.9%) in the EU-27 in 2015, the head start of the generation that turned 65-74 by 2025 (Eurostat ICT survey).[32]
How to read a pseudo-cohort. These comparisons follow the same birth years through two different survey samples ten years apart. They are not the same people interviewed twice, and deaths and migration change the group in between, so they show the direction and rough size of each effect, not an exact split.
Year on year
Over a single year the change is small, sometimes within a survey's margin of error, which is why the long series matter more than any one jump. The oldest groups still rise fastest, because they have the most room to grow.
- 57.3% of Medicare beneficiaries aged 85 and older living in the community owned a smartphone in 2024, against 90.8% of those aged 65 to 74 (CMS Medicare Current Beneficiary Survey, 2025).[61]
- 81.5% of Medicare beneficiaries aged 75 to 84 living in the community owned a smartphone in 2024 (CMS Medicare Current Beneficiary Survey, 2025).[61]
- 90.8% of Medicare beneficiaries aged 65 to 74 living in the community owned a smartphone in 2024 (CMS Medicare Current Beneficiary Survey, 2025).[61]
- 76.6% of Medicare beneficiaries aged 85 and older living in the community had access to the internet in 2024 (CMS Medicare Current Beneficiary Survey, 2025).[61]
- 72.9% of Medicare beneficiaries aged 85 and older living in the community had access to the internet in 2023 (CMS Medicare Current Beneficiary Survey, 2025).[62]
- 12 percentage points was the one-year rise in smartphone ownership among US adults aged 65 and older between 2015 and November 2016, taking it to 42%, while ownership among those aged 50-64 rose 16 points to 74% (Pew Research Center, 2017).[63]
- 16 percentage points was the one-year rise in smartphone ownership among US adults aged 50 to 64 between 2015 and November 2016, taking it to 74% (Pew Research Center, 2017).[63]
- 2 percentage points was the change in smartphone ownership among US adults aged 65 and older between May 2011 (11%) and February 2012 (13%), a change Pew did not find statistically significant, while ownership among those aged 55-64 rose 9 points (Pew Research Center, 2012).[64]
More seniors to connect
The age group is growing too, so the number of older people with a smartphone is rising faster than the share alone suggests.
- 1 in 5 US residents (20%) will be of retirement age by 2030, the year by which all baby boomers will be older than 65 (US Census Bureau, 2017 National Population Projections, 2018).[65]
- 2.2 billion people worldwide are projected to be aged 65 or older by the late 2070s, outnumbering children under 18 (United Nations, World Population Prospects 2024).[68]
03 / By age
How does smartphone ownership change with age?
61.8% of Medicare beneficiaries aged 85 and older living in the community owned a smartphone in 2025, against 91.3% of those aged 65 to 74 (CMS Medicare Current Beneficiary Survey, 2026).[69]
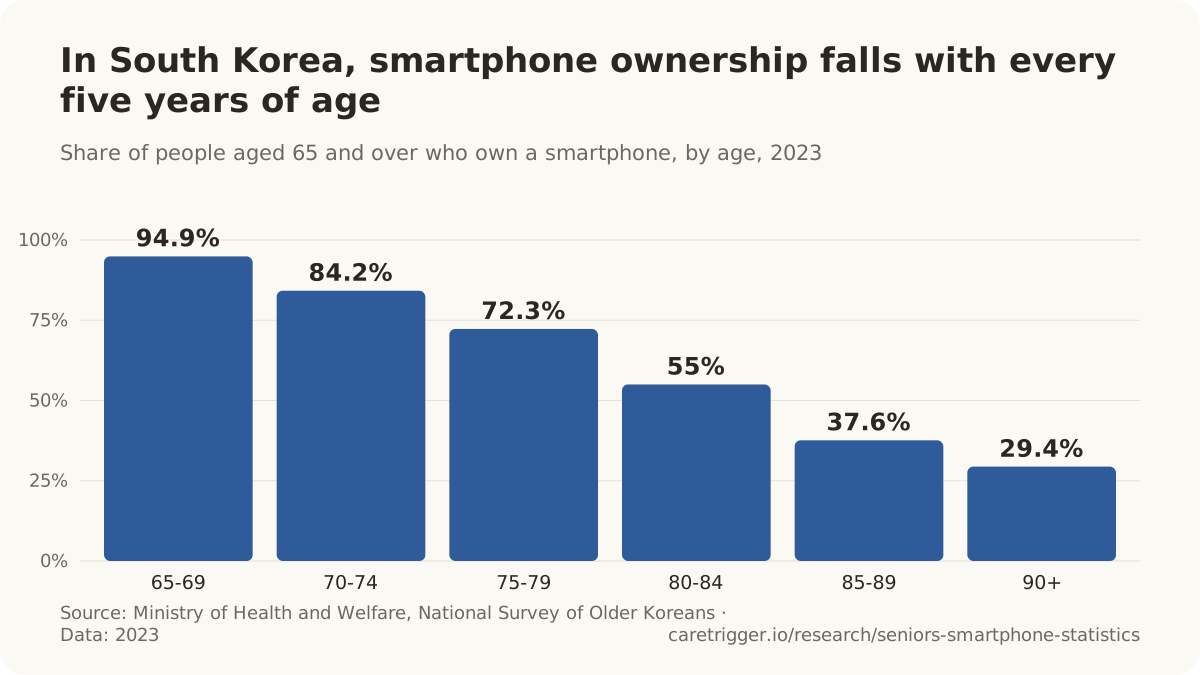
Ownership falls with every five years of age, slowly at first and steeply after 80. The oldest groups are where the growth now is, and where most of the people still without a smartphone are.
- 91.3% of Medicare beneficiaries aged 65 to 74 living in the community owned a smartphone in 2025 (CMS Medicare Current Beneficiary Survey, 2026).[69]
- 84.2% of Medicare beneficiaries aged 75 to 84 living in the community owned a smartphone in 2025 (CMS Medicare Current Beneficiary Survey, 2026).[69]
- 75.4% of Medicare beneficiaries aged 85 and older living in the community owned a computer, smartphone or tablet in 2025, against 95% of those aged 65 to 74 (CMS Medicare Current Beneficiary Survey, 2026).[69]
- 77.6% of Medicare beneficiaries aged 85 and older living in the community had access to the internet in 2025, against 94.6% of those aged 65 to 74 and 90.8% of those aged 75 to 84 (CMS Medicare Current Beneficiary Survey, 2026).[69]
- 43% of US adults aged 75 and older owned a smartphone in early 2021, against 71% of those aged 65 to 74 (Pew Research Center, 2021).[71]
- 40% of US adults aged 75 and older owned a smartphone in early 2019, against 59% of those aged 65 to 74 (Pew Research Center, 2019).[72]
- 83.1% of people aged 65-69 in Taiwan had used the internet in 2025 (60-64: 89.4%; all aged 12+: 90.3%) (Ministry of Digital Affairs, 2026).[73]
- 67.2% of people aged 70-74 in Taiwan had used the internet in 2025 (60-64: 89.4%; all aged 12+: 90.3%) (Ministry of Digital Affairs, 2026).[73]
- 50.3% of people aged 75-89 in the EU-27 had used the internet in the last 3 months in 2025, the only year with an EU figure for this age band in Eurostat's internet-use table (Eurostat ICT survey, 2026).[32]
- 53.0% of people aged 75-84 in Spain had used the internet in the last 3 months in 2025 (INE, 2025).[74]
- 87% of people aged 75-84 in Sweden had used the internet in the last 3 months in 2026 (Statistics Sweden).[75]
- 74% of people aged 75-84 in Sweden accessed the internet with a mobile phone or smartphone in 2025 (Statistics Sweden, 2025).[17]
- 36% of people aged 85 and over in Sweden accessed the internet with a mobile phone or smartphone in 2025 (Statistics Sweden, 2025).[17]
- 86% of people aged 80-84 in Denmark had used the internet in the last year in 2025, against 98% of all 15-89-year-olds (Aeldre Sagen analysis of Statistics Denmark data, 2026).[76]
- 85% of people aged 75-89 in Denmark were internet users (online in the last 3 months) in 2024, against 98% of all 15-89-year-olds (Statistics Denmark, 2024).[77]
- 40.8% of Canadians aged 80 and older were internet users in 2016, against 62.2% at 75 to 79, 75.3% at 70 to 74 and 84.9% at 65 to 69 (General Social Survey; Statistics Canada, 2019).[78]
- 59.2% of Canadians aged 80 and older had not used the internet in the past month in 2016, compared with 15.0% of those aged 65 to 69, 31.8% of all seniors and 2.8% of Canadians under 65 (General Social Survey; Statistics Canada, 2019).[78]
- 42% of Chileans aged 60 and older had used the internet in the past month in 2022: 58% of those aged 60 to 69, 30% of those aged 70 to 79 and 13% of those aged 80 and older (Encuesta Calidad de Vida en la Vejez 2022; Observatorio del Envejecimiento UC-Confuturo, 2024).[22]
- 45.8% of Kenyans aged 75 and older (317,843 of 694,217) owned a mobile phone at the 2019 census, compared with 68.5% of those aged 65 to 74 and 83.9% of those aged 25 to 34 (KNBS, 2019 Kenya Population and Housing Census).[79]
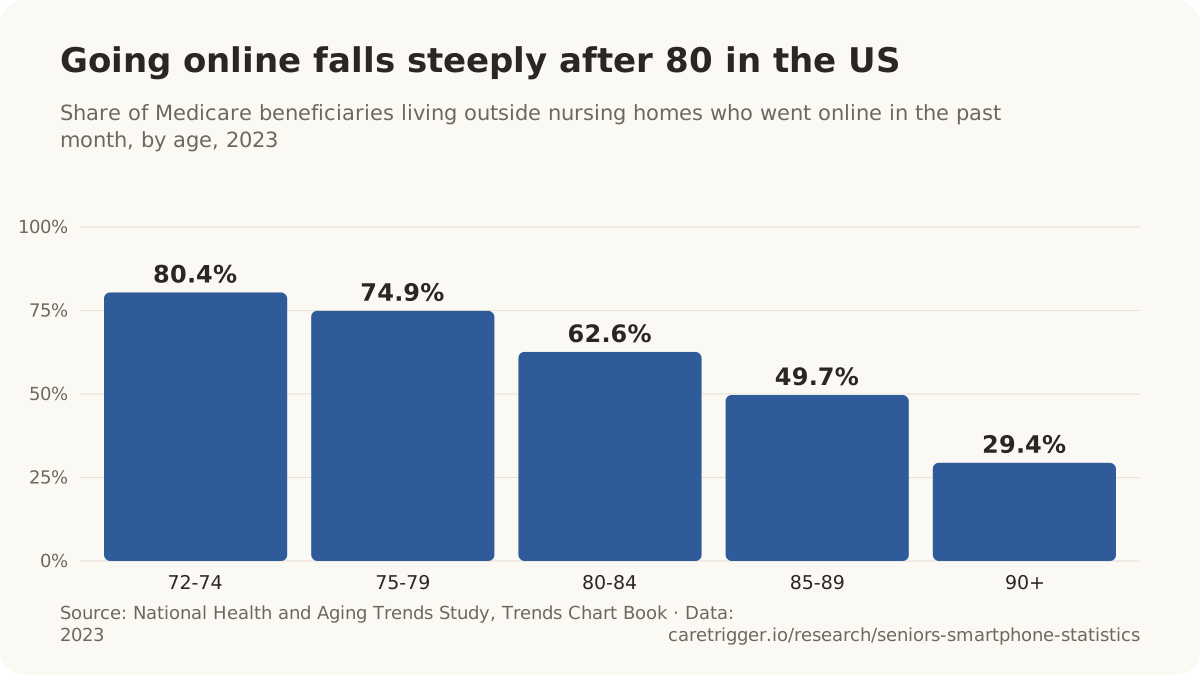
| Country, measure and age (year) | Share | Scope | Source |
|---|---|---|---|
| Japan: own a smartphone, 80+ (2025) | 33.0% | Persons aged 80+ in private households in Japan who own a smartphone (share of all persons aged 80+, non-response kept in the base) · Japan · 2025 (survey at end of August 2025) | [3] |
| South Korea: own a smartphone, 90+ (2023) | 29.4% | People aged 90+ in South Korea, own a smartphone · South Korea · 2023 | [80] |
| United States: went online in the past month, 90+ (2023) | 29.4% | Medicare beneficiaries aged 90 and older, not in nursing homes, who went online in the last month (other than email/texting) · United States · 2023 | [81] |
| Spain: used the internet in the last 3 months, 85+ (2025) | 25.0% | People aged 85 and over in Spain (estimated 1,401,662 people); used the internet in the last 3 months · Spain · 2025 | [74] |
| Sweden: used the internet in the last 3 months, 85+ (2026) | 68% | People aged 85+ in Sweden; last used the internet within the last three months · Sweden · 2026 | [75] |
| Denmark: used the internet in the past year, 85-89 (2025) | 68% | People aged 85-89 in Denmark; used the internet within the last 12 months (national IT survey, ages 15-89) · Denmark · 2025 (April-July) | [76] |
| Finland: have a smartphone in use, 75-89 (2025) | 58% | People aged 75-89 in Finland; have in use a mobile phone with a touch screen · Finland · 2025 | [16] |
| EU-27: went online on a mobile phone, 75-89 (2025) | 41.3% | Persons aged 75-89; used the internet on a mobile phone or smartphone in the last 3 months, as % of all persons aged 75-89 · European Union (EU-27) · 2025 | [2] |
| Canada: used the internet, 75+ (2022) | 72% | Canadians aged 75+, persons living in the 10 provinces, excluding full-time residents of institutions; personal internet use in the past three months from any location, excluding business and school use · Canada (10 provinces) · 2022 | [82] |
| Taiwan: have used the internet, 75+ (2025) | 41.4% | People aged 75+ in Taiwan who have ever used the internet (個人曾上網) · Taiwan · May-July 2025 | [73] |
| Mexico: used the internet, 75+ (2025) | 30.3% | Persons aged 75+ (vs all aged 6+) in private dwellings who used the internet (ENDUTIH) · Mexico · 2025 | [83] |
| Japan, industry survey: own a smartphone, 80-84 (2026) | 69% | People aged 80-84 in Japan (60-84 survey), own a smartphone · Japan · January 2026 | [27] |
How the ladder looked a decade ago
These older surveys are the source of figures still quoted as current; they are shown here with their years.
- 59% of US adults aged 65 to 69 owned a smartphone in late 2016, against 42% of all adults 65 and older (Pew Research Center, 2017).[84]
- 49% of US adults aged 70 to 74 owned a smartphone in late 2016, against 42% of all adults 65 and older (Pew Research Center, 2017).[84]
- 31% of US adults aged 75 to 79 owned a smartphone in late 2016, against 42% of all adults 65 and older (Pew Research Center, 2017).[84]
- 17% of US adults aged 80 and older owned a smartphone in late 2016, against 42% of all adults 65 and older (Pew Research Center, 2017).[84]
- 58% of US adults aged 80 and older owned a cellphone of any kind in 2016, against 95% at 65 to 69, 93% at 70 to 74 and 63% at 75 to 79 (Pew Research Center, 2017).[85]
- 44% of US adults aged 80 and older said they go online in 2016, against 82% at 65 to 69, 75% at 70 to 74 and 60% at 75 to 79 (Pew Research Center, 2017).[85]
- 28% of US adults aged 80 and older had home broadband in 2016, against 66% at 65 to 69, 61% at 70 to 74 and 41% at 75 to 79 (Pew Research Center, 2017).[85]
- 5% of US adults aged 80 and older owned a smartphone in 2013, against 29% of those aged 65 to 69, 21% at 70 to 74 and 10% at 75 to 79 (Pew Research Center, 2014).[86]
- 29% of US adults aged 70 and older owned a smartphone in July 2016, against 73% of those aged 50 to 59 and 54% of those aged 60 to 69 (AARP Research, 2016).[87]
- 55% of US adults aged 70 and older owned a smartphone in November 2017, against 78% of those aged 50 to 59 and 73% of those aged 60 to 69 (AARP Research, 2017).[88]
- 62% of US adults aged 70 and older had a smartphone in mid-2019, against 86% of those aged 50 to 59 and 81% of those aged 60 to 69 (AARP Research, 2020).[34]
04 / By country
Which countries' older people are most connected?
99.9% of people aged 65-74 in Denmark had used the internet in the last 3 months in 2025, against an EU-27 average of 79.0% (Eurostat ICT survey, 2026).[32]
Northern Europe leads by a wide margin; southern and eastern Europe, Türkiye and much of Latin America trail, and the gap is widest among the oldest. The tables name the measure, because Eurostat counts going online, not owning a phone.
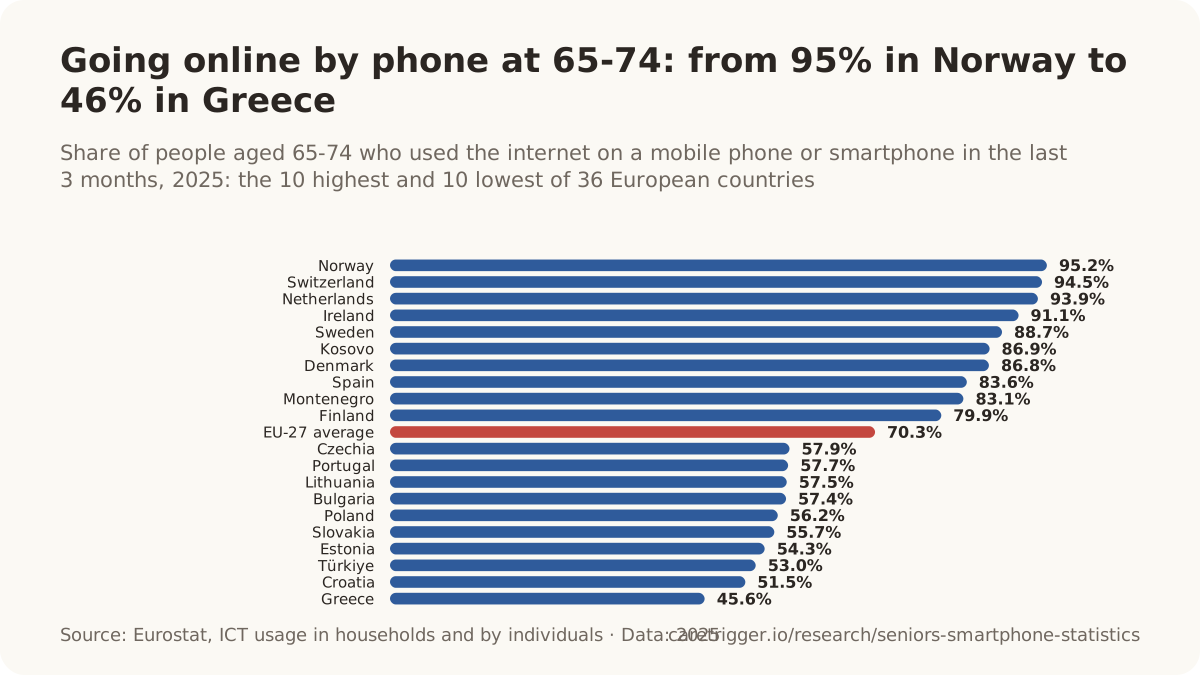
| Country | Share of 65-74 | Scope | Source |
|---|---|---|---|
| Norway | 95.2% | Individuals aged 65-74; used the internet on a mobile phone or smartphone in the last 3 months, as % of all individuals aged 65-74 · 2025 | [2] |
| Switzerland | 94.5% | Individuals aged 65-74; used the internet on a mobile phone or smartphone in the last 3 months, as % of all individuals aged 65-74 · 2025 | [2] |
| Netherlands | 93.9% | Individuals aged 65-74; used the internet on a mobile phone or smartphone in the last 3 months, as % of all individuals aged 65-74 · 2025 | [2] |
| Ireland | 91.1% | Individuals aged 65-74; used the internet on a mobile phone or smartphone in the last 3 months, as % of all individuals aged 65-74 · 2025 | [2] |
| Sweden | 88.7% | Individuals aged 65-74; used the internet on a mobile phone or smartphone in the last 3 months, as % of all individuals aged 65-74 · 2025 | [2] |
| Kosovo | 86.9% | Individuals aged 65-74; used the internet on a mobile phone or smartphone in the last 3 months, as % of all individuals aged 65-74 · 2025 | [2] |
| Denmark | 86.8% | Individuals aged 65-74; used the internet on a mobile phone or smartphone in the last 3 months, as % of all individuals aged 65-74 · 2025 | [2] |
| Spain | 83.6% | Individuals aged 65-74; used the internet on a mobile phone or smartphone in the last 3 months, as % of all individuals aged 65-74 · 2025 | [2] |
| Montenegro | 83.1% | Individuals aged 65-74; used the internet on a mobile phone or smartphone in the last 3 months, as % of all individuals aged 65-74 · 2025 | [2] |
| Finland | 79.9% | Individuals aged 65-74; used the internet on a mobile phone or smartphone in the last 3 months, as % of all individuals aged 65-74 · 2025 | [2] |
| Luxembourg | 77.2% | Individuals aged 65-74; used the internet on a mobile phone or smartphone in the last 3 months, as % of all individuals aged 65-74 · 2025 | [2] |
| Romania | 76.6% | Individuals aged 65-74; used the internet on a mobile phone or smartphone in the last 3 months, as % of all individuals aged 65-74 · 2025 | [2] |
| Belgium | 72.9% | Individuals aged 65-74; used the internet on a mobile phone or smartphone in the last 3 months, as % of all individuals aged 65-74 · 2025 | [2] |
| Malta | 72.5% | Individuals aged 65-74; used the internet on a mobile phone or smartphone in the last 3 months, as % of all individuals aged 65-74 · 2025 | [2] |
| Austria | 72.2% | Individuals aged 65-74; used the internet on a mobile phone or smartphone in the last 3 months, as % of all individuals aged 65-74 · 2025 | [2] |
| Germany | 71.3% | Individuals aged 65-74; used the internet on a mobile phone or smartphone in the last 3 months, as % of all individuals aged 65-74 · 2025 | [2] |
| France | 69.9% | Individuals aged 65-74; used the internet on a mobile phone or smartphone in the last 3 months, as % of all individuals aged 65-74 · 2025 | [2] |
| Cyprus | 69.5% | Individuals aged 65-74; used the internet on a mobile phone or smartphone in the last 3 months, as % of all individuals aged 65-74 · 2025 | [2] |
| Latvia | 68.6% | Individuals aged 65-74; used the internet on a mobile phone or smartphone in the last 3 months, as % of all individuals aged 65-74 · 2025 | [2] |
| Italy | 67.6% | Individuals aged 65-74; used the internet on a mobile phone or smartphone in the last 3 months, as % of all individuals aged 65-74 · 2025 | [2] |
| Slovenia | 67.2% | Individuals aged 65-74; used the internet on a mobile phone or smartphone in the last 3 months, as % of all individuals aged 65-74 · 2025 | [2] |
| North Macedonia | 66.8% | Individuals aged 65-74; used the internet on a mobile phone or smartphone in the last 3 months, as % of all individuals aged 65-74 · 2025 | [2] |
| Hungary | 64.7% | Individuals aged 65-74; used the internet on a mobile phone or smartphone in the last 3 months, as % of all individuals aged 65-74 · 2025 | [2] |
| Albania | 64.1% | Individuals aged 65-74; used the internet on a mobile phone or smartphone in the last 3 months, as % of all individuals aged 65-74 · 2025 | [2] |
| Serbia | 61.3% | Individuals aged 65-74; used the internet on a mobile phone or smartphone in the last 3 months, as % of all individuals aged 65-74 · 2025 | [2] |
| Bosnia and Herzegovina | 59.0% | Individuals aged 65-74; used the internet on a mobile phone or smartphone in the last 3 months, as % of all individuals aged 65-74 · 2025 | [2] |
| Czechia | 57.9% | Individuals aged 65-74; used the internet on a mobile phone or smartphone in the last 3 months, as % of all individuals aged 65-74 · 2025 | [2] |
| Portugal | 57.7% | Individuals aged 65-74; used the internet on a mobile phone or smartphone in the last 3 months, as % of all individuals aged 65-74 · 2025 | [2] |
| Lithuania | 57.5% | Individuals aged 65-74; used the internet on a mobile phone or smartphone in the last 3 months, as % of all individuals aged 65-74 · 2025 | [2] |
| Bulgaria | 57.4% | Individuals aged 65-74; used the internet on a mobile phone or smartphone in the last 3 months, as % of all individuals aged 65-74 · 2025 | [2] |
| Poland | 56.2% | Individuals aged 65-74; used the internet on a mobile phone or smartphone in the last 3 months, as % of all individuals aged 65-74 · 2025 | [2] |
| Slovakia | 55.7% | Individuals aged 65-74; used the internet on a mobile phone or smartphone in the last 3 months, as % of all individuals aged 65-74 · 2025 | [2] |
| Estonia | 54.3% | Individuals aged 65-74; used the internet on a mobile phone or smartphone in the last 3 months, as % of all individuals aged 65-74 · 2025 | [2] |
| Türkiye | 53.0% | Individuals aged 65-74; used the internet on a mobile phone or smartphone in the last 3 months, as % of all individuals aged 65-74 · 2025 | [2] |
| Croatia | 51.5% | Individuals aged 65-74; used the internet on a mobile phone or smartphone in the last 3 months, as % of all individuals aged 65-74 · 2025 | [2] |
| Greece | 45.6% | Individuals aged 65-74; used the internet on a mobile phone or smartphone in the last 3 months, as % of all individuals aged 65-74 · 2025 | [2] |
| Country | Share of 65-74 | Scope | Source |
|---|---|---|---|
| Norway | 99.3% | Individuals aged 65-74 in private households; used the internet in the last 3 months · 2025 | [32] |
| Netherlands | 98.6% | Individuals aged 65-74 in private households; used the internet in the last 3 months · 2025 | [32] |
| Ireland | 98.0% | Individuals aged 65-74 in private households; used the internet in the last 3 months · 2025 | [32] |
| Switzerland | 96.3% | Individuals aged 65-74 in private households; used the internet in the last 3 months · 2025 | [32] |
| Sweden | 95.5% | Individuals aged 65-74 in private households; used the internet in the last 3 months · 2025 | [32] |
| Luxembourg | 93.5% | Individuals aged 65-74 in private households; used the internet in the last 3 months · 2025 | [32] |
| Finland | 90.8% | Individuals aged 65-74 in private households; used the internet in the last 3 months · 2025 | [32] |
| Kosovo | 87.8% | Individuals aged 65-74 in private households; used the internet in the last 3 months · 2025 | [32] |
| Belgium | 87.7% | Individuals aged 65-74 in private households; used the internet in the last 3 months · 2025 | [32] |
| Germany | 86.5% | Individuals aged 65-74 in private households; used the internet in the last 3 months · 2025 | [32] |
| Spain | 85.6% | Individuals aged 65-74 in private households; used the internet in the last 3 months · 2025 | [32] |
| Montenegro | 83.8% | Individuals aged 65-74 in private households; used the internet in the last 3 months · 2025 | [32] |
| France | 83.5% | Individuals aged 65-74 in private households; used the internet in the last 3 months · 2025 | [32] |
| Austria | 82.0% | Individuals aged 65-74 in private households; used the internet in the last 3 months · 2025 | [32] |
| Latvia | 80.6% | Individuals aged 65-74 in private households; used the internet in the last 3 months · 2025 | [32] |
| Romania | 78.4% | Individuals aged 65-74 in private households; used the internet in the last 3 months · 2025 | [32] |
| Malta | 77.0% | Individuals aged 65-74 in private households; used the internet in the last 3 months · 2025 | [32] |
| Estonia | 75.9% | Individuals aged 65-74 in private households; used the internet in the last 3 months · 2025 | [32] |
| Czechia | 75.2% | Individuals aged 65-74 in private households; used the internet in the last 3 months · 2025 | [32] |
| Hungary | 75.1% | Individuals aged 65-74 in private households; used the internet in the last 3 months · 2025 | [32] |
| Slovakia | 72.9% | Individuals aged 65-74 in private households; used the internet in the last 3 months · 2025 | [32] |
| Italy | 72.5% | Individuals aged 65-74 in private households; used the internet in the last 3 months · 2025 | [32] |
| Slovenia | 71.5% | Individuals aged 65-74 in private households; used the internet in the last 3 months · 2025 | [32] |
| Cyprus | 71.1% | Individuals aged 65-74 in private households; used the internet in the last 3 months · 2025 | [32] |
| Bosnia and Herzegovina | 71.1% | Individuals aged 65-74 in private households; used the internet in the last 3 months · 2025 | [32] |
| North Macedonia | 68.0% | Individuals aged 65-74 in private households; used the internet in the last 3 months · 2025 | [32] |
| Serbia | 65.5% | Individuals aged 65-74 in private households; used the internet in the last 3 months · 2025 | [32] |
| Lithuania | 65.2% | Individuals aged 65-74 in private households; used the internet in the last 3 months · 2025 | [32] |
| Albania | 64.4% | Individuals aged 65-74 in private households; used the internet in the last 3 months · 2025 | [32] |
| Portugal | 60.7% | Individuals aged 65-74 in private households; used the internet in the last 3 months · 2025 | [32] |
| Bulgaria | 60.6% | Individuals aged 65-74 in private households; used the internet in the last 3 months · 2025 | [32] |
| Poland | 60.6% | Individuals aged 65-74 in private households; used the internet in the last 3 months · 2025 | [32] |
| Croatia | 54.3% | Individuals aged 65-74 in private households; used the internet in the last 3 months · 2025 | [32] |
| Türkiye | 53.2% | Individuals aged 65-74 in private households; used the internet in the last 3 months · 2025 | [32] |
| Greece | 51.9% | Individuals aged 65-74 in private households; used the internet in the last 3 months · 2025 | [32] |
At 75 and over
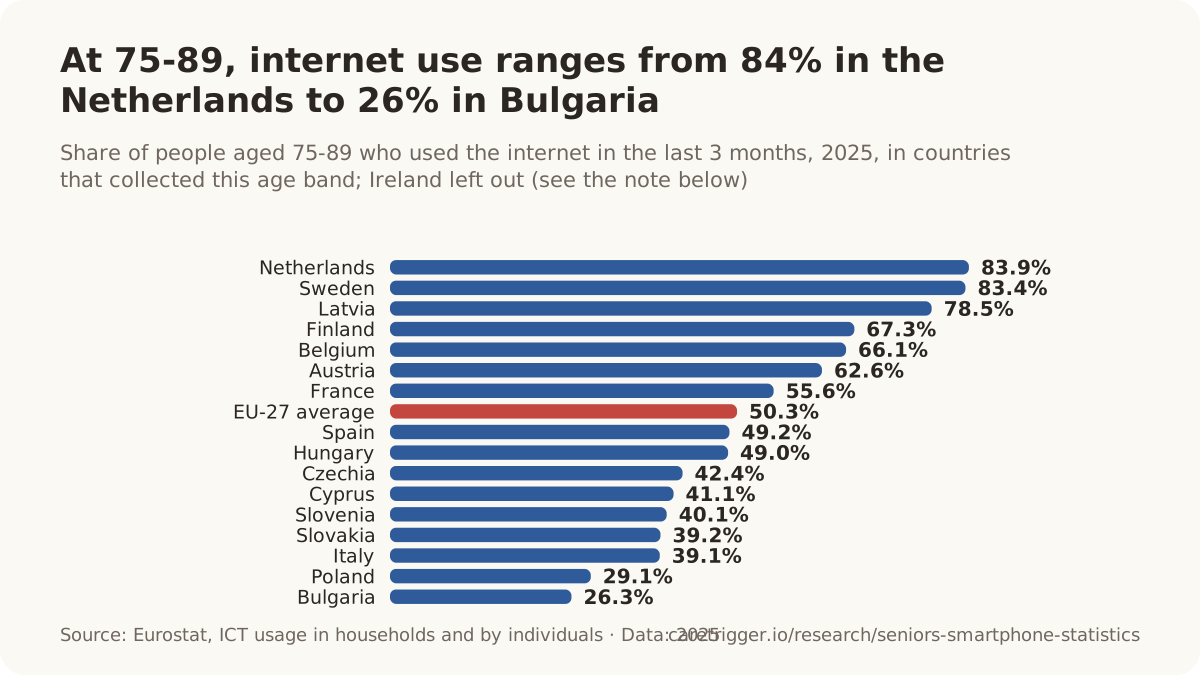
| Country | Share of 75-89 | Scope | Source |
|---|---|---|---|
| Netherlands | 83.9% | Persons aged 75-89; used the internet in the last 3 months (optional 2025 module) · 2025 | [32] |
| Sweden | 83.4% | Persons aged 75-89; used the internet in the last 3 months (optional 2025 module) · 2025 | [32] |
| Latvia | 78.5% | Persons aged 75-89; used the internet in the last 3 months (optional 2025 module) · 2025 | [32] |
| Finland | 67.3% | Persons aged 75-89; used the internet in the last 3 months (optional 2025 module) · 2025 | [32] |
| Belgium | 66.1% | Persons aged 75-89; used the internet in the last 3 months (optional 2025 module) · 2025 | [32] |
| Austria | 62.6% | Persons aged 75-89; used the internet in the last 3 months (optional 2025 module) · 2025 | [32] |
| France | 55.6% | Persons aged 75-89; used the internet in the last 3 months (optional 2025 module) · 2025 | [32] |
| Spain | 49.2% | Persons aged 75-89; used the internet in the last 3 months (optional 2025 module) · 2025 | [32] |
| Hungary | 49.0% | Persons aged 75-89; used the internet in the last 3 months (optional 2025 module) · 2025 | [32] |
| Czechia | 42.4% | Persons aged 75-89; used the internet in the last 3 months (optional 2025 module) · 2025 | [32] |
| Cyprus | 41.1% | Persons aged 75-89; used the internet in the last 3 months (optional 2025 module) · 2025 | [32] |
| Slovenia | 40.1% | Persons aged 75-89; used the internet in the last 3 months (optional 2025 module) · 2025 | [32] |
| Slovakia | 39.2% | Persons aged 75-89; used the internet in the last 3 months (optional 2025 module) · 2025 | [32] |
| Italy | 39.1% | Persons aged 75-89; used the internet in the last 3 months (optional 2025 module) · 2025 | [32] |
| Poland | 29.1% | Persons aged 75-89; used the internet in the last 3 months (optional 2025 module) · 2025 | [32] |
| Bulgaria | 26.3% | Persons aged 75-89; used the internet in the last 3 months (optional 2025 module) · 2025 | [32] |
| Country | Share of 75+ | Scope | Source |
|---|---|---|---|
| Norway | 95.2% | Individuals aged 75+ who used the internet in the last 3 months (national ICT household surveys compiled by OECD) · 2024 | [89] |
| Switzerland | 83.0% | Individuals aged 75+ who used the internet in the last 3 months (national ICT household surveys compiled by OECD) · 2025 | [89] |
| Canada | 72.0% | Individuals aged 75+ who used the internet in the last 3 months (national ICT household surveys compiled by OECD) · 2022 | [89] |
| United States | 69.1% | Individuals aged 75+ who used the internet in the last 3 months (national ICT household surveys compiled by OECD) · 2023 | [89] |
| Chile | 61.6% | Individuals aged 75+ who used the internet in the last 3 months (national ICT household surveys compiled by OECD) · 2024 | [89] |
| Belgium | 59.6% | Individuals aged 75+ who used the internet in the last 3 months (national ICT household surveys compiled by OECD) · 2024 | [89] |
| Korea | 58.1% | Individuals aged 75+ who used the internet in the last 3 months (national ICT household surveys compiled by OECD) · 2024 | [89] |
| Latvia | 57.4% | Individuals aged 75+ who used the internet in the last 3 months (national ICT household surveys compiled by OECD) · 2023 | [89] |
| Austria | 53.8% | Individuals aged 75+ who used the internet in the last 3 months (national ICT household surveys compiled by OECD) · 2023 | [89] |
| Ireland | 52.9% | Individuals aged 75+ who used the internet in the last 3 months (national ICT household surveys compiled by OECD) · 2024 | [89] |
| Croatia | 51.7% | Individuals aged 75+ who used the internet in the last 3 months (national ICT household surveys compiled by OECD) · 2023 | [89] |
| Costa Rica | 46.3% | Individuals aged 75+ who used the internet in the last 3 months (national ICT household surveys compiled by OECD) · 2024 | [89] |
| Spain | 44.6% | Individuals aged 75+ who used the internet in the last 3 months (national ICT household surveys compiled by OECD) · 2024 | [89] |
| Brazil | 32.8% | Individuals aged 75+ who used the internet in the last 3 months (national ICT household surveys compiled by OECD) · 2024 | [89] |
| Italy | 31.4% | Individuals aged 75+ who used the internet in the last 3 months (national ICT household surveys compiled by OECD) · 2024 | [89] |
| Mexico | 23.3% | Individuals aged 75+ who used the internet in the last 3 months (national ICT household surveys compiled by OECD) · 2024 | [89] |
| Egypt | 19.4% | Individuals aged 75+ who used the internet in the last 3 months (national ICT household surveys compiled by OECD) · 2022 | [89] |
| Israel | 61.0% | Individuals aged 75+ who used the internet in the last 3 months (Israel CBS data compiled by OECD; definition differs) · 2021 | [89] |
| Country | Share of 55-74 | Scope | Source |
|---|---|---|---|
| Korea | 94.9% | Individuals aged 55-74 who used the internet in the last 3 months (national ICT household surveys compiled by OECD) · 2024 | [89] |
| Canada | 92.7% | Individuals aged 55-74 who used the internet in the last 3 months (national ICT household surveys compiled by OECD) · 2022 | [89] |
| Chile | 90.7% | Individuals aged 55-74 who used the internet in the last 3 months (national ICT household surveys compiled by OECD) · 2024 | [89] |
| OECD | 86.7% | Individuals aged 55-74 who used the internet in the last 3 months (national ICT household surveys compiled by OECD) · 2025 | [89] |
| European Union (27 countries) | 86.2% | Individuals aged 55-74 who used the internet in the last 3 months (national ICT household surveys compiled by OECD) · 2025 | [89] |
| Israel | 86.1% | Individuals aged 55-74 who used the internet in the last 3 months (national ICT household surveys compiled by OECD) · 2021 | [89] |
| Costa Rica | 85.4% | Individuals aged 55-74 who used the internet in the last 3 months (national ICT household surveys compiled by OECD) · 2024 | [89] |
| United States | 83.8% | Individuals aged 55-74 who used the internet in the last 3 months (national ICT household surveys compiled by OECD) · 2023 | [89] |
| Brazil | 69.4% | Individuals aged 55-74 who used the internet in the last 3 months (national ICT household surveys compiled by OECD) · 2024 | [89] |
| Türkiye | 68.4% | Individuals aged 55-74 who used the internet in the last 3 months (national ICT household surveys compiled by OECD) · 2025 | [89] |
| Mexico | 63.2% | Individuals aged 55-74 who used the internet in the last 3 months (national ICT household surveys compiled by OECD) · 2024 | [89] |
| Egypt | 42.8% | Individuals aged 55-74 who used the internet in the last 3 months (national ICT household surveys compiled by OECD) · 2022 | [89] |
Comparing countries. Ireland: Eurostat's figure for ages 75 to 89 is far above the Irish statistics office's own figure for 75 and over, so Ireland is left out of the chart (both figures are listed under "Why the numbers disagree"). Norway's survey stops at 79, so its value for ages 75 to 89 is left out. Austria's survey stops at 84, so the OECD's "75 and over" figure for Austria covers ages 75 to 84. The OECD tables mix years from 2021 to 2025.
National surveys and the rest of the world
| Country, measure and age (year) | Share | Scope | Source |
|---|---|---|---|
| China: use the internet, 60+ (June 2025) | 52.0% | People aged 60+ in China who used the internet in the past six months · China · June 2025 | [90] |
| South Korea: used the internet in the past month, 70+ (2025) | 70.2% | People aged 70+ in South Korea who used the internet (wired or wireless) at least once in the last month · South Korea · July 2025 (last month) | [60] |
| Hong Kong: used the internet in the past year, 65+ (2025) | 87.1% | Persons aged 65+ in Hong Kong who had used the internet in the 12 months before enumeration · Hong Kong · 12 months before 2025 survey | [14] |
| Singapore: used the internet in the last 3 months, 60+ (2025) | 85% | Singapore residents aged 60+ who used the internet in the past 3 months · Singapore · 3 months before 2025 survey | [15] |
| Taiwan: have used the internet, 65+ (2025) | 63.3% | People aged 65+ in Taiwan who have ever used the internet (personal internet use rate) · Taiwan · 2025 (ROC year 114) | [73] |
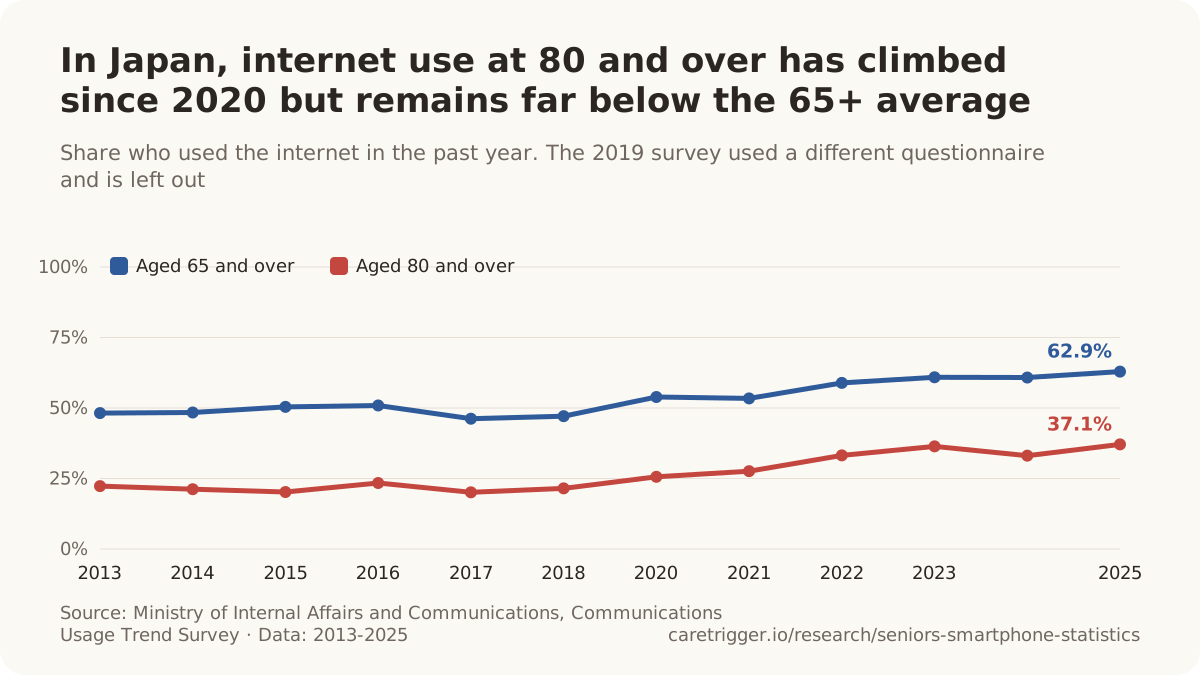
| Japan: used the internet in the past year, 65+ (2025) | 62.9% | Persons aged 65+ in private households in Japan who used the internet at least once in the past year (any device, any purpose; non-response excluded) · Japan · 12 months to end of August 2025 | [91] |
| Australia: used the internet in the past 6 months, 75+ (2025) | 98.6% | Australian adults aged 75+ who accessed the internet using any device in the past 6 months · Australia · 6 months to June 2025 | [20] |
| Canada: used the internet in the last 3 months, 65+ (2022) | 82.6% | Canadians aged 65+ (vs all aged 15+), persons living in the 10 provinces, excluding full-time residents of institutions; personal internet use in the past three months from any location, excluding business and school use · Canada (10 provinces) · 2022 | [92] |
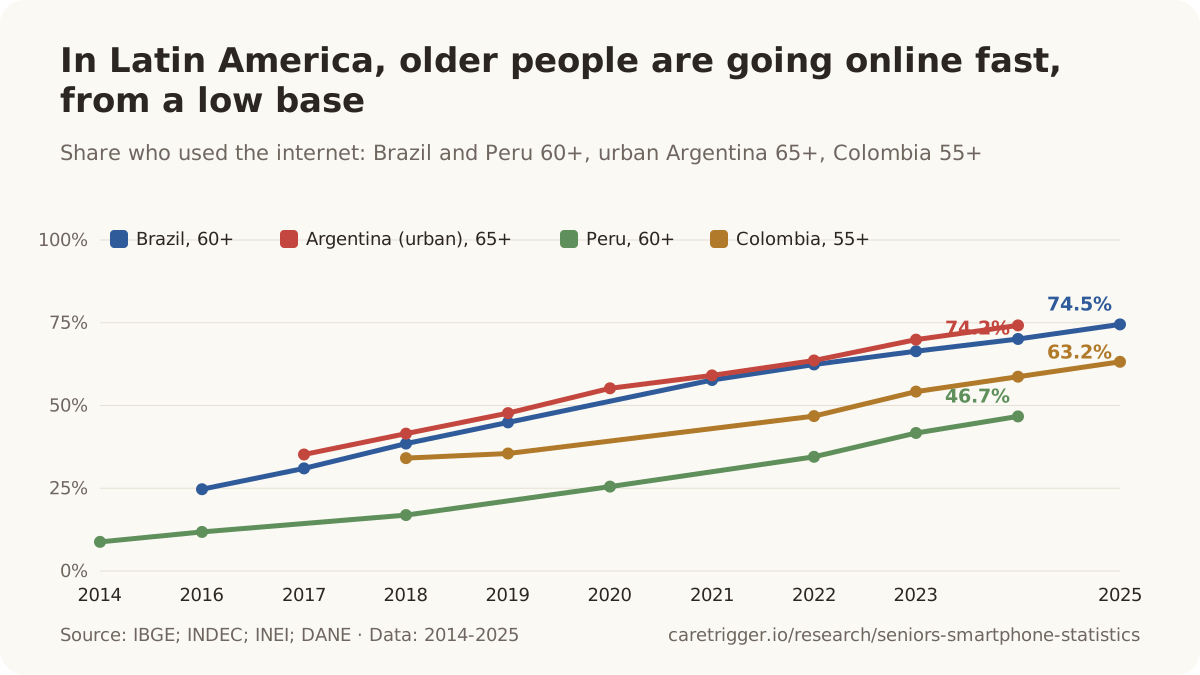
| Argentina (urban): used the internet, 65+ (late 2024) | 74.2% | Persons aged 65+ (vs all aged 4+) in private households in 31 urban agglomerations who used the internet · Argentina (31 urban agglomerations) · Q4 2024 | [93] |
| Colombia: used the internet, 55+ (2025) | 63.2% | Persons aged 55+ (vs all aged 5+) who used the internet anywhere from any device (ECV TIC module) · Colombia · 2025 | [94] |
| Peru: used the internet, 60+ (late 2025) | 52.4% | Persons aged 60+ (vs all aged 6+) who used the internet, Q4 2025 (preliminary) · Peru · Q4 2025 | [95] |
| Uruguay: used the internet in the last 3 months, 65+ (2022) | 58% | Persons aged 65+ (vs all aged 14+) who used the internet in the last three months · Uruguay · 2022 | [96] |
| Mexico: used the internet, 65+ (2024) | 42.1% | Persons aged 65+ (vs all aged 6+) in private dwellings who used the internet (ENDUTIH 2024 age banding) · Mexico · 2024 | [97] |
| Switzerland: used the internet in the last 3 months, 60+ (2025) | 92.6% | Persons aged 60+ (to about 88) in Switzerland; used the internet in the last 3 months · Switzerland · 2025 | [18] |
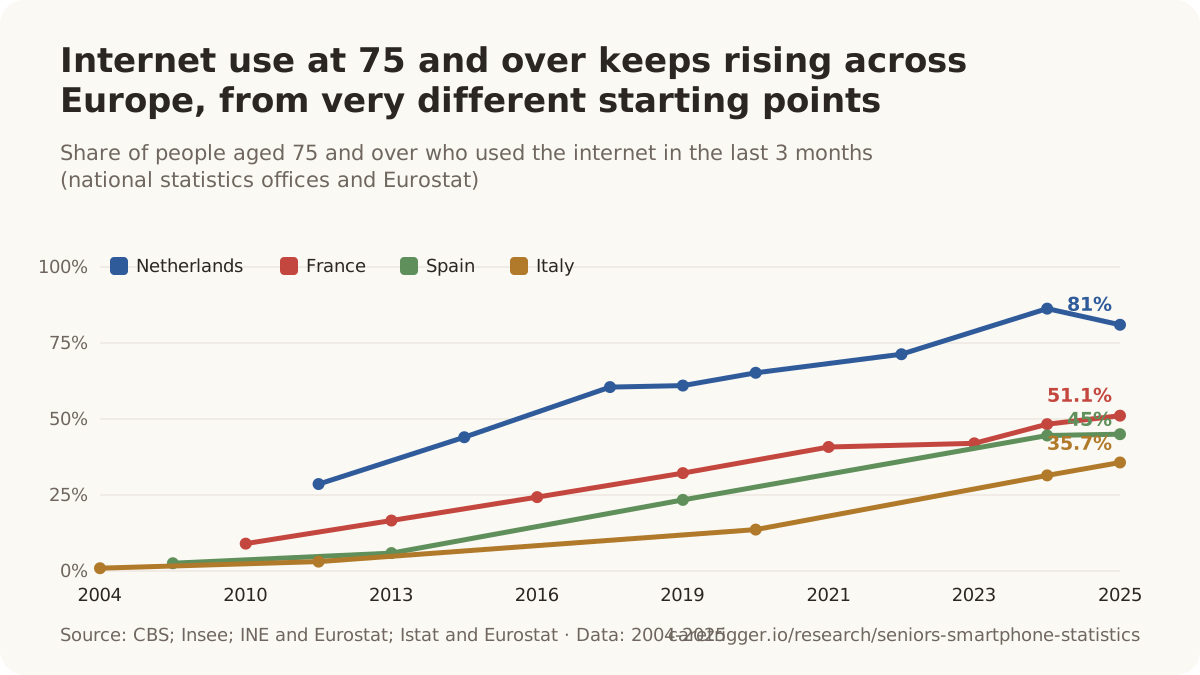
| France: used the internet in the last 3 months, 75+ (2025) | 51.1% | People aged 75+ living in ordinary dwellings in France; used the internet in the last 3 months · France · 2025 | [98] |
| Netherlands: used the internet in the last 3 months, 75+ (2025) | 81.0% | Persons aged 75+ in private households in the Netherlands; internet last used less than 3 months ago · Netherlands · 2025 | [19] |
| Italy: used the internet in the last 3 months, 75+ (2025) | 35.7% | People aged 75+ in Italy (Istat household survey); used the internet in the last 3 months · Italy · 2025 | [99] |
| Spain: used the internet in the last 3 months, 75+ (2025) | 45.0% | People aged 75+ in Spain (estimated 4,924,872 people); used the internet in the last 3 months · Spain · 2025 | [74] |
| United Kingdom: used the internet in the last 3 months, 75+ (2020, last edition) | 54.0% | Adults aged 75+ in UK private households; recent internet users (used in last 3 months), LFS · United Kingdom · 2020 (January-March) | [100] |
| Kenya: had used the internet, 75+ (2019 census) | 4.2% | Census population aged 75+ who used the internet · Kenya · 2019 | [79] |
- 161 million people aged 60 and over in China were internet users in June 2025, an internet use rate of 52.0% for that age group, 8.7 points higher than at the start of the 14th Five-Year Plan (CNNIC, 2025).[90]
- About 173 million people aged 60 and over in China were internet users in December 2025: 15.4% of 1.125 billion users (CNNIC, 2026; our calculation).[101]
- 119 million people aged 60 and over in China were internet users in December 2021, 11.5% of all users, and 43.2% of people aged 60+ used the internet (CNNIC, 2022).[102]
- 52.5% of people aged 60 and over in China used the internet in December 2024, against 78.6% of the whole population (CNNIC, 2025).[103]
- 43.2% of people aged 60 and over in China used the internet in December 2021 (CNNIC, 2022).[102]
- 12.29 million people aged 60 and over in South Korea used the internet in July 2025, 83.8% of that age group (Ministry of Science and ICT and NIA, 2026).[60]
- 94.4% of South Koreans aged 55 and over owned a smartphone in 2025, against 98.8% of the general public; among those aged 70 and over, 86.8% owned a mobile smart device (Ministry of Science and ICT and NIA, 2026).[104]
- 1,559,200 people aged 65 and over in Hong Kong had a smartphone in 2025, 24.2% of all smartphone holders aged 10+ (Census and Statistics Department, 2026).[14]
- 53.8% of people aged 70 and over in Taiwan used the internet in 2025, up from 50.2% in 2024 (60-69: 85.0%) (Taiwan Network Information Center, 2025).[105]
- 50.2% of people aged 70 and over in Taiwan used the internet in 2024 (Taiwan Network Information Center, 2025).[105]
- 56 in 100 people aged 60 and over in eight lower-connectivity counties of Taiwan owned a smartphone in 2022, and 55.6% had ever used the internet (Ministry of Digital Affairs, 2023).[106]
- 80.3% of Brazilians aged 60 and older had a mobile phone for personal use in 2025, compared with 89.8% of the whole population aged 10 and older (IBGE, PNAD Contínua ICT module 2025).[108]
- 74% of Brazilians aged 60 and older owned a mobile phone in 2025, compared with 89% of the population aged 10 and older (Cetic.br, TIC Domicílios 2025).[109]
- 85.1% of people aged 65 and older in urban Argentina used a mobile phone in the fourth quarter of 2024, compared with 90.5% of the urban population aged 4 and older (INDEC, EPH-MAUTIC 2024).[93]
- 83.3% of Peruvians aged 60 and older used a mobile phone in the fourth quarter of 2025, compared with 91.0% of the population aged 6 and older (INEI, ENAHO, preliminary).[95]
- 86.1% of Colombians aged 55 and older had a mobile phone in 2025, and 91.5% had used one (DANE, ECV ICT module 2025).[94]
- 78.3% of Colombians aged 55 and older had a mobile phone in 2018 (DANE, ECV ICT module 2018).[110]
- 57.8% of Mexicans aged 65 to 74 used the internet in 2025, compared with 86.1% of the population aged 6 and older (INEGI, ENDUTIH 2025; published 2026).[83]
- 87.1% of Indian households with a member aged 45 or over had a mobile phone in 2017-18 (urban 93.6%, rural 84.1%) (International Institute for Population Sciences, LASI Wave 1, 2020).[111]
- 78% of Africans aged over 60 owned a mobile phone in 2019/2021, but only 21% owned one with internet access, compared with 84% and 53% of those aged 18 to 30, on average across 34 countries (Afrobarometer Round 8; Dispatch 582, 2022).[112]
- 72% of Canadians aged 50 and older owned a smartphone in 2022, up from 46% in 2015, while ownership among young adults barely changed (Pew Research Center, Spring 2022 Global Attitudes Survey).[113]
- 90% of Canadians aged 50 and older used the internet or owned a smartphone in 2022, against 100% of those aged 18 to 29 (Pew Research Center, Spring 2022 Global Attitudes Survey).[113]
- 85% of Israelis aged 50 and older used the internet or owned a smartphone in 2022, against 93% of those aged 18 to 29 (Pew Research Center, Spring 2022 Global Attitudes Survey).[113]
- 57% of adults aged 50 and older in Poland used the internet or owned a smartphone in 2022, the lowest of 18 advanced economies surveyed, against 63% in Hungary, 93% in the Netherlands and 98% in South Korea (Pew Research Center, Spring 2022 Global Attitudes Survey).[113]
- 76.3% of Canadians aged 65 and older used the internet for personal use in the past three months in 2020, compared with 92.3% of all Canadians aged 15 and older (Statistics Canada, Canadian Internet Use Survey 2020).[92]
- 71.2% of Canadians aged 65 and older used the internet for personal use in the past three months in 2018, compared with 91.3% of all Canadians aged 15 and older (Statistics Canada, Canadian Internet Use Survey 2018).[92]
- 62% of Canadians aged 75 and older had used the internet in 2020 (given as 'about 62%'), against a national average of 92% (Statistics Canada, Canadian Internet Use Survey 2020).[114]
- 42.8% of Canadians aged 65 and older had a smartphone for personal use in 2018, compared with 80.3% of all Canadians aged 15 and older (Statistics Canada, Canadian Internet Use Survey 2018).[12]
- 68.2% of Canadians aged 65 and older were internet users in 2016 (General Social Survey; Statistics Canada, 2019).[78]
- 52.4% of Canadians aged 65 and older were internet users in 2013 (General Social Survey; Statistics Canada, 2019).[78]
- 46.0% of Canadians aged 65 and older were internet users in 2010 (General Social Survey; Statistics Canada, 2019).[78]
- 32.2% of Canadians aged 65 and older were internet users in 2007 (General Social Survey; Statistics Canada, 2019).[78]
- 28.5% of Canadians aged 80 and older were internet users in 2013, compared with 69.5% of those aged 65 to 69 (General Social Survey; Statistics Canada, 2019).[78]
- 23.1% of Canadians aged 80 and older were internet users in 2010, compared with 66.2% of those aged 65 to 69 (General Social Survey; Statistics Canada, 2019).[78]
- 15.5% of Canadians aged 80 and older were internet users in 2007, compared with 47.0% of those aged 65 to 69 (General Social Survey; Statistics Canada, 2019).[78]
- 49% of Uruguayans aged 65 and older had used the internet in the last three months in 2019, compared with 87% of all people aged 14 and older (AGESIC and INE, EUTIC 2019, as reported in EUTIC 2022).[96]
- 85.5% of adults aged 65-74 in the UK had used the internet in the last 3 months in 2020 (ONS Internet users, 2021).[115]
- 61.1% of adults aged 65-74 in the UK had used the internet in the last 3 months in 2013 (ONS Internet users, 2021).[115]
- 92.1% of all adults aged 16 and over in the UK had used the internet in the last 3 months in 2020 (ONS Internet users, 2021).[115]
- 86.9% of people aged 60-74 in France had used the internet in the last 3 months in 2025 (Insee, 2026).[116]
- 89.6% of all people aged 15 and over in France had used the internet in the last 3 months in 2025 (Insee, 2026).[117]
- 96% of people aged 65-74 in Sweden had used the internet in the last 3 months in 2026 (Statistics Sweden, 2026).[75]
- 97% of all people aged 16 and over in Sweden had used the internet in the last 3 months in 2026 (Statistics Sweden, 2026).[75]
- 54% of people aged 75 and over in Ireland had used the internet in the last 3 months in 2024 (CSO, 2025).[118]
- 65.1% of people aged 75-84 in Austria had used the internet in the last 3 months in 2025, up from 53.8% in 2023 (Statistik Austria, 2025).[119]
- 53.8% of people aged 75-84 in Austria had used the internet in the last 3 months in 2023 (Statistik Austria, 2025).[119]
- 51.7% of people aged 60 and over in Switzerland had used the internet in the last 3 months in 2014 (Swiss Federal Statistical Office).[18]
- 99% of people aged 60-74 in Denmark had used the internet in the last 3 months in 2026, up from 54% in 2008 (Statistics Denmark, 2026).[120]
- 54% of people aged 60-74 in Denmark had used the internet in the last 3 months in 2008 (Statistics Denmark).[120]
- 99% of people aged 75-79 in Norway had used the internet in the last 3 months in 2026, up from 16% in 2006 (Statistics Norway, 2026).[121]
- 16% of people aged 75-79 in Norway had used the internet in the last 3 months in 2006 (Statistics Norway).[121]
- 67% of people aged 75-89 in Finland had used the internet in the last 3 months in 2025 (Statistics Finland).[16]
- 27% of people aged 75-89 in Finland had used the internet in the last 3 months in 2013 (Statistics Finland).[16]
- 15% of people aged 65-74 in Finland had a touch-screen mobile phone (smartphone) in use in 2013 (Statistics Finland).[16]
- 37.4% of people aged 75 and over in the Netherlands used a mobile phone or smartphone to go online in 2020 (CBS).[19]
- 60% of people aged 85 and over in Sweden had used the internet in the last 3 months in 2024 (Statistics Sweden).[75]
- 57% of people aged 85 and over in Sweden had used the internet in the last 3 months in 2025 (Statistics Sweden).[75]
- 79% of people aged 75-84 in Sweden had used the internet in the last 3 months in 2022 (Statistics Sweden).[75]
| Period | Share of 65+ | Scope | Source |
|---|---|---|---|
| 12 months before 2014 survey | 24.0% | Persons aged 65+ in Hong Kong who had used the internet in the 12 months before enumeration · Hong Kong | [123] |
| 12 months before 2016 survey | 44.0% | Persons aged 65+ in Hong Kong who had used the internet in the 12 months before enumeration · Hong Kong | [123] |
| 12 months before 2017 survey | 51.2% | Persons aged 65+ in Hong Kong who had used the internet in the 12 months before enumeration · Hong Kong | [124] |
| 12 months before 2018 survey | 56.3% | Persons aged 65+ in Hong Kong who had used the internet in the 12 months before enumeration · Hong Kong | [125] |
| 12 months before 2019 survey | 62.2% | Persons aged 65+ in Hong Kong who had used the internet in the 12 months before enumeration · Hong Kong | [126] |
| 12 months before 2020 survey | 65.9% | Persons aged 65+ in Hong Kong who had used the internet in the 12 months before enumeration · Hong Kong | [127] |
| 12 months before 2021 survey | 70.0% | Persons aged 65+ in Hong Kong who had used the internet in the 12 months before enumeration · Hong Kong | [128] |
| 12 months before 2022 survey | 81.8% | Persons aged 65+ in Hong Kong who had used the internet in the 12 months before enumeration · Hong Kong | [129] |
| 12 months before 2023 survey | 84.2% | Persons aged 65+ in Hong Kong who had used the internet in the 12 months before enumeration · Hong Kong | [130] |
| 12 months before 2024 survey | 84.0% | Persons aged 65+ in Hong Kong who had used the internet in the 12 months before enumeration · Hong Kong | [14] |
| Period | Share of 70+ | Scope | Source |
|---|---|---|---|
| July 2021 (last month) | 49.7% | People aged 70+ in South Korea who used the internet (wired or wireless) at least once in the last month · South Korea | [131] |
| July 2022 (last month) | 54.7% | People aged 70+ in South Korea who used the internet (wired or wireless) at least once in the last month · South Korea | [132] |
| July 2023 (last month) | 64.4% | People aged 70+ in South Korea who used the internet (wired or wireless) at least once in the last month · South Korea | [133] |
| July 2024 (last month) | 68.0% | People aged 70+ in South Korea who used the internet (wired or wireless) at least once in the last month · South Korea | [134] |
| Period | Share of 60+ | Scope | Source |
|---|---|---|---|
| 3 months before 2020 survey | 73% | Singapore residents aged 60+ who used the internet in the past 3 months · Singapore | [15] |
| 3 months before 2021 survey | 81% | Singapore residents aged 60+ who used the internet in the past 3 months · Singapore | [15] |
| 3 months before 2022 survey | 78% | Singapore residents aged 60+ who used the internet in the past 3 months · Singapore | [15] |
| 3 months before 2023 survey | 76% | Singapore residents aged 60+ who used the internet in the past 3 months · Singapore | [15] |
| 3 months before 2024 survey | 77% | Singapore residents aged 60+ who used the internet in the past 3 months · Singapore | [15] |
| Period | Share of 65+ | Scope | Source |
|---|---|---|---|
| 2020 (ROC year 109) | 46.8% | People aged 65+ in Taiwan who have ever used the internet (personal internet use rate) · Taiwan | [73] |
| 2022 (ROC year 111) | 50.6% | People aged 65+ in Taiwan who have ever used the internet (personal internet use rate) · Taiwan | [73] |
| 2023 (ROC year 112) | 51.6% | People aged 65+ in Taiwan who have ever used the internet (personal internet use rate) · Taiwan | [73] |
| 2024 (ROC year 113) | 51.5% | People aged 65+ in Taiwan who have ever used the internet (personal internet use rate) · Taiwan | [73] |
| Period | Share of users | Scope | Source |
|---|---|---|---|
| March 2020 | 6.7% | Share of all internet users aged 6+ in China who are aged 60+ · China | [135] |
| December 2020 | 11.2% | Share of all internet users aged 6+ in China who are aged 60+ · China | [136] |
| December 2021 | 11.5% | Share of all internet users aged 6+ in China who are aged 60+ · China | [102] |
| December 2024 | 14.1% | Share of all internet users aged 6+ in China who are aged 60+ · China | [103] |
| June 2025 | 14.4% | Share of all internet users aged 6+ in China who are aged 60+ · China | [90] |
| December 2025 | 15.4% | Share of all internet users aged 6+ in China who are aged 60+ · China | [101] |
| Period | Share of 75+ | Scope | Source |
|---|---|---|---|
| 6 months to June 2020 | 60.7% | Australian adults aged 75+ who used a mobile phone to access the internet in the past 6 months (all adults 75+ in the base) · Australia | [20] |
| 6 months to June 2021 | 70.6% | Australian adults aged 75+ who used a mobile phone to access the internet in the past 6 months (all adults 75+ in the base) · Australia | [20] |
| 6 months to June 2022 | 72.2% | Australian adults aged 75+ who used a mobile phone to access the internet in the past 6 months (all adults 75+ in the base) · Australia | [20] |
| 6 months to June 2023 | 77.4% | Australian adults aged 75+ who used a mobile phone to access the internet in the past 6 months (all adults 75+ in the base) · Australia | [20] |
| 6 months to June 2024 | 83.9% | Australian adults aged 75+ who used a mobile phone to access the internet in the past 6 months (all adults 75+ in the base) · Australia | [20] |
| 6 months to June 2017 | 18.3% | Australian adults aged 75+ who used a mobile phone to access the internet in the past 6 months (all adults 75+ in the base) · Australia | [20] |
| 6 months to June 2018 | 23.7% | Australian adults aged 75+ who used a mobile phone to access the internet in the past 6 months (all adults 75+ in the base) · Australia | [20] |
| 6 months to June 2019 | 29.6% | Australian adults aged 75+ who used a mobile phone to access the internet in the past 6 months (all adults 75+ in the base) · Australia | [20] |
| Period | Share of 75+ | Scope | Source |
|---|---|---|---|
| 6 months to June 2020 | 89.9% | Australian adults aged 75+ who accessed the internet using any device in the past 6 months · Australia | [20] |
| 6 months to June 2021 | 93.9% | Australian adults aged 75+ who accessed the internet using any device in the past 6 months · Australia | [20] |
| 6 months to June 2022 | 94.4% | Australian adults aged 75+ who accessed the internet using any device in the past 6 months · Australia | [20] |
| 6 months to June 2023 | 95.3% | Australian adults aged 75+ who accessed the internet using any device in the past 6 months · Australia | [20] |
| 6 months to June 2024 | 97.3% | Australian adults aged 75+ who accessed the internet using any device in the past 6 months · Australia | [20] |
| 6 months to June 2017 | 55.1% | Australian adults aged 75+ who accessed the internet using any device in the past 6 months · Australia | [20] |
| 6 months to June 2018 | 45.4% | Australian adults aged 75+ who accessed the internet using any device in the past 6 months · Australia | [20] |
| 6 months to June 2019 | 51.8% | Australian adults aged 75+ who accessed the internet using any device in the past 6 months · Australia | [20] |
| Period | Share of 60+ | Scope | Source |
|---|---|---|---|
| 2016 | 60.7% | Persons aged 60+ (vs all aged 10+) who had a mobile cell phone for personal use (any type; PNAD does not separate smartphones) · Brazil | [108] |
| 2017 | 63.1% | Persons aged 60+ (vs all aged 10+) who had a mobile cell phone for personal use (any type; PNAD does not separate smartphones) · Brazil | [108] |
| 2018 | 63.8% | Persons aged 60+ (vs all aged 10+) who had a mobile cell phone for personal use (any type; PNAD does not separate smartphones) · Brazil | [108] |
| 2019 | 66.7% | Persons aged 60+ (vs all aged 10+) who had a mobile cell phone for personal use (any type; PNAD does not separate smartphones) · Brazil | [108] |
| 2021 | 71.3% | Persons aged 60+ (vs all aged 10+) who had a mobile cell phone for personal use (any type; PNAD does not separate smartphones) · Brazil | [108] |
| 2022 | 74.0% | Persons aged 60+ (vs all aged 10+) who had a mobile cell phone for personal use (any type; PNAD does not separate smartphones) · Brazil | [108] |
| 2023 | 76.3% | Persons aged 60+ (vs all aged 10+) who had a mobile cell phone for personal use (any type; PNAD does not separate smartphones) · Brazil | [108] |
| 2024 | 78.3% | Persons aged 60+ (vs all aged 10+) who had a mobile cell phone for personal use (any type; PNAD does not separate smartphones) · Brazil | [108] |
| Period | Share of 65+ | Scope | Source |
|---|---|---|---|
| Q4 2017 | 59.2% | Persons aged 65+ (vs all aged 4+) in private households in 31 urban agglomerations who used a mobile phone (any type) · Argentina (31 urban agglomerations) | [137] |
| Q4 2018 | 64.6% | Persons aged 65+ (vs all aged 4+) in private households in 31 urban agglomerations who used a mobile phone (any type) · Argentina (31 urban agglomerations) | [138] |
| Q4 2019 | 67.7% | Persons aged 65+ (vs all aged 4+) in private households in 31 urban agglomerations who used a mobile phone (any type) · Argentina (31 urban agglomerations) | [139] |
| Q4 2020 | 71.0% | Persons aged 65+ (vs all aged 4+) in private households in 31 urban agglomerations who used a mobile phone (any type) · Argentina (31 urban agglomerations) | [140] |
| Q4 2021 | 74.7% | Persons aged 65+ (vs all aged 4+) in private households in 31 urban agglomerations who used a mobile phone (any type) · Argentina (31 urban agglomerations) | [141] |
| Q4 2022 | 78.1% | Persons aged 65+ (vs all aged 4+) in private households in 31 urban agglomerations who used a mobile phone (any type) · Argentina (31 urban agglomerations) | [142] |
| Q4 2023 | 81.0% | Persons aged 65+ (vs all aged 4+) in private households in 31 urban agglomerations who used a mobile phone (any type) · Argentina (31 urban agglomerations) | [143] |
| Population | Share | Scope | Source |
|---|---|---|---|
| Persons aged 65-74 (vs all aged 6+) in private dwellings who used the internet (ENDUTIH) | 11.2% | Persons aged 65-74 (vs all aged 6+) in private dwellings who used the internet (ENDUTIH) · Mexico · 2015 | [83] |
| Persons aged 65-74 (vs all aged 6+) in private dwellings who used the internet (ENDUTIH) | 40.7% | Persons aged 65-74 (vs all aged 6+) in private dwellings who used the internet (ENDUTIH) · Mexico · 2022 | [83] |
| Persons aged 65-74 (vs all aged 6+) in private dwellings who used the internet (ENDUTIH) | 47.4% | Persons aged 65-74 (vs all aged 6+) in private dwellings who used the internet (ENDUTIH) · Mexico · 2023 | [83] |
| Persons aged 65-74 (vs all aged 6+) in private dwellings who used the internet (ENDUTIH) | 51.0% | Persons aged 65-74 (vs all aged 6+) in private dwellings who used the internet (ENDUTIH) · Mexico · 2024 | [83] |
| Persons aged 75+ (vs all aged 6+) in private dwellings who used the internet (ENDUTIH) | 3.0% | Persons aged 75+ (vs all aged 6+) in private dwellings who used the internet (ENDUTIH) · Mexico · 2015 | [83] |
| Persons aged 75+ (vs all aged 6+) in private dwellings who used the internet (ENDUTIH) | 18.3% | Persons aged 75+ (vs all aged 6+) in private dwellings who used the internet (ENDUTIH) · Mexico · 2022 | [83] |
| Persons aged 75+ (vs all aged 6+) in private dwellings who used the internet (ENDUTIH) | 23.1% | Persons aged 75+ (vs all aged 6+) in private dwellings who used the internet (ENDUTIH) · Mexico · 2023 | [83] |
| Persons aged 75+ (vs all aged 6+) in private dwellings who used the internet (ENDUTIH) | 23.3% | Persons aged 75+ (vs all aged 6+) in private dwellings who used the internet (ENDUTIH) · Mexico · 2024 | [83] |
| Period | Share of 60+ | Scope | Source |
|---|---|---|---|
| 2008 | 2% | Individuals aged 60+ (vs all 10+) who last used the internet less than three months before the interview · Brazil | [144] |
| 2015 | 16% | Individuals aged 60+ (vs all 10+) who last used the internet less than three months before the interview · Brazil | [145] |
| 2019 | 34% | Individuals aged 60+ (vs all 10+) who last used the internet less than three months before the interview · Brazil | [146] |
| 2024 | 59% | Individuals aged 60+ (vs all 10+) who last used the internet less than three months before the interview · Brazil | [147] |
| Period | Share of 75+ | Scope | Source |
|---|---|---|---|
| 2013 (January-March) | 29.1% | Adults aged 75+ in UK private households; recent internet users (used in last 3 months), LFS · United Kingdom | [115] |
| 2014 (January-March) | 31.9% | Adults aged 75+ in UK private households; recent internet users (used in last 3 months), LFS · United Kingdom | [115] |
| 2015 (January-March) | 33.0% | Adults aged 75+ in UK private households; recent internet users (used in last 3 months), LFS · United Kingdom | [115] |
| 2016 (January-March) | 38.7% | Adults aged 75+ in UK private households; recent internet users (used in last 3 months), LFS · United Kingdom | [115] |
| 2017 (January-March) | 40.5% | Adults aged 75+ in UK private households; recent internet users (used in last 3 months), LFS · United Kingdom | [115] |
| 2018 (January-March) | 43.6% | Adults aged 75+ in UK private households; recent internet users (used in last 3 months), LFS · United Kingdom | [115] |
| 2019 (January-March) | 46.8% | Adults aged 75+ in UK private households; recent internet users (used in last 3 months), LFS · United Kingdom | [115] |
| Country | Share of 50+ | Scope | Source |
|---|---|---|---|
| South Korea | 91% | Adults aged 50+ (vs all adults 18+) who say they own a smartphone (survey self-report) · 2018 | [148] |
| Israel | 80% | Adults aged 50+ (vs all adults 18+) who say they own a smartphone (survey self-report) · 2018 | [148] |
| Sweden | 77% | Adults aged 50+ (vs all adults 18+) who say they own a smartphone (survey self-report) · 2018 | [148] |
| Netherlands | 74% | Adults aged 50+ (vs all adults 18+) who say they own a smartphone (survey self-report) · 2018 | [148] |
| Australia | 68% | Adults aged 50+ (vs all adults 18+) who say they own a smartphone (survey self-report) · 2018 | [148] |
| United States | 67% | Adults aged 50+ (vs all adults 18+) who say they own a smartphone (survey self-report) · 2018 | [148] |
| Germany | 64% | Adults aged 50+ (vs all adults 18+) who say they own a smartphone (survey self-report) · 2018 | [148] |
| Spain | 60% | Adults aged 50+ (vs all adults 18+) who say they own a smartphone (survey self-report) · 2018 | [148] |
| United Kingdom | 60% | Adults aged 50+ (vs all adults 18+) who say they own a smartphone (survey self-report) · 2018 | [148] |
| France | 53% | Adults aged 50+ (vs all adults 18+) who say they own a smartphone (survey self-report) · 2018 | [148] |
| Italy | 48% | Adults aged 50+ (vs all adults 18+) who say they own a smartphone (survey self-report) · 2018 | [148] |
| Japan | 44% | Adults aged 50+ (vs all adults 18+) who say they own a smartphone (survey self-report) · 2018 | [148] |
| Canada | 43% | Adults aged 50+ (vs all adults 18+) who say they own a smartphone (survey self-report) · 2018 | [148] |
| Argentina | 42% | Adults aged 50+ (vs all adults 18+) who say they own a smartphone (survey self-report) · 2018 | [148] |
| Hungary | 35% | Adults aged 50+ (vs all adults 18+) who say they own a smartphone (survey self-report) · 2018 | [148] |
| Poland | 35% | Adults aged 50+ (vs all adults 18+) who say they own a smartphone (survey self-report) · 2018 | [148] |
| South Africa | 35% | Adults aged 50+ (vs all adults 18+) who say they own a smartphone (survey self-report) · 2018 | [148] |
| Brazil | 32% | Adults aged 50+ (vs all adults 18+) who say they own a smartphone (survey self-report) · 2018 | [148] |
| Mexico | 30% | Adults aged 50+ (vs all adults 18+) who say they own a smartphone (survey self-report) · 2018 | [148] |
| Greece | 29% | Adults aged 50+ (vs all adults 18+) who say they own a smartphone (survey self-report) · 2018 | [148] |
| Philippines | 27% | Adults aged 50+ (vs all adults 18+) who say they own a smartphone (survey self-report) · 2018 | [148] |
| Russia | 26% | Adults aged 50+ (vs all adults 18+) who say they own a smartphone (survey self-report) · 2018 | [148] |
| Nigeria | 20% | Adults aged 50+ (vs all adults 18+) who say they own a smartphone (survey self-report) · 2018 | [148] |
| Tunisia | 18% | Adults aged 50+ (vs all adults 18+) who say they own a smartphone (survey self-report) · 2018 | [148] |
| Kenya | 18% | Adults aged 50+ (vs all adults 18+) who say they own a smartphone (survey self-report) · 2018 | [148] |
| Indonesia | 13% | Adults aged 50+ (vs all adults 18+) who say they own a smartphone (survey self-report) · 2018 | [148] |
| India | 8% | Adults aged 50+ (vs all adults 18+) who say they own a smartphone (survey self-report) · 2018 | [148] |
05 / Who is left out
Which older adults are least likely to have a smartphone?
33.1% of people aged 65 and over with no formal schooling in South Korea owned a smartphone in 2023, against 95.2% of those with a college education (Ministry of Health and Welfare, 2024).[80]
Education and income divide older people more sharply than age alone, and so does living alone. The same pattern appears in every country with the data.
Living alone
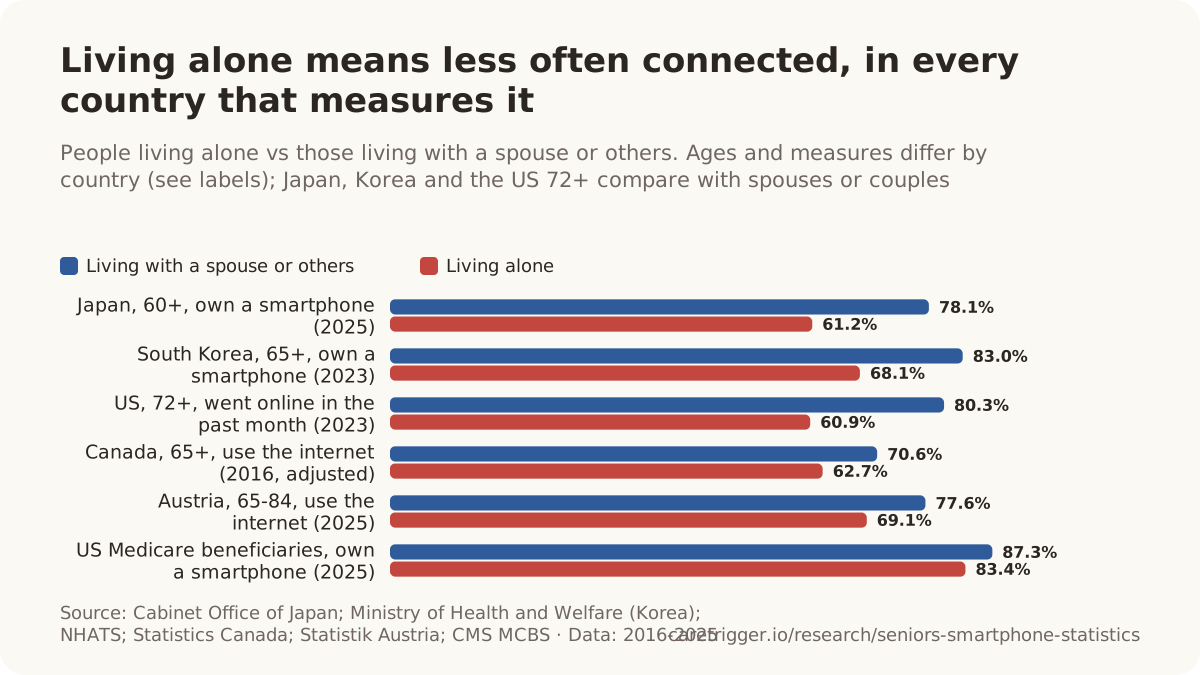
- 68.1% of people aged 65 and over who live alone in South Korea owned a smartphone in 2023, against 83.0% of those in older-couple households and 68.3% of those living with their children (Ministry of Health and Welfare, 2024).[80]
- 68.1% of people aged 65 and over in South Korea used a smartphone in 2023, below the 76.6% who owned one; among those living alone 57.3% used one (Ministry of Health and Welfare, 2024).[80]
- 60.9% of Medicare beneficiaries aged 72 and older who live alone went online in the past month in 2023, up from 26.4% in 2011, against 80.3% of those living with a spouse only (NHATS Trends Chart Book, 2026).[81]
- 83.4% of Medicare beneficiaries living alone in the community owned a smartphone in 2025, against 87.3% of those living with someone else (CMS Medicare Current Beneficiary Survey, 2026).[69]
- 87.3% of Medicare beneficiaries living alone in the community had access to the internet in 2025, against 93.5% of those living with someone else (CMS Medicare Current Beneficiary Survey, 2026).[69]
- 62.7% was the predicted probability of internet use for Canadian seniors living alone in 2016, against 70.6% for seniors living with others, after adjusting for age, gender, employment, education, rural residence and health (General Social Survey; Statistics Canada, 2019).[78]
- 69.1% of people aged 65-84 living alone (one-person households) in Austria had used the internet in the last 3 months in 2025, up from 57.2% in 2023 (Statistik Austria, 2025).[119]
- 77.6% of people aged 65-84 living with others (multi-person households) in Austria had used the internet in the last 3 months in 2025, up from 73.5% in 2023 (Statistik Austria, 2025).[119]
- 75.0% of people aged 65-84 in Austria had used the internet in the last 3 months in 2025, up from 68.5% in 2023 (Statistik Austria, 2025).[119]
- 43.5% of people aged 75 and over who live alone in Spain had used the internet in the last 3 months in 2025, close to the 44.2% of those living as a couple without children (INE, 2025).[74]
- 44.2% of people aged 75 and over living as a couple without children in Spain had used the internet in the last 3 months in 2025 (INE, 2025).[74]
- 71% of Chilean older people living alone had an internet connection at home in 2022, against 88% of all households with an older member (CASEN 2022; Observatorio del Envejecimiento UC-Confuturo, 2024).[22]
- 63.9% of Italian households made up only of people aged 65 and over had internet access at home in 2025, up 3.3 points on 2024 (Istat, 2026).[99]
- 82.9% of Chilean households made up only of older adults had internet access in 2024, the lowest of any household type, against 95.6% to 99.4% of households with children (SUBTEL, XI Encuesta de Acceso y Uso de Internet, 2024).[150]
- 2.7 times: the odds of lacking home internet service for single adults aged 62 and older compared with the reference group, in a 2011 National Social Life, Health, and Aging Project analysis (OATS and Humana Foundation, 2021).[152]
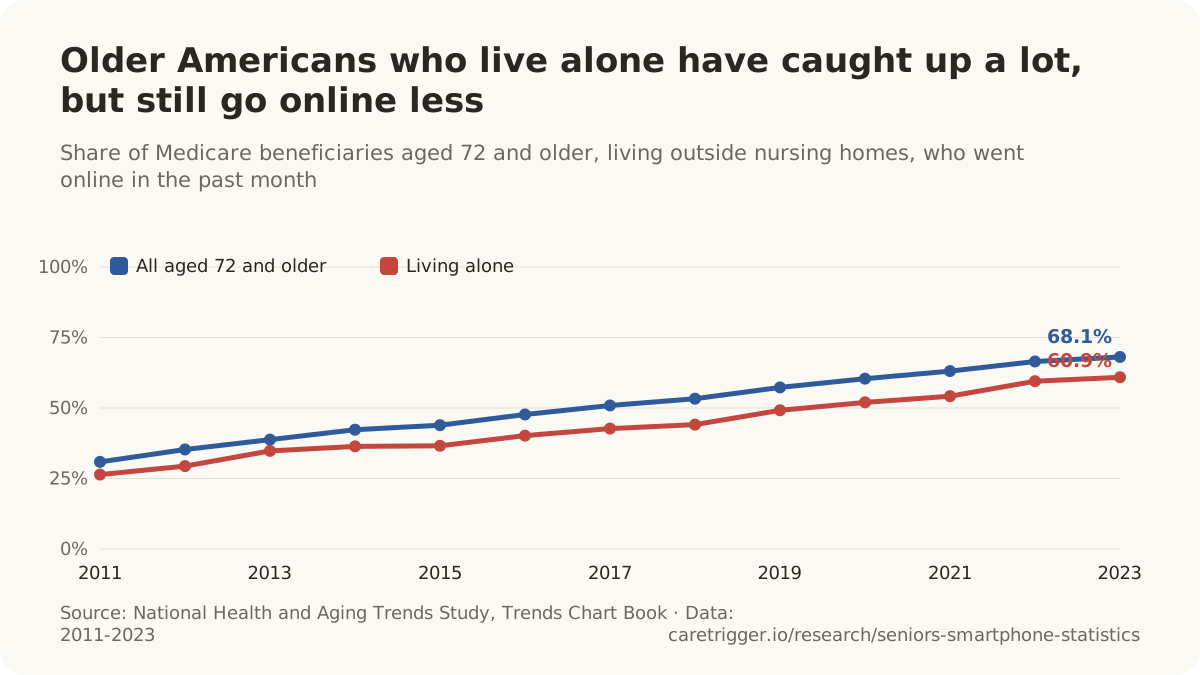
| Period | Share | Scope | Source |
|---|---|---|---|
| 2018 (survey at end of September 2018) | 28.4% | Household members (aged 6+) in elderly-only households (all members aged 65+, which covers older people living alone and older couples) in Japan who own a smartphone; non-response kept in the base · Japan | [45] |
| 2019 (survey at end of September 2019) | 34.1% | Household members (aged 6+) in elderly-only households (all members aged 65+, which covers older people living alone and older couples) in Japan who own a smartphone; non-response kept in the base · Japan | [46] |
| 2021 (survey at end of August 2021) | 49.5% | Household members (aged 6+) in elderly-only households (all members aged 65+, which covers older people living alone and older couples) in Japan who own a smartphone; non-response kept in the base · Japan | [47] |
| 2022 (survey at end of August 2022) | 56.5% | Household members (aged 6+) in elderly-only households (all members aged 65+, which covers older people living alone and older couples) in Japan who own a smartphone; non-response kept in the base · Japan | [48] |
| 2023 (survey at end of August 2023) | 58.9% | Household members (aged 6+) in elderly-only households (all members aged 65+, which covers older people living alone and older couples) in Japan who own a smartphone; non-response kept in the base · Japan | [49] |
| 2024 (survey at end of August 2024) | 60.0% | Household members (aged 6+) in elderly-only households (all members aged 65+, which covers older people living alone and older couples) in Japan who own a smartphone; non-response kept in the base · Japan | [50] |
How many older people live alone, country by country, is on our statistics page on seniors living alone.
Income and education
- 59.8% of people aged 65 and over in the poorest fifth of households in South Korea owned a smartphone in 2023, against 91.5% in the richest fifth (Ministry of Health and Welfare, 2024).[80]
- 74.0% of Medicare beneficiaries living in the community with incomes under $25,000 owned a smartphone in 2025, against 90.8% of those with $25,000 or more (CMS Medicare Current Beneficiary Survey, 2026).[69]
- 67.9% of Medicare beneficiaries living in the community without a high school diploma owned a smartphone in 2025, against 95.2% of those with a graduate or professional degree (CMS Medicare Current Beneficiary Survey, 2026).[69]
- 24.9% of Medicare beneficiaries aged 72 and older without a high school diploma went online in the past month in 2023, against 89.3% of those with a graduate degree (NHATS Trends Chart Book, 2026).[81]
- 65.9% of Canadians aged 65 and older in the lowest family-income quartile used the internet at home in 2022, compared with 91.4% of those in the highest quartile (Statistics Canada, Canadian Internet Use Survey 2022).[153]
- 71.0% of Canadians aged 65 and older with a high school education or less used the internet in 2022, compared with 87.1% of those with college, trade school or some university and 95.8% of those with a bachelor's degree or higher (Statistics Canada, Canadian Internet Use Survey 2022).[154]
- 54.1% was the predicted probability of internet use for Canadian seniors with household incomes under $20,000 in 2016, against 79.4% for those with incomes of $100,000 and over (General Social Survey linked to tax data; Statistics Canada, 2019).[78]
- 26.0% of urban Argentines aged 65 and older with no schooling used the internet in late 2024, compared with 55.7% of those with incomplete primary education and 92.7% of those with completed higher education (INDEC, EPH-MAUTIC 2024).[155]
- 41.0% of people aged 75 and over living in households with net income under 1,400 euros a month in Spain had used the internet in the last 3 months in 2025 (INE, 2025).[156]
- 64.9% of people aged 75 and over living in households with net income of 4,400 euros or more a month in Spain had used the internet in the last 3 months in 2025 (INE, 2025).[156]
- 21.5% of people aged 75 and over with less than primary education in Spain had used the internet in the last 3 months in 2025 (INE, 2025).[156]
- 78.9% of people aged 75 and over with a university degree (licenciatura, master or equivalent) in Spain had used the internet in the last 3 months in 2025 (INE, 2025).[156]
- 36.0% of people aged 75-89 with no or low formal education in the EU-27 had used the internet in the last 3 months in 2025 (Eurostat ICT survey, 2026).[32]
- 57.8% of people aged 75-89 with medium formal education in the EU-27 had used the internet in the last 3 months in 2025 (Eurostat ICT survey, 2026).[32]
- 83.3% of people aged 75-89 with high formal education in the EU-27 had used the internet in the last 3 months in 2025 (Eurostat ICT survey, 2026).[32]
- 72.7% of people aged 55-74 with low formal education in the EU-27 had used the internet in the last 3 months in 2025 (Eurostat ICT survey, 2026).[32]
- 97.7% of people aged 55-74 with high formal education in the EU-27 had used the internet in the last 3 months in 2025 (Eurostat ICT survey, 2026).[32]
- 58.4% of people aged 65-84 whose highest education is compulsory school in Austria had used the internet in the last 3 months in 2025, up from 46.7% in 2023 (Statistik Austria, 2025).[119]
- 96.4% of people aged 65-84 with a university degree in Austria had used the internet in the last 3 months in 2025, up from 92.3% in 2023 (Statistik Austria, 2025).[119]
- 27% of US adults aged 65 and older in households earning under $30,000 a year owned a smartphone in 2016, against 81% of those in households earning $75,000 or more (Pew Research Center, 2017).[84]
- 27% of US adults aged 65 and older with a high school education or less owned a smartphone in 2016, against 65% of those with a bachelor’s degree or more (Pew Research Center, 2017).[84]
- 27% of US adults aged 65 and older in households earning under $30,000 a year had home broadband in 2016, against 87% of those earning $75,000 or more (Pew Research Center, 2017).[157]
Women and men
- 70.8% of women aged 65 and over in South Korea owned a smartphone in 2023, against 83.9% of men (Ministry of Health and Welfare, 2024).[80]
- 67.6% of women aged 70 and over in South Korea used the internet in the month before the July 2025 survey, against 73.8% of men; smartphone ownership was 91.0% for women and 94.7% for men (Ministry of Science and ICT and NIA, 2026).[60]
- 86.7% of women aged 65 and over in Hong Kong had a smartphone in 2025, against 93.0% of men; internet use was 83.5% for women and 91.1% for men (Census and Statistics Department, 2026).[14]
- 13 to 15.6 percentage points was the gap by which men aged 70 and over in Taiwan outpaced women of the same age in internet use in 2025; below 70 the rates were about equal (Ministry of Digital Affairs, 2026).[73]
- 50.3% of Canadian women aged 65 and older had a smartphone for personal use in 2020, compared with 58.4% of men aged 65 and older (Statistics Canada, Canadian Internet Use Survey 2020).[12]
- 81.0% of Canadian women aged 65 and older used the internet in 2022, compared with 84.4% of men aged 65 and older (Statistics Canada, Canadian Internet Use Survey 2022).[154]
- 75.6% of Brazilian women aged 60 and older used the internet in 2025, compared with 73.0% of men aged 60 and older (IBGE, PNAD Contínua ICT module 2025).[29]
- 81.8% of Brazilian women aged 60 and older had a mobile phone for personal use in 2025, compared with 78.4% of men aged 60 and older (IBGE, PNAD Contínua ICT module 2025).[108]
- 56.9% of men aged 75-89 in the EU-27 had used the internet in the last 3 months in 2025 (Eurostat ICT survey, 2026).[32]
- 45.4% of women aged 75-89 in the EU-27 had used the internet in the last 3 months in 2025 (Eurostat ICT survey, 2026).[32]
- 79.6% of men aged 65-74 in the EU-27 had used the internet in the last 3 months in 2025 (Eurostat ICT survey, 2026).[32]
- 78.6% of women aged 65-74 in the EU-27 had used the internet in the last 3 months in 2025 (Eurostat ICT survey, 2026).[32]
- 43.0% of men aged 75 and over in Italy had used the internet in the last 3 months in 2025 (Istat, 2026).[99]
- 30.5% of women aged 75 and over in Italy had used the internet in the last 3 months in 2025 (Istat, 2026).[99]
- 47.9% of men aged 75 and over in Spain had used the internet in the last 3 months in 2025 (INE, 2025).[74]
- 43.0% of women aged 75 and over in Spain had used the internet in the last 3 months in 2025 (INE, 2025).[74]
- 79.2% of men aged 65-84 in Austria had used the internet in the last 3 months in 2025, up from 77.0% in 2023 (Statistik Austria, 2025).[119]
- 71.5% of women aged 65-84 in Austria had used the internet in the last 3 months in 2025, up from 61.5% in 2023 (Statistik Austria, 2025).[119]
- 74% of men aged 85 and over in Sweden had used the internet in the last 3 months in 2026 (Statistics Sweden, 2026).[75]
- 64% of women aged 85 and over in Sweden had used the internet in the last 3 months in 2026 (Statistics Sweden, 2026).[75]
- 62% of men aged 75-89 in Finland had a touch-screen mobile phone (smartphone) in use in 2025 (Statistics Finland).[16]
- 56% of women aged 75-89 in Finland had a touch-screen mobile phone (smartphone) in use in 2025 (Statistics Finland).[16]
- 59.4% of men aged 75 and over in the UK had used the internet in the last 3 months in 2020 (ONS Internet users, 2021).[115]
- 49.8% of women aged 75 and over in the UK had used the internet in the last 3 months in 2020 (ONS Internet users, 2021).[115]
- 67.3% of women aged 72 and older on Medicare went online in the past month in 2023, against 69.2% of men (NHATS Trends Chart Book, 2026).[81]
- 22% of US men aged 65 and older owned a smartphone in 2013, against 15% of women the same age (Pew Research Center, 2014).[86]
- 59% of US men aged 50 and older owned a smartphone in July 2016, against 51% of women aged 50 and older (AARP Research, 2016).[87]
Where they live, health and race
- 70.2% of people aged 65 and over in rural South Korea (eup and myeon areas) owned a smartphone in 2023, against 78.8% in urban districts (dong) (Ministry of Health and Welfare, 2024).[80]
- 82.0% of Medicare beneficiaries living outside metropolitan areas owned a smartphone in 2025, against 87.1% of those in metropolitan areas (CMS Medicare Current Beneficiary Survey, 2026).[69]
- 64.0% of Medicare beneficiaries aged 72 and older living outside metropolitan areas went online in the past month in 2023, against 68.9% in metropolitan areas (NHATS Trends Chart Book, 2026).[81]
- 41.5% of Colombians aged 55 and older in rural areas used the internet in 2025, compared with 69.1% of those in urban municipal centres (DANE, ECV ICT module 2025).[94]
- 50.9% of people aged 75 and over living in municipalities of 100,000+ inhabitants or provincial capitals in Spain had used the internet in the last 3 months in 2025 (INE, 2025).[74]
- 33.5% of people aged 75 and over living in municipalities of under 10,000 inhabitants in Spain had used the internet in the last 3 months in 2025 (INE, 2025).[74]
- 82.3% of people aged 65-84 living in cities in Austria had used the internet in the last 3 months in 2025, up from 70.7% in 2023 (Statistik Austria, 2025).[119]
- 68.6% of people aged 65-84 living in rural areas in Austria had used the internet in the last 3 months in 2025, up from 66.6% in 2023 (Statistik Austria, 2025).[119]
- 12% of rural US adults aged 65 and older owned a smartphone in 2013, against 20% of their urban and suburban peers (Pew Research Center, 2014).[86]
- 89.6% of people aged 65 and older in British Columbia used the internet in 2022, the highest of any province, against 73.4% in New Brunswick (Ontario 85.4%, Alberta 84.3%, Newfoundland and Labrador 79.2%, Prince Edward Island 77.8%, Saskatchewan 77.0%, Quebec 76.9%, Manitoba 76.6%, Nova Scotia 76.5%) (Statistics Canada, Canadian Internet Use Survey 2022).[92]
- 72.6% of Medicare beneficiaries living in the community with two or more disabilities owned a smartphone in 2025, against 91.5% of those with no disability (CMS Medicare Current Beneficiary Survey, 2026).[69]
- 53.0% of people aged 65 and over with a limitation in daily functioning in South Korea owned a smartphone in 2023, against 81.9% of those without one (Ministry of Health and Welfare, 2024).[80]
- 76.0% of Black non-Hispanic Medicare beneficiaries living in the community owned a smartphone in 2025, against 80.0% of Hispanic and 88.3% of White non-Hispanic beneficiaries (CMS Medicare Current Beneficiary Survey, 2026).[69]
- 43.9% of Black non-Hispanic Medicare beneficiaries aged 72 and older went online in the past month in 2023, against 38.5% of Hispanic and 74.2% of White non-Hispanic beneficiaries (NHATS Trends Chart Book, 2026).[81]
06 / Still offline
How many seniors are still offline?
42.9% of people aged 75-89 in the EU-27 had never used the internet in 2025 (Eurostat ICT survey, 2026).[32]
Most of the people who have never been online are now old, and in several countries the oldest make up a large majority of all non-users.
| Country and age (year) | Never used | Scope | Source |
|---|---|---|---|
| Spain, 75+ (2025) | 49.5% | People aged 75+ in Spain; never used the internet (100 minus 'ever used') · Spain · 2025 | [74] |
| United Kingdom, 75+ (2020) | 38.8% | Adults aged 75+ in UK private households; never used the internet, LFS · United Kingdom · 2020 (January-March) | [115] |
| Brazil, 60+ (2025) | 38% | Individuals aged 60+ (vs all 10+) who had never accessed the internet · Brazil · 2025 | [30] |
| Ireland, 75+ (2025) | 34% | People aged 75+ in Ireland; have never used the internet · Ireland · 2025 (first half) | [118] |
| Sweden, 85+ (2026) | 23% | People aged 85+ in Sweden; have never used the internet · Sweden · 2026 | [75] |
| EU-27, 65-74 (2025) | 16.4% | Individuals aged 65-74 in private households, EU-27; have never used the internet · European Union (EU-27) · 2025 | [32] |
| Netherlands, 75+ (2025) | 15.6% | Persons aged 75+ in private households in the Netherlands; never used the internet · Netherlands · 2025 | [19] |
| Germany, 65-74 (2025) | 10% | People aged 65-74 in Germany; have never used the internet ('Offliner'); survey covers ages 16-74 · Germany · 2025 | [158] |
- 32% of UK adults aged 75 and over had no internet access at home in autumn 2025, against 6% of all adults (Ofcom Adults' Media Literacy Tracker, 2026).[28]
- 20% (a fifth) of UK adults aged 75 or over had no internet access at home in 2025, half the 2019 level (Ofcom Technology Tracker analysis, 2025).[160]
- 3.9 million people aged over 65 in the UK (31% of the age group) did not use the internet at home, compared with 320,000 (4%) of those aged 35-44 (House of Lords Communications and Digital Committee, 2023, using Ofcom data).[161]
- More than half of the 2.4 million UK adults with zero basic digital skills are aged over 75 (House of Lords Communications and Digital Committee, 2023, citing the Lloyds Bank Consumer Digital Index 2022).[161]
- 23% of Swedes aged 76 and over did not use the internet in 2026, down from 32% in 2021 (Swedish Internet Foundation, 2026).[163]
- 32% of Swedes aged 76 and over did not use the internet in 2021 (Swedish Internet Foundation, 2026).[163]
- 6.3% of people aged 65 and older in US households lived in a household with no computer, smartphone or tablet in 2024, against 2.2% of the whole household population (US Census Bureau, American Community Survey, 2025).[39]
- 2.7% of community-dwelling Medicare beneficiaries aged 65 and older, more than 1.3 million people, used none of a computer, cell phone or tablet in 2022 (Innovation in Aging, 2024).[164]
- 21.8 million US adults aged 65 and older (42%) had no wireline broadband at home in 2018; 58% had it, against 73% of adults aged 18 to 64 (OATS and Humana Foundation, 2021).[152]
- 66.5% of Australians aged 75 and over were digitally excluded or highly excluded in 2025, against 20.6% of all Australians (Australian Digital Inclusion Index, 2025).[165]
- 54% of people aged 65 and older in seven Latin American countries had no internet connection at home around 2018, compared with 42% of people under 25 (ECLAC, Envejecimiento en América Latina y el Caribe, 2022).[166]
- 25% more, on average, could be paid by consumers who are not online for things like home insurance, train travel and food, according to a 2023 Centre for Social Justice estimate cited by the UK government (Department for Science, Innovation and Technology, Digital Inclusion Action Plan, 2025).[167]
- 65.5% of adults aged 75 and over in the UK had never used the internet in 2013 (ONS Internet users, 2021).[115]
| Period | Share of 65-74 | Scope | Source |
|---|---|---|---|
| 2007 | 82.8% | Individuals aged 65-74 in private households, EU-27; have never used the internet · European Union (EU-27) | [32] |
| 2010 | 71.0% | Individuals aged 65-74 in private households, EU-27; have never used the internet · European Union (EU-27) | [32] |
| 2013 | 60.9% | Individuals aged 65-74 in private households, EU-27; have never used the internet · European Union (EU-27) | [32] |
| 2016 | 48.7% | Individuals aged 65-74 in private households, EU-27; have never used the internet · European Union (EU-27) | [32] |
| 2019 | 35.6% | Individuals aged 65-74 in private households, EU-27; have never used the internet · European Union (EU-27) | [32] |
| 2022 | 25.7% | Individuals aged 65-74 in private households, EU-27; have never used the internet · European Union (EU-27) | [32] |
| Period | Share of non-users | Scope | Source |
|---|---|---|---|
| December 2021 | 40.8% | Share of non-internet-users in China who are aged 60+ (from 2025, among non-users aged 6+) · China | [102] |
| December 2022 | 37.4% | Share of non-internet-users in China who are aged 60+ (from 2025, among non-users aged 6+) · China | [168] |
| December 2023 | 39.8% | Share of non-internet-users in China who are aged 60+ (from 2025, among non-users aged 6+) · China | [169] |
| December 2024 | 46.8% | Share of non-internet-users in China who are aged 60+ (from 2025, among non-users aged 6+) · China | [103] |
| June 2025 | 52.1% | Share of non-internet-users in China who are aged 60+ (from 2025, among non-users aged 6+) · China | [90] |
07 / What they do
What do seniors use their smartphones for?
86.7% of US internet users aged 65 and older used text messaging or instant messaging in November 2023, versus 95.1% of all adult internet users, up from 57.1% in July 2015 (NTIA, 2024).[26]
Messaging and calls come first, then news, banking and health. Older users are less likely than younger ones to do each of these online, but the gap is narrowing fastest for messaging and video calls.
| Activity | Share of 65-74 | Scope | Source |
|---|---|---|---|
| Instant messaging (WhatsApp, Messenger, Viber) | 58.9% | Individuals aged 65-74 in the EU-27, share of ALL individuals in the age group (not only internet users): Internet use: instant messaging, i.e. exchanging messages, for example, via Skype, Messenger, WhatsApp, Viber (last 3 months) · European Union (EU-27) · 2025 | [170] |
| Sending or receiving e-mail | 58.2% | Individuals aged 65-74 in the EU-27, share of ALL individuals in the age group (not only internet users): Internet use: sending/receiving e-mails (last 3 months) · European Union (EU-27) · 2025 | [171] |
| Calls or video calls over the internet | 52.3% | Individuals aged 65-74 in the EU-27, share of ALL individuals in the age group (not only internet users): Internet use: telephoning or video calls (last 3 months) · European Union (EU-27) · 2025 | [172] |
| Reading news online | 51.9% | Individuals aged 65-74 in the EU-27, share of ALL individuals in the age group (not only internet users): Internet use: reading online news sites/newspapers/news magazines (last 3 months) · European Union (EU-27) · 2025 | [173] |
| Internet banking | 48.0% | Individuals aged 65-74 in the EU-27, share of ALL individuals in the age group (not only internet users): Internet use: Internet banking (last 3 months) · European Union (EU-27) · 2025 | [174] |
| Looking for health information | 46.8% | Individuals aged 65-74 in the EU-27, share of ALL individuals in the age group (not only internet users): Internet use: seeking health information (last 3 months) · European Union (EU-27) · 2025 | [175] |
| Buying something online (last 12 months) | 44.4% | Individuals aged 65-74 in the EU-27 whose last online purchase was within the last 12 months, share of all individuals in the age group · European Union (EU-27) · 2025 | [176] |
| Using a public authority website or app (last 12 months) | 41.4% | Individuals aged 65-74 in the EU-27 who interacted with public authorities via websites or apps (last 12 months), share of all individuals in the age group · European Union (EU-27) · 2025 | [177] |
| Taking part in social networks | 34.1% | Individuals aged 65-74 in the EU-27, share of ALL individuals in the age group (not only internet users): Internet use: participating in social networks (creating user profile, posting messages or other contributions to facebook, twitter, etc.) (last 3 months) · European Union (EU-27) · 2025 | [178] |
| Watching video from sharing services such as YouTube (2024) | 29.4% | Individuals aged 65-74 in the EU-27, share of ALL individuals in the age group (not only internet users): Internet use: watching video content from sharing services (last 3 months) · European Union (EU-27) · 2024 | [179] |
| Booking a doctor's appointment online (2024) | 28.2% | Individuals aged 65-74 in the EU-27, share of ALL individuals in the age group (not only internet users): Internet use: making an appointment with a practitioner via a website (last 3 months) · European Union (EU-27) · 2024 | [180] |
| Opening personal health records online (2024) | 19.2% | Individuals aged 65-74 in the EU-27, share of ALL individuals in the age group (not only internet users): Internet use: accessing personal health records online (last 3 months) · European Union (EU-27) · 2024 | [181] |
- 32.6% of people aged 65-74 in the EU-27 made calls or video calls over the internet in the last 3 months in 2020, versus 62.6% of all people aged 16-74 (Eurostat, 2026).[182]
- 24.2% of people aged 65-74 in the EU-27 made calls or video calls over the internet in the last 3 months in 2019, versus 51.9% of all people aged 16-74 (Eurostat, 2026).[183]
- 3.1% of people aged 65-74 in the EU-27 made calls or video calls over the internet in the last 3 months in 2008, versus 16.6% of all people aged 16-74 (Eurostat, 2026).[184]
- 97.0% of people aged 65-74 in Denmark used internet banking in the last 3 months in 2025, the highest share in the EU, versus 97.6% of all people aged 16-74 in Denmark (Eurostat, 2026).[185]
- 6.7% of people aged 65-74 in Bulgaria used internet banking in the last 3 months in 2025, the lowest share in the EU, versus 31.1% of all people aged 16-74 in Bulgaria (Eurostat, 2026).[186]
- 46.3% of US internet users aged 65 and older took part in online video or voice calls or conferencing in November 2023, versus 66.1% of all adult internet users, up from 28.6% in November 2019 (NTIA, 2024).[26]
- 63.2% of US internet users aged 65 and older used online financial services such as banking, investing or paying bills in November 2023, versus 76.1% of all adult internet users (NTIA, 2024).[26]
- 57.1% of US internet users aged 65 and older used text messaging or instant messaging in July 2015, versus 86.1% of all adult internet users (NTIA, 2016).[26]
- 64% of US adults aged 65 and older said they ever use YouTube in 2025, versus 84% of all US adults (Pew Research Center, 2025).[187]
- 49% of US adults aged 65 and older said they ever use YouTube in 2021, up from 38% in 2019 (Pew Research Center, 2022).[25]
- 57% of US adults aged 65 and older said they ever use Facebook in 2025, versus 71% of all US adults (Pew Research Center, 2025).[187]
- 45% of US adults aged 65 and older visited Facebook at least once a day in early 2025, versus 52% of all US adults (Pew Research Center, 2025).[188]
- 27% of US adults aged 65 and older visited YouTube at least once a day in early 2025, versus 48% of all US adults (Pew Research Center, 2025).[188]
- 20% of US adults aged 65 and older said they ever use WhatsApp in 2025, versus 32% of all US adults (Pew Research Center, 2025).[187]
- 19% of US adults aged 65 and older said they ever use Instagram in 2025, versus 50% of all US adults (Pew Research Center, 2025).[187]
- 12% of US adults aged 65 and older said they ever use TikTok in 2025, versus 37% of all US adults (Pew Research Center, 2025).[187]
- 23% of US adults aged 65 and older said they ever use AI chatbots such as ChatGPT, Gemini or Copilot in 2026, up from 12% in 2024, versus 49% of all US adults (Pew Research Center, 2026).[189]
- 14% of US adults aged 80 and older had used generative AI by 2025, versus 21% of those aged 70-79, 43% of those aged 50-59 and 30% of all adults aged 50+ (AARP, 2025).[37]
- 94% of US adults aged 50 and older texted to stay in touch with family and friends at least once a month in 2025, up from 79% in 2016; texting overtook email (77%) as their lead way to communicate (AARP, 2025).[37]
- 46% of US adults aged 50 and older video chatted with family and friends at least once a month in 2025, up from 33% in 2016 (AARP, 2025).[37]
- 63% of US adults aged 50 and older used finance or banking services online in the past 3 months in 2025, and 75% used maps and navigation (AARP, 2025).[37]
- 46% of US adults aged 50 and older used medical digital services (for example GoodRx, LifeAlert or health records) in the past 3 months in 2025, up from 35% in 2024 (AARP, 2025).[37]
- 50.9% of Canadians aged 65 and older sent messages with an instant messaging app in 2022, versus 78.0% of all Canadians aged 15+, up from 33.6% of seniors in 2018 (Statistics Canada, 2023).[190]
- 37.8% of Canadians aged 65 and older made online voice or video calls in 2022, versus 64.7% of all Canadians aged 15+, up from 21.2% of seniors in 2018 (Statistics Canada, 2023).[190]
- 58.0% of Canadians aged 65 and older banked online in 2022, versus 77.6% of all Canadians aged 15+, up from 43.9% of seniors in 2018 (Statistics Canada, 2023).[190]
- 55.4% of Canadians aged 65 and older used government online services in 2022, versus 76.3% of all Canadians aged 15+, up from 41.0% of seniors in 2018 (Statistics Canada, 2023).[190]
- 40.7% of Canadians aged 65 and older booked appointments online in 2022, versus 58.5% of all Canadians aged 15+, up from 16.6% of seniors in 2018 (Statistics Canada, 2023).[190]
- 56% of Australians aged 75 and older used a messaging or calling app in the six months to June 2024, more than triple the 17% of 2019, versus 84% of all adults (ACMA, 2024).[194]
- 25% of Australians aged 75 and older took part in video calling in the six months to June 2024, fewer than any younger age group; 64% shopped online and 50% used a government services app (ACMA, 2024).[195]
08 / Time on the phone
How much time do seniors spend on their phones?
200 minutes (3 hours 20 minutes) a day: average time UK internet users aged 65 and older spent online in May 2025, up 10 minutes on 2024, versus 4 hours 30 minutes for all adult users (Ofcom, 2025).[4]
Older users spend less time on their phones than younger adults and are far less likely to feel they overdo it, but daily use is now the norm.
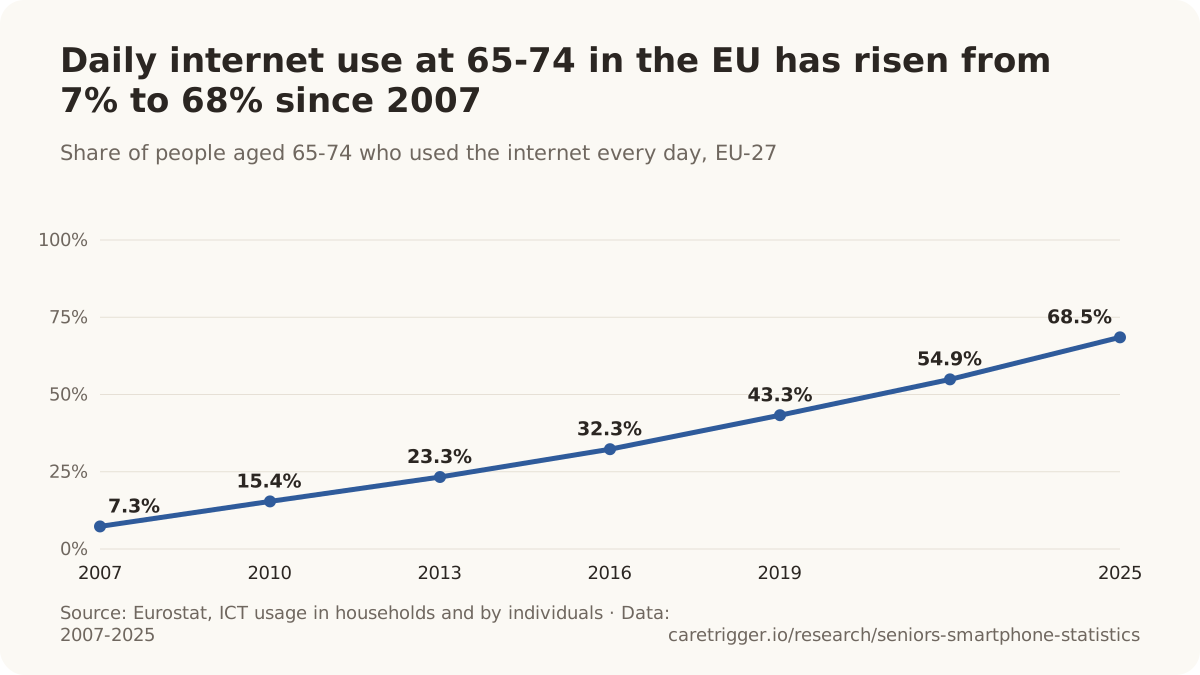
- 9% of US adults aged 65 and older said they use their smartphone almost constantly in 2026, versus 26% of all US adults and 42% of those aged 18-29 (Pew Research Center, 2026).[196]
- 14% of US adults aged 65 and older said they are online almost constantly in 2025, versus 41% of all US adults and 63% of those aged 18-29 (Pew Research Center, 2026).[197]
- 8% of US adults aged 65 and older said they go online almost constantly in 2021, versus 31% of all US adults; Pew found no growth for this age group since it first asked in 2015 (Pew Research Center, 2021).[198]
- 25% of US adults aged 65 and older said they spend too much time on their smartphone in 2026, and 54% said about the right amount, versus 53% and 36% of all US adults (Pew Research Center, 2026).[196]
- 166 minutes (2 hours 46 minutes) a day: average time UK internet users aged 65 and older spent online in May 2023, versus 3 hours 41 minutes for all adult users (Ofcom, 2023).[199]
- 68.5% of people aged 65-74 in the EU-27 used the internet daily in 2025, versus 89.5% of all people aged 16-74, up from 7.3% in 2007 (Eurostat, 2026).[200]
- 95.7% of people aged 65-74 in Ireland used the internet daily in 2025, the highest share in the EU, versus 99.3% of all people aged 16-74 in Ireland (Eurostat, 2026).[201]
- 46.6% of people aged 65-74 in Greece used the internet daily in 2025, the lowest share in the EU, versus 87.2% of all people aged 16-74 in Greece (Eurostat, 2026).[202]
- 34.7% of people aged 75 and over in Spain used the internet daily in 2024, versus 70.6% of those aged 65-74 and 91.5% of all people aged 16-74 (Eurostat, 2026).[203]
- 28.7% of people aged 75 and over in Italy used the internet daily in 2024, versus 64.4% of those aged 65-74 and 87.4% of all people aged 16-74 (Eurostat, 2026).[204]
- 84.0% of Chileans aged 60 and older used a smartphone every day in 2024, compared with 94.8% of all people aged 16 and older and 98.8% of those aged 16 to 44 (SUBTEL, XI Encuesta de Acceso y Uso de Internet, 2024).[150]
- 78.1% of Chileans aged 60 and older said they habitually used a smartphone in 2023, compared with 93% of all people aged 16 and older and 95.6% to 98.4% of younger age groups (SUBTEL, X Encuesta de Acceso y Uso de Internet, 2023).[205]
- 98% of US smartphone owners aged 50 and older used their smartphone daily in 2025, up from 95% in 2016, while daily desktop use among desktop owners fell from 89% to 58% (AARP, 2025).[37]
- 68% of Australians aged 75 and older who go online with a mobile phone did so multiple times a day in the six months to June 2024, the lowest of any age group, versus 92% of all adults (ACMA, 2024).[195]
- 12.3% of Canadians aged 65 and older checked their smartphone at least every 30 minutes in a typical day in 2020, versus 43.4% of all Canadians aged 15+, up from 9.0% in 2018 (Statistics Canada, 2021).[12]
- 9.0% of Canadians aged 65 and older checked their smartphone at least every 30 minutes in a typical day in 2018, versus 36.5% of all Canadians aged 15+ (Statistics Canada, 2021).[12]
- 22.4% of Canadians aged 65 and older said checking their smartphone is the first thing they do after waking up in 2020, versus 53.2% of all Canadians aged 15+ (Statistics Canada, 2021).[12]
- 18.4% of Canadians aged 65 and older said checking their smartphone is the last thing they do before going to sleep in 2020, versus 51.2% of all Canadians aged 15+ (Statistics Canada, 2021).[12]
- 21% of US smartphone owners aged 65 and older checked their phone a few times an hour or more in 2015, and 3% every few minutes, versus 52% of all smartphone owners (Gallup, 2015).[206]
- 76% of US internet users aged 65 and older went online at least daily in 2016: 8% almost constantly, 51% several times a day and 17% about once a day (Pew Research Center, 2017).[207]
- 10% of UK adults aged 75 and older felt their screen time was too high on most days in 2025, versus 40% of all adults and 61% of those aged 16-24 (Ofcom, 2026).[159]
- 11.5% of South Korean smartphone users in their 60s were at risk of smartphone overdependence in 2025, half the 22.3% of adults aged 20-59 and down 0.4 points on 2024 (MSIT, 2026).[208]
- 24% of Africans aged 56 and older used the internet every day or a few times a week in 2021/2023 (16% daily), compared with 52% of those aged 18 to 35, on average across 39 countries (Afrobarometer Round 9; Policy Paper 95, 2025).[23]
09 / What holds them back
Why don't some seniors use smartphones?
49.4% of people aged 70 and older in Japan who rarely or never use a smartphone or tablet said they do not know how to use one (80+: 52.5%), the top reason among 166 older non-users (Cabinet Office, 2025).[209]
Not knowing how, and not seeing the need, outweigh cost. Skills are the steepest barrier: fewer than half of Europeans in their late sixties and early seventies have basic digital skills.
- 81% of UK adults aged 65 and older without home internet who were unlikely to get it said this was because they lacked interest or need; 24% said someone else can go online for them and 12% that the internet is too complicated (Ofcom, 2025).[4]
- 68% of UK adults without home internet said they are not interested or feel no need to be online, 38% cited complexity and 25% cost; two-thirds of this group are aged 75 and older (Ofcom, 2026).[159]
- 42% of UK adults without home internet had asked someone else to do something online for them, most often shopping (56%) or online health services (37%), yet 82% said nothing would prompt them to go online (Ofcom, 2026).[159]
- 67.5% of US households headed by someone aged 65 or older with no one using the internet at home gave 'don't need it or not interested' as the main reason in November 2023, versus 55.7% of all such households; 10.5% said it was too expensive (NTIA, 2024).[26]
- 69% of UK adults aged 75 and older without home internet reported a physical disability, versus 42% of those aged 75+ who are online; eyesight (16% vs 4%), mobility (43% vs 21%) and dexterity (13% vs 6%) problems were all more common (Ofcom, 2026).[159]
- 23% of US adults aged 65 and older had a physical or health condition that makes reading difficult, and 29% a disability or chronic disease that prevents full participation in daily activities; 39% had at least one (Pew Research Center, 2014).[210]
- A prevalence ratio of 0.69 for using email or texting (95% CI 0.58-0.82) was found among US Medicare beneficiaries aged 65 and over with vision impairment compared with those without, after adjustment; hearing impairment made no difference (Gell et al., The Gerontologist, 2015; National Health and Aging Trends Study 2011).[211]
Skills and confidence
- 33% of people aged 65-74 in the EU-27 had at least basic overall digital skills in 2025, versus 60.4% of all people aged 16-74, up from 25.5% in 2021 (Eurostat, 2026).[212]
- 28.2% of people aged 65-74 in the EU-27 had at least basic overall digital skills in 2023, versus 55.6% of all people aged 16-74 (Eurostat, 2026).[213]
- 25.5% of people aged 65-74 in the EU-27 had at least basic overall digital skills in 2021, versus 53.9% of all people aged 16-74 (Eurostat, 2026).[214]
- 11.1% of people aged 65-74 in the EU-27 had above basic overall digital skills in 2025, versus 31.4% of all people aged 16-74 (Eurostat, 2026).[215]
- 21.0% of people aged 65-74 in the EU-27 could not be assessed for digital skills in 2025 because they had not used the internet in the previous 3 months, versus 6.2% of all people aged 16-74 (Eurostat, 2026).[216]
- 29.4%: digital capability of South Koreans aged 70 and older relative to the general public in 2025 (general public = 100), versus 63.1% for people in their 60s and 56.2% for all aged 55+ (NIA, 2026).[217]
- 71.8%: overall digital level (access, skills and use) of South Koreans aged 55 and older relative to the general public in 2025, up from 69.1% in 2021, the lowest of the four disadvantaged groups measured (NIA, 2026).[217]
- 26.5% of South Koreans aged 70 and older said they can install and use the apps they need on a mobile device by themselves in 2025, and 39.0% that they can change basic settings, versus 52.2% and 62.2% of all aged 55+ (NIA, 2026).[217]
- 48% of US adults aged 80 and older agreed they have the digital skills needed to take full advantage of being online in 2025, versus 61% of those aged 70-79 and 70% of those aged 50-59 (AARP, 2025).[37]
- 66% of US adults aged 80 and older felt technology is not designed with their age in mind in 2025, versus 60% of all adults aged 50+ and 54% of those aged 50-59 (AARP, 2025).[37]
- 34% of UK online adults aged 75 and older did not feel confident managing who has access to their personal information in 2025, versus 18% of all online adults (Ofcom, 2026).[159]
- 47% of US adults aged 65-80 who had not set up a patient portal said they are not comfortable with technology, versus 30% of those aged 50-64; 62% said they do not like communicating about their health by computer (University of Michigan National Poll on Healthy Aging, 2018).[218]
- 48% of US adults aged 65 and older said 'When I get a new electronic device, I usually need someone else to set it up or show me how to use it' describes them very well, and 25% somewhat well (Pew Research Center, 2017).[207]
- 26% of US internet users aged 65 and older felt very confident using computers, smartphones or other devices to do what they need online in 2015; 34% felt only a little (23%) or not at all (11%) confident (Pew Research Center, 2017).[207]
- 77% of US adults aged 65 and older said they would need someone to help them learn to use a new device such as a tablet or smartphone, and only 18% felt comfortable learning on their own (Pew Research Center, 2014).[210]
| Country | Share of 65-74 | Scope | Source |
|---|---|---|---|
| Ireland | 69.6% | Individuals aged 65-74 in Ireland with basic or above basic overall digital skills · 2025 | [219] |
| Netherlands | 68.5% | Individuals aged 65-74 in the Netherlands with basic or above basic overall digital skills · 2025 | [220] |
| France | 41.9% | Individuals aged 65-74 in France with basic or above basic overall digital skills · 2025 | [221] |
| Germany | 41.2% | Individuals aged 65-74 in Germany with basic or above basic overall digital skills · 2025 | [222] |
| Spain | 34.3% | Individuals aged 65-74 in Spain with basic or above basic overall digital skills · 2025 | [223] |
| Italy | 27.4% | Individuals aged 65-74 in Italy with basic or above basic overall digital skills · 2025 | [224] |
| Poland | 12.3% | Individuals aged 65-74 in Poland with basic or above basic overall digital skills · 2025 | [225] |
| Romania | 7.3% | Individuals aged 65-74 in Romania with basic or above basic overall digital skills · 2025 | [226] |
10 / Devices
Which devices do seniors use, and do they still have a landline?
63.4% of US adults aged 65 and older were wireless-only in July-December 2025 (they had their own cell phone and no landline at home), versus 79.2% of all adults, up from 33.2% in July-December 2019 (NCHS, National Health Interview Survey, 2026).[6]
The phone has become the main way older people go online, and the landline is fading.
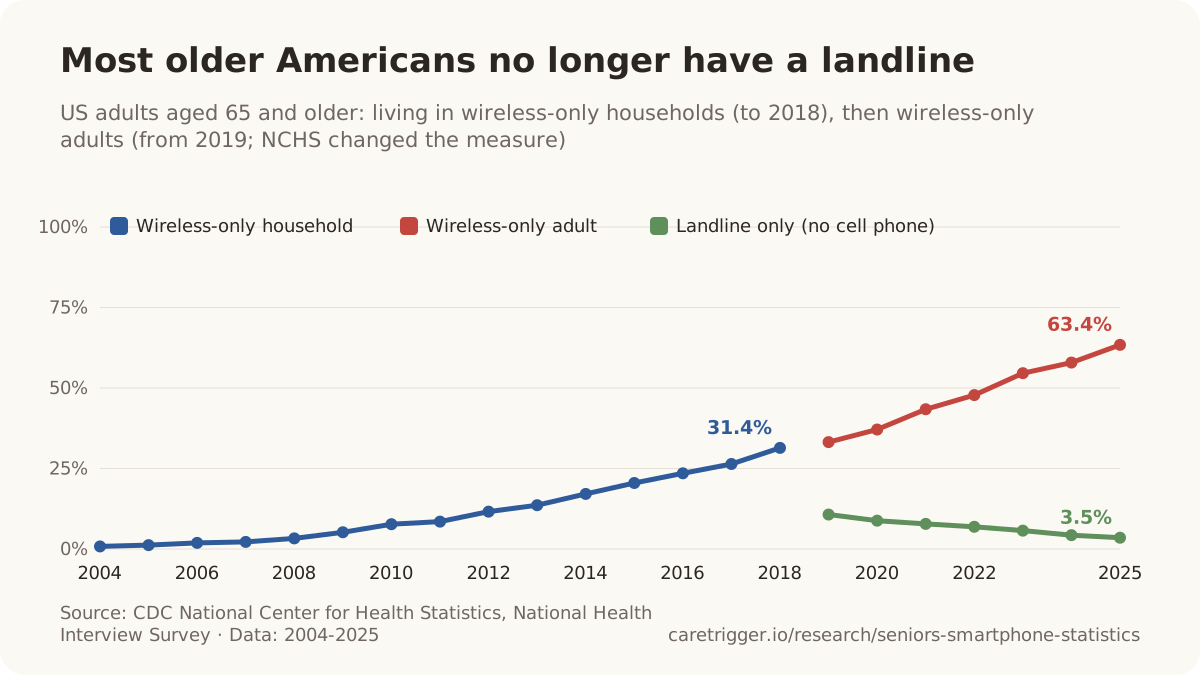
- 3.5% of US adults aged 65 and older were landline-only (no personal cell phone) in July-December 2025, versus 1.6% of all adults (NCHS, National Health Interview Survey, 2026).[6]
- 35.2% of US adults aged 65 and older still had a landline at home in July-December 2025 (wireless-mostly 16.7%, dual users 8.5%, landline-mostly 6.5%, landline-only 3.5%), versus 19.5% of all adults (NCHS, 2026).[6]
- 45% of Australians aged 75 and older made a landline call at home in the six months to June 2024, down from 58% a year earlier, versus 15% of all adults (ACMA, 2024).[194]
- 88.9% of internet users aged 65-74 in the EU-27 went online with a mobile phone or smartphone in the last 3 months in 2025, versus 95.8% of all internet users aged 16-74, up from 47.8% in 2016 (Eurostat, 2026).[227]
- 7.3% of internet users aged 65-74 in the EU-27 went online only on a desktop or laptop computer (no phone or tablet) in the last 3 months in 2025, versus 2.6% of all internet users aged 16-74, down from 40.1% in 2016 (Eurostat, 2026).[228]
- 42.2% of internet users aged 65-74 in the EU-27 went online with a laptop in the last 3 months in 2025, versus 59.5% of all internet users aged 16-74 (Eurostat, 2026).[229]
- 29.2% of internet users aged 65-74 in the EU-27 went online with a tablet in the last 3 months in 2025, versus 33.5% of all internet users aged 16-74 (Eurostat, 2026).[230]
- 28.2% of internet users aged 65-74 in the EU-27 went online with a desktop computer in the last 3 months in 2025, versus 32.7% of all internet users aged 16-74 (Eurostat, 2026).[231]
- 21.4% of internet users aged 65-74 in the EU-27 went online with another device (smart TV, smart speaker, game console, e-book reader or smartwatch) in the last 3 months in 2025, versus 41.2% of all internet users aged 16-74 (Eurostat, 2026).[232]
- 66% (two in three) of internet users aged 75-89 in Denmark went online with a mobile phone in 2024, and 43% used a tablet (Statistics Denmark, 2024).[77]
- 12.5% of South Koreans aged 70 and older went online with a PC in 2025, versus 70.1% with a smartphone and 2.2% with a tablet; across all aged 55+, 28.0% used a PC and 85.9% a smartphone (NIA, 2026).[217]
- 17% of US adults aged 65 and older were smartphone-only internet users in 2025 (own a smartphone, no home broadband), versus 16% of all US adults, up from 3% in 2013 (Pew Research Center, 2025).[38]
- 70% of US adults aged 65 and older said they subscribe to home broadband in 2025, up from 1% in March 2001, against 79% of adults aged 50 to 64 (Pew Research Center, 2025).[38]
- 80.7% of US households headed by someone aged 65 or older had a broadband internet subscription in 2021, against 90.1% of all households (US Census Bureau, 2024).[8]
- 87.5% of US households headed by someone aged 65 or older had at least one computing device (desktop, laptop, tablet or smartphone) in 2021, against 95.0% of all households (US Census Bureau, 2024).[8]
- 92.6% of people aged 65 and older in Nevada households had a broadband subscription in 2024, the highest share of any state, followed by Alaska (92.1%) and New Hampshire (91.6%) (US Census Bureau, American Community Survey, 2025).[233]
- 80.3% of people aged 65 and older in Mississippi households had a broadband subscription in 2024, the lowest share of any state, followed by West Virginia (81.3%) and North Dakota (82.5%) (US Census Bureau, American Community Survey, 2025).[233]
- 75.6% of people aged 65 and over in Taiwan lived in a household with internet access in 2025, up from 63.3% in 2023, while only 63.3% used the internet themselves (Ministry of Digital Affairs, 2026).[73]
- 51.8% of people aged 70 and over in Taiwan had a mobile phone number able to go online over 4G or 5G in 2025, against 80.1% of those aged 60-69 and 100% of those aged 18-29 (Taiwan Network Information Center, 2025).[105]
- 75.9% of community-dwelling Medicare beneficiaries aged 65 and older owned a cell phone in 2011 (Gell et al., 2015).[234]
- 63.2% of community-dwelling Medicare beneficiaries aged 65 and older had access to a computer in 2011 (Gell et al., 2015).[234]
| Period | Share of users | Scope | Source |
|---|---|---|---|
| 2016 | 47.8% | Internet users (last 3 months) aged 65-74 in the EU-27 who used the internet on a mobile phone or smartphone (unit: percentage of internet users) · European Union (EU-27) | [235] |
| 2018 | 61.6% | Internet users (last 3 months) aged 65-74 in the EU-27 who used the internet on a mobile phone or smartphone (unit: percentage of internet users) · European Union (EU-27) | [236] |
| 2021 | 76.7% | Internet users (last 3 months) aged 65-74 in the EU-27 who used the internet on a mobile phone or smartphone (unit: percentage of internet users) · European Union (EU-27) | [237] |
| 2023 | 84.3% | Internet users (last 3 months) aged 65-74 in the EU-27 who used the internet on a mobile phone or smartphone (unit: percentage of internet users) · European Union (EU-27) | [238] |
| Period | Share of 65+ | Scope | Source |
|---|---|---|---|
| 2013 | 3% | US adults aged 65+ who own a smartphone but do not use broadband at home ('smartphone dependent'); pooled surveys for the year · United States | [38] |
| 2016 | 7% | US adults aged 65+ who own a smartphone but do not use broadband at home ('smartphone dependent'); pooled surveys for the year · United States | [38] |
| 2019 | 12% | US adults aged 65+ who own a smartphone but do not use broadband at home ('smartphone dependent'); pooled surveys for the year · United States | [38] |
| 2021 | 12% | US adults aged 65+ who own a smartphone but do not use broadband at home ('smartphone dependent'); pooled surveys for the year · United States | [38] |
| 2023 | 16% | US adults aged 65+ who own a smartphone but do not use broadband at home ('smartphone dependent'); pooled surveys for the year · United States | [38] |
| Period | Share of 65+ | Scope | Source |
|---|---|---|---|
| 2015 | 67.0% | People aged 65+ living in US households (excludes group quarters such as nursing homes) whose household has a computer (incl. smartphones/tablets) and a broadband subscription of any type, incl. cellular data plans (ACS 1-year estimate) · United States | [239] |
| 2016 | 71.1% | People aged 65+ living in US households (excludes group quarters such as nursing homes) whose household has a computer (incl. smartphones/tablets) and a broadband subscription of any type, incl. cellular data plans (ACS 1-year estimate) · United States | [240] |
| 2017 | 74.0% | People aged 65+ living in US households (excludes group quarters such as nursing homes) whose household has a computer (incl. smartphones/tablets) and a broadband subscription of any type, incl. cellular data plans (ACS 1-year estimate) · United States | [241] |
| 2018 | 76.1% | People aged 65+ living in US households (excludes group quarters such as nursing homes) whose household has a computer (incl. smartphones/tablets) and a broadband subscription of any type, incl. cellular data plans (ACS 1-year estimate) · United States | [242] |
| 2019 | 78.0% | People aged 65+ living in US households (excludes group quarters such as nursing homes) whose household has a computer (incl. smartphones/tablets) and a broadband subscription of any type, incl. cellular data plans (ACS 1-year estimate) · United States | [243] |
| 2021 | 83.1% | People aged 65+ living in US households (excludes group quarters such as nursing homes) whose household has a computer (incl. smartphones/tablets) and a broadband subscription of any type, incl. cellular data plans (ACS 1-year estimate) · United States | [244] |
| 2022 | 84.8% | People aged 65+ living in US households (excludes group quarters such as nursing homes) whose household has a computer (incl. smartphones/tablets) and a broadband subscription of any type, incl. cellular data plans (ACS 1-year estimate) · United States | [245] |
| 2023 | 86.5% | People aged 65+ living in US households (excludes group quarters such as nursing homes) whose household has a computer (incl. smartphones/tablets) and a broadband subscription of any type, incl. cellular data plans (ACS 1-year estimate) · United States | [246] |
Basic phones
- 27% of UK adults aged 75 and over used a mobile phone that was not a smartphone in autumn 2025 (Ofcom Adults' Media Literacy Tracker, 2026).[28]
- 17% of UK adults aged 75 and over did not use a mobile phone at all in autumn 2025 (Ofcom Adults' Media Literacy Tracker, 2026).[28]
- 84% of UK adults aged 65-74 used a smartphone in autumn 2025 (Ofcom Adults' Media Literacy Tracker, 2026).[28]
- 17% of UK adults aged 75 and over used a mobile phone but not a smartphone in 2026 (derived from Ofcom Technology Tracker, 2026).[11]
- 89% of UK adults aged 75 and over personally used a mobile phone of any kind in 2026 (Ofcom Technology Tracker, 2026).[11]
- 87% of UK adults aged 75 and over personally used a mobile phone of any kind in 2025 (Ofcom Technology Tracker, 2025).[51]
- 16% of US adults aged 50 and older owned a regular (non-smart) cell phone in 2025, down from 57% in 2016 (AARP Research, 2025).[37]
- 34% of US adults aged 70 and older owned a regular (feature) phone in November 2017, against 14% of those aged 50 to 59 (AARP Research, 2017).[88]
- 80 of 120 frail older people living alone in deprived areas of three Italian regions used a basic mobile phone as their main communication device in 2019 interviews, 21 a smartphone and 19 only a landline; several could not reach their phone after a fall (Socci et al., 2022).[247]
Tablets, smartwatches and speakers
- 44% of US adults aged 65 and older owned a tablet computer in 2021, versus 61% of adults aged 30-49 and 53% of those aged 50-64 (Pew Research Center, 2022).[25]
- 24% of US adults aged 65 and older had a smartwatch such as an Apple Watch or Google Pixel Watch in 2026, versus 37% of all US adults (Pew Research Center, 2026).[189]
- 24% of US adults aged 65 and older had a smart speaker with AI features in 2026, versus 35% of all US adults (Pew Research Center, 2026).[189]
- 36% of US adults aged 50+ own a wearable device (2025), up from 11% in 2016; wearables are the one device category still owned more by adults 18-49.[37]
- 23% of Australians aged 75 and older had an internet-connected wearable device in 2024, up from 13% in 2023, versus 37% of all adults (ACMA, 2024).[195]
- 14.3% of US adults aged 65 and older used an internet-connected wearable device such as a smartwatch or fitness band in November 2023, versus 22.7% of all adults aged 15+ (NTIA, 2024).[26]
- 36% of US Baby Boomers (ages 65-74) own a smartwatch or connected health device (2024), versus 66% of Millennials.[248]
- 57% of UK smartphone users aged 65 and older had an Android phone as their main phone in 2025 and 41% an iPhone; across all users aged 16 and older, 54% used an iPhone (Ofcom, 2025).[4]
11 / Health
Is using a smartphone good for older adults' health, memory or loneliness?
An odds ratio of 0.42 for cognitive impairment (95% CI 0.35-0.52) was associated with digital technology use among adults over 50, in a meta-analysis of 57 observational studies covering 411,430 people with a mean baseline age of 68.7 (Benge and Scullin, Nature Human Behaviour, 2025).[249]
Large studies find that older adults who use digital technology are less likely to develop cognitive impairment, dementia or depression, but these are associations: healthier and better-educated people are also more likely to go online. Trials that gave older people video calls or other digital tools found little or no effect on loneliness.
- A hazard ratio of 0.74 for cognitive decline over time (95% CI 0.66-0.84) was associated with digital technology use among adults over 50, in the same 57-study meta-analysis (Benge and Scullin, Nature Human Behaviour, 2025).[249]
- A hazard ratio of 0.57 for dementia (95% CI 0.46-0.71), about half the risk, was associated with regular internet use among 18,154 dementia-free US adults aged 50 to 64.9 followed for a median 7.9 years in the Health and Retirement Study (Cho et al., Journal of the American Geriatrics Society, 2023).[250]
- A 40% lower risk of dementia over about ten years (hazard ratio 0.60, 95% CI 0.42-0.85) was associated with internet use among 8,238 dementia-free adults aged 50 and over in the English Longitudinal Study of Ageing (d'Orsi et al., Aging & Mental Health, 2018).[251]
- A hazard ratio of 0.62 for a dementia diagnosis (95% CI 0.47-0.81) was associated with computer use among 5,506 community-dwelling men aged 69 to 87 in Western Australia followed for up to 8.5 years (Almeida et al., PLOS ONE, 2012).[252]
- A hazard ratio of 0.85 for dementia (95% CI 0.81-0.90) was associated with leisure time spent using a computer among 146,651 UK Biobank participants aged 60 and over followed for a mean 11.9 years, while TV time carried a higher risk (Raichlen et al., PNAS, 2022).[253]
- A subdistribution hazard ratio of 0.67 for death (95% CI 0.52-0.86) was found for internet users compared with the digitally excluded among 104,422 adults aged 50 and over in cohorts from China, Mexico, the United States and Europe (Ren et al., Globalization and Health, 2023).[254]
- An odds ratio of 0.676 for depression (95% CI 0.613-0.745) was associated with digital smart device use among older adults, in a three-level meta-analysis of observational studies published 2014-2025 (Gu et al., BMC Public Health, 2026).[255]
- A pooled average marginal effect of -0.09 on depressive symptoms (95% CI -0.12 to -0.07) was associated with internet use among 87,559 adults aged 50 and over in 23 countries, alongside higher life satisfaction and better self-rated health (Luo, Yip and Zhang, Nature Human Behaviour, 2025).[256]
- A one-third (about 33%) lower probability of a depressed state was associated with internet use among 3,075 retired US adults followed over four Health and Retirement Study waves (2002-2008), with the largest reduction among people living alone (Cotten et al., Journals of Gerontology Series B, 2014).[257]
- Odds ratios of 1.13 to 1.55 for depressive symptoms were found among adults aged 60 and over who did not use the internet, across five national cohorts in 32 countries (US 1.13, England 1.22, continental Europe 1.55, China 1.49, Mexico 1.48; 129,847 people, 2010-2020) (Yan et al., eClinicalMedicine, 2024).[258]
- 60% higher odds of depression (pooled odds ratio 1.60, 95% CI 1.39-1.84) were found among socially isolated or digitally excluded older adults, pooling analyses of about 111,784 participants (Byeon, Medicine, 2026).[259]
- An odds ratio of 1.03 (95% CI 0.92-1.15), not statistically significant, linked social isolation or digital exclusion with cognitive decline in three pooled longitudinal cohorts of community-dwelling older adults (Byeon, Medicine, 2026).[259]
- 6.9% of older adults who used video chat had depressive symptoms two years later, about half the 13.1% among those who used no communication technology, in a nationally representative US cohort of 1,424 adults (mean age 64.8); email, social media and instant messaging showed no such link (Teo et al., American Journal of Geriatric Psychiatry, 2019).[260]
- 11.5% of adults aged 50 and over who saw their children, other family and friends in person only every few months or less had clinically significant depressive symptoms two years later, versus 8.1% with monthly in-person contact; how often they talked by phone or wrote did not predict depression (Teo et al., Journal of the American Geriatrics Society, 2015).[261]
- Loneliness scores 0.060 points lower on a 0-2 scale over eight years were associated with internet use among older adults in the US Health and Retirement Study (2006-2014), with 0.025 points of that running through more contact with family and friends (Yu, Wu and Chi, Journals of Gerontology Series B, 2021).[262]
- A mean difference of -0.44 points on the 20-80 UCLA Loneliness Scale at three months (95% CI -3.28 to 2.41): video-call interventions made little to no difference to loneliness compared with usual care in three trials with 201 older nursing-home residents, and the evidence is very uncertain (Noone et al., Cochrane Database of Systematic Reviews, 2020).[263]
- A standardised mean difference of 0.02 (95% CI -0.36 to 0.40) at three months showed no significant effect of digital technology interventions on loneliness compared with usual care, pooling trials with older adults whose average age was 73 to 78 (Shah et al., Journal of Medical Internet Research, 2021).[264]
Associations, not proof. Cohort studies compare people who chose to go online with people who did not, and they adjust for what they can measure. People who are healthier, wealthier and better educated are more likely to use technology and to stay well, so these studies cannot show that a smartphone protects memory or mood. The randomised trials, which can show cause and effect, are small and found little change in loneliness.
Telehealth
- 43.3% of US adults aged 65 and over had a medical appointment by video or phone in the past 12 months in 2021, the highest of any age group (all adults 37.0%; ages 18-29 29.4%) (NCHS, National Health Interview Survey, 2022).[265]
- 30.6% of US adults aged 65 and older used telemedicine (a medical appointment by video or phone) in the past 12 months in 2022, down from 43.3% in 2021 (all adults 30.1%) (NCHS, National Health Statistics Reports No. 205, 2024).[266]
- 22.9% of telehealth-eligible Medicare fee-for-service beneficiaries aged 85 and over used telehealth at least once in 2025, down from 48.0% in 2020 (65-74: 21.5%; 75-84: 22.5%; all beneficiaries 23.3%) (CMS, Medicare Telehealth Trends, 2026).[267]
- 4% of US adults aged 50 to 80 reported having had a telehealth visit in the past year in 2019, before the pandemic (University of Michigan National Poll on Healthy Aging; Innovation in Aging, 2024).[268]
- 26% of US adults aged 50 to 80 had a telehealth visit between March and June 2020, up from 4% who reported one in the past year in 2019 (University of Michigan National Poll on Healthy Aging, June 2020, n=2,074; Innovation in Aging, 2021).[269]
- 38% of US adults aged 65 and older, about 13 million people, were not ready for video doctor visits in 2018, mostly because of inexperience with technology; 32% (10.8 million) would still be unready even with help from family or friends (Lam et al., JAMA Internal Medicine, 2020).[270]
- 72% of US adults aged 85 and older were not ready for video doctor visits in 2018, versus 44% of those aged 75-84 and 25% of those aged 65-74 (Lam et al., JAMA Internal Medicine, 2020).[270]
- 20% of US adults aged 65 and older (about 6.7 million) were unready even for telephone doctor visits in 2018 because of difficulty hearing, difficulty communicating or dementia (Lam et al., JAMA Internal Medicine, 2020).[270]
- 49% of US adults aged 65-80 had set up a patient portal with their health provider in March 2018, versus 52% of those aged 50-64 (University of Michigan National Poll on Healthy Aging, 2018).[218]
| Period | Share of 85+ | Scope | Source |
|---|---|---|---|
| 2020 | 48.0% | Medicare fee-for-service beneficiaries aged 85+ eligible for telehealth (Part B enrolled); share with at least one telehealth service in the calendar year · United States | [267] |
| 2021 | 33.4% | Medicare fee-for-service beneficiaries aged 85+ eligible for telehealth (Part B enrolled); share with at least one telehealth service in the calendar year · United States | [267] |
| 2022 | 28.0% | Medicare fee-for-service beneficiaries aged 85+ eligible for telehealth (Part B enrolled); share with at least one telehealth service in the calendar year · United States | [267] |
| 2023 | 24.0% | Medicare fee-for-service beneficiaries aged 85+ eligible for telehealth (Part B enrolled); share with at least one telehealth service in the calendar year · United States | [267] |
| 2024 | 24.0% | Medicare fee-for-service beneficiaries aged 85+ eligible for telehealth (Part B enrolled); share with at least one telehealth service in the calendar year · United States | [267] |
Staying in touch
- 86.6% of US adults aged 70 and older talked by phone at least weekly with family or friends who did not live with them during the COVID-19 pandemic, little changed from 89.2% before it (National Health and Aging Trends Study; Freedman et al., Journals of Gerontology Series B, 2022).[271]
- 26.0% of US adults aged 70 and older had a video call with family or friends outside their home at least weekly during the COVID-19 pandemic, up from 21.4% before it (National Health and Aging Trends Study; Freedman et al., Journals of Gerontology Series B, 2022).[271]
- 39.0% of US adults aged 70 and older saw family or friends who did not live with them in person at least weekly during the COVID-19 pandemic, down from 60.5% before it; in residential care the share fell from 56% to 22% (Freedman et al., Journals of Gerontology Series B, 2022).[271]
12 / Getting help
Can older adults use their phones to get help?
95.1% of US adults aged 65 and older personally had a cell phone in July-December 2025 (wireless-only 63.4%, wireless-mostly 16.7%, dual users 8.5%, landline-mostly 6.5%), versus 97.1% of all adults; 3.5% were landline-only and 1.2% had no phone at all (NCHS, 2026).[6]
Almost every older adult now has a phone of their own, far more than have a personal alarm. Whether the phone is within reach when something goes wrong is another matter, and the evidence on that is thin.
- 81% of US cellphone owners aged 65 and older said they frequently carry their phone with them in 2014, the lowest of any age group, versus 90% of all cellphone owners and 95% of those aged 30-49 (Pew Research Center, 2015).[272]
- 40 of 88 frail older people living alone in Italy who had a health emergency (mostly falls) in the previous three years said they used a mobile phone to call for help, while only 3 reported using a remote alarm (IN-AGE study, 2019 interviews; Melchiorre et al., International Journal of Environmental Research and Public Health, 2022).[273]
- None of 125 people aged 65 and over who fell at home used the telephone to call for help after falling, although about half lived in homes with a telephone; one was helped only because she received an incoming call (Wild, Nayak and Isaacs, BMJ, 1981; Birmingham, UK).[274]
- Only 6% of community-dwelling adults aged 65+ with mobility or daily-living difficulties in England reported using a personal call alarm.[275]
- 9% of US adults aged 65+ currently use a medical alert system / PERS, unchanged from the same survey in 2023 (industry online-panel survey).[276]
- 6% of US adults aged 50 and older owned a home health and safety device in 2025, and 12% a GPS tracker, versus 90% who owned a smartphone (AARP, 2025).[37]
- 26% of US caregivers aged 50 and over used location detectors (GPS devices to help keep track of a loved one) in 2025, and another 26% were interested (AARP, 2026 Tech Trends and Adults 50-Plus).[37]
- 12% of US caregivers aged 50 and over used emergency response systems (physically or voice-activated systems to alert emergency care) in 2025, while 36% were interested (AARP, 2026 Tech Trends and Adults 50-Plus).[37]
- 86.9% of the 125,685 people in Scotland receiving council-funded technology-enabled care (a community alarm and/or telecare) in 2024/25 were aged 65 or older, including 37.9% aged 85 and over (Public Health Scotland, 2026).[277]
- 37% of people aged 85 and over in Scotland received a council-funded technology-enabled care package (community alarm and/or telecare) in 2022/23 (Public Health Scotland, 2024).[278]
- About 2 million people in the UK use telecare services, which depend on phone lines that are being moved from analogue to digital by January 2027 (Department of Health and Social Care and DSIT, Telecare National Action Plan, 2025).[279]
What happens to people who fall and cannot reach a phone is on our statistics page on falls and the long lie, and how long people who die alone at home can lie undiscovered is on our statistics page on people who die alone at home.
13 / Scams
How often are older adults targeted by phone scams?
$7.748 billion in losses to internet-enabled crime and fraud was reported to the FBI by people aged 60 and over in 2025, up 59% from 2024, from 201,266 complaints (up 37%) (FBI Internet Crime Complaint Center, 2025 IC3 Annual Report).[7]
Losses reported by older people have risen fast, and a phone call remains the costliest way for a scam to begin. Most attempts fail, though: most fraud reports from older adults involve no loss, and in England and Wales the oldest adults are less likely than average to be victims.
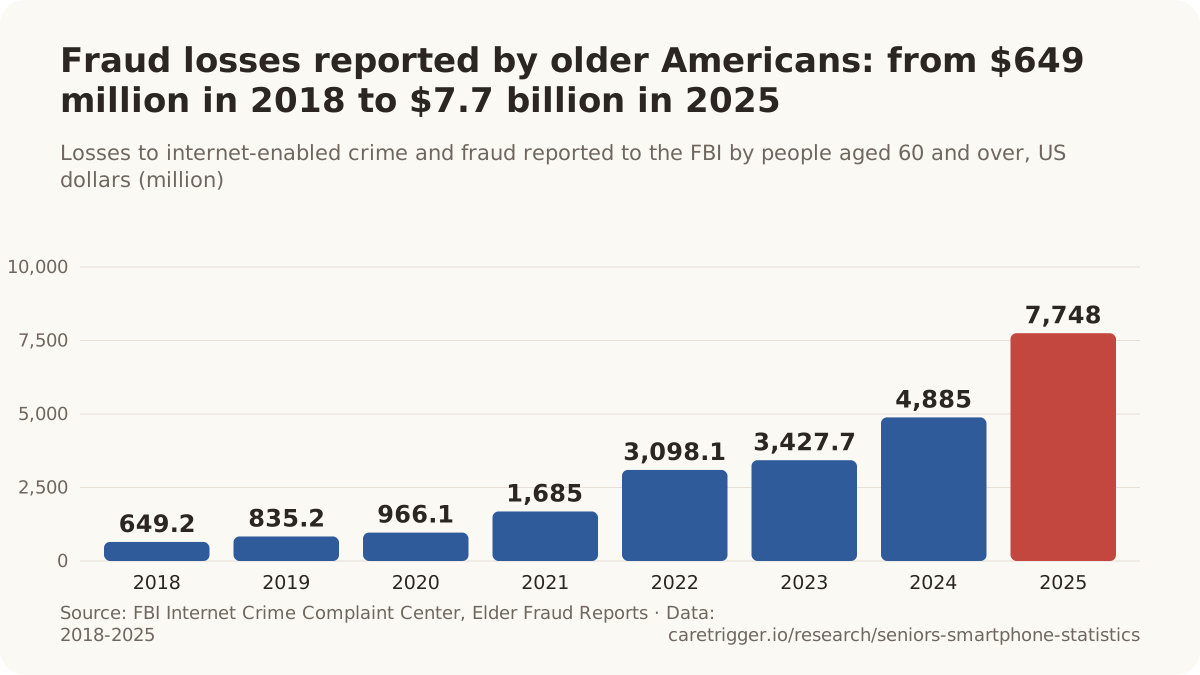
- 41% of adults aged 60 and over who lost $10,000 or more to a business or government impersonation scam in 2024 said it began with a phone call; 15% said an online ad or pop-up and 13% an email (FTC Data Spotlight, 2025).[280]
- $2,210 was the median loss reported by adults aged 60 and over for frauds that began with a phone call in 2024, versus $650 for frauds that began on social media (Federal Trade Commission, 2025).[281]
- Losses reported by adults aged 60 and over to scams that began with a text message rose more than eightfold between 2020 and 2024, and losses to scams that began on social media nearly ninefold (Federal Trade Commission, 2025).[281]
- $1,650 was the median fraud loss reported by people aged 80 and over who lost money in 2024, the highest of any age band ($1,000 for ages 70-79, $691 for 60-69 and $417 for 20-29) (FTC Consumer Sentinel Network Data Book 2024).[282]
- $319 million in fraud losses was reported to the FTC by people aged 80 and over in 2024, about four times the $78.5 million reported in 2018 (51,713 fraud reports; median loss $1,650) (FTC Consumer Sentinel Network Data Book 2024).[282]
- 8,269 adults aged 60 and over reported losing $10,000 or more to business or government impersonation scams in 2024, more than four times the 1,790 who did in 2020 (FTC Data Spotlight, 2025).[280]
- $2.4 billion in fraud losses was reported to the FTC by adults aged 60 and over in 2024, up from about $600 million in 2020 (Federal Trade Commission, Protecting Older Consumers 2024-2025, 2025).[281]
- Up to $81.5 billion was lost to fraud by Americans aged 60 and over in 2024 once unreported cases are estimated, according to the FTC, whose most conservative estimate is $10.1 billion (Federal Trade Commission, Protecting Older Consumers 2024-2025, 2025).[281]
- Up to $61.5 billion was lost to fraud by Americans aged 60 and over in 2023 once unreported cases are estimated, according to the FTC; its conservative estimate was $7.1 billion (Federal Trade Commission, Protecting Older Consumers 2023-2024, 2024).[283]
- 68% of the fraud losses reported by adults aged 60 and over in 2024 came from the 5% of their loss reports involving more than $100,000; controlling for population, older adults were nearly twice as likely as younger adults to report a six-figure loss (Federal Trade Commission, 2025).[281]
- 5,125 adults aged 60 and over reported losing more than $100,000 to fraud in 2024, up 351% from 1,136 in 2020 (Federal Trade Commission, Protecting Older Consumers 2024-2025, 2025).[281]
- $445 million was lost in 2024 by adults aged 60 and over who reported losing more than $100,000 each to impersonation scams, eight times the $55 million in 2020 (Federal Trade Commission, 2025).[284]
- 33% of adults aged 60 and over who lost $10,000 or more to a business or government impersonation scam in 2024 paid in cryptocurrency, followed by bank transfer (20%) and cash (16%) (FTC Data Spotlight, 2025).[280]
- Adults aged 60 and over were 400% (five times) more likely than younger adults to report losing money to a tech support scam in 2024, and 172% (nearly three times) more likely for prize, sweepstakes or lottery scams, after controlling for population size (Federal Trade Commission, 2025).[281]
- $1,180 million in fraud losses was reported to the FTC by people aged 60-69 in 2024, more than any other age band; people aged 70-79 reported $887 million and those 80 and over $319 million (FTC Consumer Sentinel Network Data Book 2024).[282]
- 21% of fraud reports filed by people aged 80 and over in 2024 involved a money loss, versus 24% for ages 70-79, 29% for 60-69 and 44% for 20-29 (FTC Consumer Sentinel Network Data Book 2024).[282]
- 15.8% of fraud reports for people aged 80 and over in 2024 were filed by someone else on their behalf, such as an adult child, spouse or caretaker, far more than for any other age group (5.7% for ages 70-79, 3.7% for 60-69) (Federal Trade Commission, 2025).[281]
- 74% of fraud reports filed by adults aged 60 and over in 2024 involved no money loss: they were reports of scams people spotted (Federal Trade Commission, 2025).[281]
- About two-thirds (66%) of the $389 million lost through cryptocurrency ATMs or kiosks in complaints to the FBI in 2025 was reported by people aged 60 and over ($257.5 million from 6,188 of 13,460 complaints) (FBI Internet Crime Complaint Center, 2025 IC3 Annual Report; share calculated).[7]
- 12,444 people aged 60 and over reported losing more than $100,000 each in complaints to the FBI in 2025, and the average loss per complaint from this age group was $38,500 (FBI Internet Crime Complaint Center, 2025 IC3 Annual Report).[7]
- 48,064 complaints from people aged 60 and over to the FBI in 2025 concerned phishing or spoofing, the most common type, ahead of tech or customer support scams (21,333) and investment fraud (16,926) (FBI Internet Crime Complaint Center, 2025 IC3 Annual Report).[7]
- $3.52 billion of the losses reported to the FBI by people aged 60 and over in 2025 came from investment fraud, followed by tech or customer support scams ($1.04 billion) and confidence or romance scams ($584 million) (FBI Internet Crime Complaint Center, 2025 IC3 Annual Report).[7]
- $27 billion in suspicious activity linked to elder financial exploitation was reported by US financial institutions in 155,415 filings between June 2022 and June 2023, including attempted transactions; scams accounted for about 80% of the reported activity (FinCEN, 2024).[285]
- 57% of US adults aged 50 and over who do not fully trust AI said they worry about AI scams, such as fake phone calls that sound like a real family member (AARP, 2026 Tech Trends and Adults 50-Plus).[37]
| Period | Reported losses | Scope | Source |
|---|---|---|---|
| 2018 | $78.5 million | Consumer Sentinel fraud reports from people aged 80+ (reports that include age) · United States | [286] |
| 2019 | $72 million | Consumer Sentinel fraud reports from people aged 80+ (reports that include age) · United States | [287] |
| 2020 | $105 million | Consumer Sentinel fraud reports from people aged 80+ (reports that include age) · United States | [288] |
| 2021 | $149 million | Consumer Sentinel fraud reports from people aged 80+ (reports that include age) · United States | [289] |
| 2022 | $206 million | Consumer Sentinel fraud reports from people aged 80+ (reports that include age) · United States | [290] |
| 2023 | $244 million | Consumer Sentinel fraud reports from people aged 80+ (reports that include age) · United States | [291] |
| Period | Reports | Scope | Source |
|---|---|---|---|
| 2020 | 1,790 reports | Consumer Sentinel reports by people aged 60+ of losses of $10,000+ to business or government impersonators · United States | [280] |
| 2021 | 3,516 reports | Consumer Sentinel reports by people aged 60+ of losses of $10,000+ to business or government impersonators · United States | [280] |
| 2022 | 5,559 reports | Consumer Sentinel reports by people aged 60+ of losses of $10,000+ to business or government impersonators · United States | [280] |
| 2023 | 7,091 reports | Consumer Sentinel reports by people aged 60+ of losses of $10,000+ to business or government impersonators · United States | [280] |
| Country and measure (year) | Figure | Scope | Source |
|---|---|---|---|
| Japan: special-fraud losses of victims aged 65+ (2025) | ¥84.11 billion | recognised special-fraud cases with victims aged 65+ (police-recorded) · Japan · 2025 | [292] |
| Japan: share of special-fraud cases with victims aged 65+ (2025) | 51.3% | recognised special-fraud cases, share with victims aged 65+ (denominator excludes corporate victims) · Japan · 2025 | [292] |
| South Korea: share of voice-phishing losses suffered by people 60+ (2023) | 36.4% | voice-phishing losses by victim age, based on damage-relief applications (first account), individuals only · South Korea · 2023 | [293] |
| Australia: scam losses reported by people 65+ (2025) | A$88.8 million | Scamwatch reports from people aged 65+ · Australia · 2025 | [294] |
| Australia: median scam loss, people 65+ (2025) | A$716 | Scamwatch reports with loss from people aged 65+ · Australia · 2025 | [294] |
| Canada: share of reported fraud losses, people 60+ (2024) | 27.9% | processed fraud reports to the CAFC, losses by victims aged 60+ · Canada · 2024 | [295] |
| England and Wales: victims of fraud in the past year, 75+ (to March 2025) | 5.4% | adults aged 75+ (household survey; CSEW, accredited official statistics) · England and Wales · year ending March 2025 | [296] |
- 75.6% of voice-phishing victims aged 60 and over in South Korea in 2023 (3,000 people) were caught by messenger phishing, in which scammers text pretending to be a family member or acquaintance (Financial Supervisory Service, 2024).[293]
- A$99.6 million was reported lost to scams by Australians aged 65 and over in 2024, the most of any age group and 31.3% of all Scamwatch losses (National Anti-Scam Centre, 2025).[300]
- A$121.0 million was reported lost to scams by Australians aged 65 and over in 2023 (National Anti-Scam Centre, 2025).[300]
- 28.1% of adults aged 75 and over in England and Wales received a message that may have been phishing in the month before interview (year to March 2025), versus 47.2% of all adults; 2.3% of older recipients replied or clicked a link, against 1.8% overall (ONS, 2026).[296]
- An odds ratio of 4.25 for financial loss from cybercrime was found for internet users aged 75 and over compared with younger people, even though they were less likely to report any cybercrime (p = 0.037; 35,069 respondents, Crime Survey for England and Wales 2019/20) (Havers et al., PLOS ONE, 2024).[301]
14 / Data
Download the dataset
Every statistic on this page, with its verbatim source quote, locator, population, period and verification status, in one file. Each chart's CSV is linked under the chart.
Download all statistics (CSV) Download all statistics (JSON)
Charts and figures on this page may be reused with a link to https://caretrigger.io/research/seniors-smartphone-statistics as the source. Each chart's CSV is published next to it.
15 / Methodology
Methodology
What we included. Published figures on smartphone, mobile phone and internet ownership and use among people aged 50 and over, with the age band and the measure named for every figure: owning a smartphone, using one, going online with a phone, any mobile phone, household access, or internet use. Official statistics (national statistics offices, communications regulators, health and social ministries) and large surveys that publish their methods are preferred; peer-reviewed studies are used for health; official agencies for fraud. Industry surveys are included only where nothing better exists, and the dataset labels them. Pseudo-cohort comparisons and a few gaps between age bands are derived from published figures in the same survey, and say so.
How each figure was verified. Every record carries the exact sentence or table cell from the source (quote) and where it sits (locator). A researcher confirmed each one against the source document, reading statistical tables through the publishers' own data services and downloading PDFs and spreadsheets rather than reading web summaries of them; a script then re-fetched every source on the date shown at the top of the page, using publisher APIs and PDF text where the web page blocks automated access, and checked for the quote. Records the script could not confirm are kept only if the researcher's check was complete, and are marked for human review in the dataset. Where the same figure was captured twice, one record is kept and the other marked as superseded.
What we excluded. Figures we could not trace to a document, roundup pages that cite each other rather than a source, and the widely copied claims described in the "Numbers we will not publish" note in the first section. Series that changed their questions are not joined across the change: Japan's 2019 internet figures and 2020 smartphone figures, and Australia's figures before and after 2020, are shown separately.
Rounding and derivation. Numbers are reproduced as published; where a statistics office publishes two decimals, statements give one, and the dataset keeps both. Derived figures (a gap between two age bands, a pseudo-cohort change, a share computed from two published counts) say so in the statement and name the inputs. The bold figure in each statement is a reading aid, not an edit.
Updates. Sources are re-checked and new figures added quarterly, timed to the releases that matter here: Pew's fact sheets (late in the year), AARP's technology trends (around the turn of the year), Eurostat's survey (December), Ofcom (spring), Japan's communications survey (late May) and the US National Health Interview Survey (twice a year). The next scheduled refresh is January 2027. Corrections are welcome through the support page.
Cite this page
CareTrigger. "Statistics on Smartphone Use Among Seniors: How Many, by Age and Country, and Who Is Still Offline." https://caretrigger.io/research/seniors-smartphone-statistics. Last updated 2026-10-12.
16 / FAQ
Frequently asked questions
What percentage of seniors have a smartphone?
In the United States, 78% of adults aged 65 and older own a smartphone and 95% own a cellphone of some kind (Pew Research Center, 2025). Ownership falls with age: among Medicare beneficiaries living in the community, 91.3% of those aged 65 to 74 own one, 84.2% of those aged 75 to 84 and 61.8% of those aged 85 and older (2025). The often-quoted 90% is AARP's figure for adults aged 50 and older.[1][1][69][69][69][24]
Is smartphone use among seniors growing?
Yes. Smartphone ownership among Americans aged 65 and older rose from 11% in 2011 to 78% in 2025, and in the EU the share of people aged 65 to 74 who go online on a phone rose from 21.7% in 2016 to 70.3% in 2025. Two things drive it: the generation now turning 65 already owns smartphones (90% of Americans aged 50 to 64 do), and people keep taking them up after 60. In Japan, the generation that was in its 60s in 2015 went from 28.4% to 68.1% ownership by its 70s.[302][1][2][1][3]
How many people over 80 have a smartphone?
Far fewer than younger seniors. In Japan, 33.0% of people aged 80 and over owned a smartphone in 2025, and 21.0% owned no mobile phone of any kind. In South Korea, 55.0% of people aged 80 to 84 and 29.4% of those aged 90 and over owned one in 2023. In the US, 61.8% of Medicare beneficiaries aged 85 and older did in 2025. Pew's often-quoted 17% for Americans aged 80 and over dates from 2016.[3][3][80][80][69][84]
Why do AARP and Pew give different numbers for seniors and smartphones?
They measure different age groups. AARP's 90% (2025) covers adults aged 50 and older; Pew's 78% covers adults aged 65 and older, and Pew finds 90% among those aged 50 to 64. Surveys also differ in whether they ask about owning or using a phone, in how they reach people (Pew moved from telephone to web and mail surveys in 2023), and in who runs them: Japan's government survey finds 68.1% of people in their 70s own a smartphone, an industry survey 86%.[24][1][1][3][27]
Which countries' older people use the internet most?
Among people aged 65 to 74 in Europe, 99.9% in Denmark had used the internet in the last three months in 2025, against 51.9% in Greece and an EU average of 79.0%. Going online by phone at that age ranges from 95.2% in Norway to 45.6% in Greece. Among people aged 75 and over, the OECD's latest figures range from 95.2% in Norway to 19.4% in Egypt.[32][32][32][2][2][89][89]
Do older people who live alone have smartphones?
Less often than those who live with someone. In Japan, 61.2% of people aged 60 and over who live alone owned a smartphone in 2025, against 78.1% of those living with a spouse. In South Korea, 68.1% of people aged 65 and over who live alone did in 2023, against 83.0% in older-couple households. In the US, 60.9% of people aged 72 and older who live alone went online in 2023, against 80.3% of those living with a spouse only.[5][80][81]
How many seniors still use a basic or flip phone?
In the US, 16% of adults aged 65 and older own a cellphone that is not a smartphone (Pew Research Center, 2025). In Japan, 26.5% of people aged 80 and over had a basic mobile phone in 2025, almost as many as the 33.0% with a smartphone. In the UK, 27% of adults aged 75 and over used a basic mobile phone in autumn 2025, and 17% used no mobile phone at all.[1][192][28][28]
Which sources should I cite for smartphone statistics on older adults?
For the United States: Pew Research Center for adults aged 65 and over, year by year; the CMS Medicare Current Beneficiary Survey for age bands up to 85 and over; and the National Health and Aging Trends Study for ages 72 to 90 and over and for people living alone. For Europe: Eurostat's ICT survey (ages 65 to 74, and 75 to 89 in some countries) and Ofcom for the UK. For Asia: Japan's Ministry of Internal Affairs and Communications and Korea's Ministry of Science and ICT. Give the age band and the measure (own, use, or go online by phone) with every figure.[1][69][81][32][11][3][60]
17 / Sources
Sources
Numbered in order of first appearance. Each entry lists the record ids it supports; the dataset carries the verbatim quote for each.
- [1]Pew Research Center. Mobile Fact Sheet (Demographics of Mobile Device Ownership and Adoption in the United States); also short read 'Internet use, smartphone ownership, digital divides in the US: What we know' (McClain C, Bishop W, 2026-01-08). Published 2025-11-20. Accessed 2026-10-08.Used for: pew-2025-smartphone-ownership-65plus-78pct, us-pew-2025-smartphone-50-64, pew-2025-cellphone-any-kind-65plus-95pct, us-pew-2025-cellphone-not-smartphone-65plus
- [2]Eurostat. Individuals - devices used to access the internet (isoc_ci_dev_i), Eurostat survey on ICT usage in households and by individuals. Published 2026-04-17. Accessed 2026-10-11.Used for: eu-eurostat-2025-mobile-phone-internet-65-74, eu-eurostat-2025-mobile-phone-internet-55-64, eu-eurostat-2025-mobile-phone-internet-16-74, eu-eurostat-2025-mobile-phone-internet-75-89, no-eurostat-2025-mobile-phone-internet-65-74, ch-eurostat-2025-mobile-phone-internet-65-74, nl-eurostat-2025-mobile-phone-internet-65-74, ie-eurostat-2025-mobile-phone-internet-65-74, se-eurostat-2025-mobile-phone-internet-65-74, xk-eurostat-2025-mobile-phone-internet-65-74, dk-eurostat-2025-mobile-phone-internet-65-74, es-eurostat-2025-mobile-phone-internet-65-74, me-eurostat-2025-mobile-phone-internet-65-74, fi-eurostat-2025-mobile-phone-internet-65-74, lu-eurostat-2025-mobile-phone-internet-65-74, ro-eurostat-2025-mobile-phone-internet-65-74, be-eurostat-2025-mobile-phone-internet-65-74, mt-eurostat-2025-mobile-phone-internet-65-74, at-eurostat-2025-mobile-phone-internet-65-74, de-eurostat-2025-mobile-phone-internet-65-74, fr-eurostat-2025-mobile-phone-internet-65-74, cy-eurostat-2025-mobile-phone-internet-65-74, lv-eurostat-2025-mobile-phone-internet-65-74, it-eurostat-2025-mobile-phone-internet-65-74, si-eurostat-2025-mobile-phone-internet-65-74, mk-eurostat-2025-mobile-phone-internet-65-74, hu-eurostat-2025-mobile-phone-internet-65-74, al-eurostat-2025-mobile-phone-internet-65-74, rs-eurostat-2025-mobile-phone-internet-65-74, ba-eurostat-2025-mobile-phone-internet-65-74, cz-eurostat-2025-mobile-phone-internet-65-74, pt-eurostat-2025-mobile-phone-internet-65-74, lt-eurostat-2025-mobile-phone-internet-65-74, bg-eurostat-2025-mobile-phone-internet-65-74, pl-eurostat-2025-mobile-phone-internet-65-74, sk-eurostat-2025-mobile-phone-internet-65-74, ee-eurostat-2025-mobile-phone-internet-65-74, tr-eurostat-2025-mobile-phone-internet-65-74, hr-eurostat-2025-mobile-phone-internet-65-74, gr-eurostat-2025-mobile-phone-internet-65-74, eu-eurostat-2016-mobile-phone-internet-65-74, eu-eurostat-2018-mobile-phone-internet-65-74, eu-eurostat-2021-mobile-phone-internet-65-74, eu-eurostat-2023-mobile-phone-internet-65-74, eu-eurostat-2016-mobile-phone-internet-16-74, eu-eurostat-2016-mobile-phone-internet-55-64, eu-eurostat-2018-mobile-phone-internet-55-64, eu-eurostat-2021-mobile-phone-internet-55-64, eu-eurostat-2023-mobile-phone-internet-55-64
- [3]Ministry of Internal Affairs and Communications, Japan (総務省). 令和7年通信利用動向調査 世帯構成員編 表番号24 問7(1) 保有するモバイル端末. Published 2026-05-29. Accessed 2026-10-11.Used for: jp-mic-2025-smartphone-ownership-70-79, jp-mic-2025-smartphone-ownership-65plus, jp-mic-2025-smartphone-ownership-50-59, jp-mic-2025-smartphone-ownership-60-69, jp-mic-2015-2025-pseudo-cohort-smartphone-60-69-to-70-79, jp-mic-2015-2025-pseudo-cohort-smartphone-50-59-to-60-69, jp-mic-2025-smartphone-ownership-80plus, jp-mic-2025-smartphone-ownership-elderly-only-households, jp-mic-2025-smartphone-ownership-65plus-by-sex, jp-mic-2025-no-mobile-phone-80plus
- [4]Ofcom. Online Nation 2025 report (published 10 December 2025). Published 2025-12-10. Accessed 2026-10-11.Used for: uk-ofcom-2025-daily-time-online-65plus, uk-ofcom-2025-no-internet-reason-no-need-65plus, uk-ofcom-2025-android-main-phone-65plus
- [5]Cabinet Office, Japan (内閣府). 令和7年度 高齢社会対策総合調査(高齢者の生活と意識に関する国際比較調査)(第10回) 第5章 クロス集計表(基本軸クロス)日本 Q33. Published 2026. Accessed 2026-10-11.Used for: jp-cao-2025-smartphone-ownership-60plus-living-alone, jp-cao-2025-smartphone-ownership-65plus-75plus, jp-cao-2025-smartphone-ownership-living-alone-by-sex
- [6]National Center for Health Statistics (CDC/NCHS). Wireless Substitution: Early Release of Estimates from the National Health Interview Survey, July-December 2025. Published 2026-09-17. Accessed 2026-10-11.Used for: us-nchs-2025-wireless-only-adults-65plus, us-nchs-2025-landline-only-adults-65plus, us-nchs-2025-household-landline-65plus-derived, us-nchs-2025-own-wireless-phone-65plus-derived
- [7]Federal Bureau of Investigation, Internet Crime Complaint Center (IC3). 2025 IC3 Annual Report. Published 2026-04. Accessed 2026-10-11.Used for: us-fbi-ic3-2025-elder-fraud-losses-60plus, us-fbi-ic3-2025-crypto-atm-losses-60plus-two-thirds, us-fbi-ic3-2025-60plus-lost-over-100k-12444, us-fbi-ic3-2025-60plus-share-of-all-reported-losses-37pct, us-fbi-ic3-2025-60plus-complaints-phishing-spoofing-48064, us-fbi-ic3-2025-60plus-investment-fraud-losses-3-52-billion
- [8]US Census Bureau. Computer and Internet Use in the United States: 2021 (American Community Survey Reports ACS-56). Published 2024-06-18. Accessed 2026-10-11.Used for: us-census-acs-2021-household-smartphone-householder-65plus, us-census-acs-2021-household-broadband-householder-65plus, us-census-acs-2021-household-computer-householder-65plus
- [9]US Census Bureau. Computer and Internet Use in the United States: 2018 (American Community Survey Reports ACS-49). Published 2021-04-01. Accessed 2026-10-11.Used for: us-census-acs-2018-household-smartphone-householder-65plus
- [10]US Census Bureau. Computer and Internet Use in the United States: 2016 (American Community Survey Reports ACS-39). Published 2018-08-01. Accessed 2026-10-11.Used for: us-census-acs-2016-household-smartphone-householder-65plus
- [11]Ofcom (fieldwork by Ipsos). Ofcom Technology Tracker 2026: data tables (core). Published 2026-08-11. Accessed 2026-10-11.Used for: uk-ofcom-2026-smartphone-personal-use-65plus, uk-ofcom-2026-smartphone-personal-use-75plus, uk-ofcom-2026-smartphone-personal-use-65-74, uk-ofcom-2026-basic-mobile-only-75plus-derived, uk-ofcom-2026-mobile-phone-personal-use-75plus
- [12]Statistics Canada. Statistics Canada, Table 22-10-0143-01, Smartphone personal use and selected smartphone habits by gender and age group (Canadian Internet Use Survey). Published 2021-06-22. Accessed 2026-10-11.Used for: ca-statcan-2020-smartphone-personal-use-65plus, ca-statcan-2018-smartphone-personal-use-65plus, ca-statcan-2020-smartphone-personal-use-65plus-by-gender, ca-statcan-2020-check-smartphone-every-30-min-65plus, ca-statcan-2018-check-smartphone-every-30-min-65plus, ca-statcan-2020-smartphone-first-thing-on-waking-65plus, ca-statcan-2020-smartphone-last-thing-before-sleep-65plus
- [13]Ministry of Health and Welfare, Korea (보건복지부) / Korea Institute for Health and Social Affairs. 2023년 노인실태조사 결과 발표 (보도자료, 2024-10-17). Published 2024-10-17. Accessed 2026-10-11.Used for: kr-mohw-2023-smartphone-ownership-65plus
- [14]Census and Statistics Department, Hong Kong SAR. Thematic Household Survey Report No. 86: Internet and Personal Computer Penetration. Published 2026-06-25. Accessed 2026-10-11.Used for: hk-csd-2025-smartphone-ownership-65plus, hk-csd-2025-smartphone-ownership-55-64, hk-csd-2025-internet-use-65plus, hk-csd-2025-smartphone-owners-65plus-count, hk-csd-2024-internet-use-65plus, hk-csd-2025-smartphone-ownership-65plus-by-sex, hk-csd-2023-smartphone-ownership-65plus, hk-csd-2024-smartphone-ownership-65plus, hk-csd-2023-smartphone-ownership-55-64, hk-csd-2024-smartphone-ownership-55-64
- [15]Infocomm Media Development Authority, Singapore (IMDA). Digital Society statistics: Individuals Smartphone Ownership by Age Group, 2020 - 2025 (chart image). Published 2026-05-25. Accessed 2026-10-11.Used for: sg-imda-2025-smartphone-ownership-60plus, sg-imda-2025-smartphone-ownership-40-59, sg-imda-2025-internet-use-60plus, sg-imda-2020-internet-use-60plus, sg-imda-2021-internet-use-60plus, sg-imda-2022-internet-use-60plus, sg-imda-2023-internet-use-60plus, sg-imda-2024-internet-use-60plus, sg-imda-2023-smartphone-ownership-60plus, sg-imda-2024-smartphone-ownership-60plus, sg-imda-2020-smartphone-ownership-40-59, sg-imda-2021-smartphone-ownership-40-59, sg-imda-2022-smartphone-ownership-40-59, sg-imda-2023-smartphone-ownership-40-59, sg-imda-2024-smartphone-ownership-40-59
- [16]Statistics Finland. Statistics Finland table 13ud: Use of information and communications technology by individuals by gender and age group, 2013-2025. Published 2025-11-12. Accessed 2026-10-11.Used for: fi-statfin-2025-smartphone-65-74, fi-statfin-2025-smartphone-16-89, fi-statfin-2025-smartphone-75-89, fi-statfin-2025-internet-use-75-89, fi-statfin-2013-internet-use-75-89, fi-statfin-2013-smartphone-65-74, fi-statfin-2025-smartphone-75-89-men, fi-statfin-2025-smartphone-75-89-women, fi-statfin-2017-smartphone-75-89, fi-statfin-2018-smartphone-75-89, fi-statfin-2019-smartphone-75-89, fi-statfin-2020-smartphone-75-89, fi-statfin-2021-smartphone-75-89, fi-statfin-2022-smartphone-75-89, fi-statfin-2023-smartphone-75-89, fi-statfin-2024-smartphone-75-89
- [17]Statistics Sweden (SCB). SCB LE0108T14N2: Access to the Internet by type of device, sex and study domain, 2021-2025. Published 2025-10-17. Accessed 2026-10-11.Used for: se-scb-2025-mobile-phone-internet-65-74, se-scb-2025-mobile-phone-internet-75-84, se-scb-2025-mobile-phone-internet-85plus
- [18]Swiss Federal Statistical Office (FSO/BFS). Internetnutzungsmodalitäten und Kompetenzen (FSO PxWeb px-x-1604000000_106). Published 2026. Accessed 2026-10-11.Used for: ch-bfs-2025-smartphone-internet-60plus, ch-bfs-2025-internet-use-60plus, ch-bfs-2014-internet-use-60plus
- [19]Statistics Netherlands (CBS). CBS StatLine 84888NED. Published 2025-11-25. Accessed 2026-10-11.Used for: nl-cbs-2025-mobile-phone-internet-75plus, nl-cbs-2025-internet-use-75plus, nl-cbs-2020-mobile-phone-internet-75plus, nl-cbs-2025-never-used-internet-75plus, nl-cbs-2020-internet-use-75plus, nl-cbs-2022-internet-use-75plus, nl-cbs-2024-internet-use-75plus
- [20]Australian Communications and Media Authority (ACMA). Communications and media in Australia: How we use the internet (data tables), sheet QD5 Devices by PBI BANNER. Published 2026-02-19. Accessed 2026-10-11.Used for: au-acma-2025-mobile-phone-internet-75plus, au-acma-2025-internet-use-75plus, au-acma-2020-mobile-phone-internet-75plus, au-acma-2021-mobile-phone-internet-75plus, au-acma-2022-mobile-phone-internet-75plus, au-acma-2023-mobile-phone-internet-75plus, au-acma-2024-mobile-phone-internet-75plus, au-acma-2017-mobile-phone-internet-75plus, au-acma-2018-mobile-phone-internet-75plus, au-acma-2019-mobile-phone-internet-75plus, au-acma-2020-internet-use-75plus, au-acma-2021-internet-use-75plus, au-acma-2022-internet-use-75plus, au-acma-2023-internet-use-75plus, au-acma-2024-internet-use-75plus, au-acma-2017-internet-use-75plus, au-acma-2018-internet-use-75plus, au-acma-2019-internet-use-75plus
- [21]Cetic.br / NIC.br (Comitê Gestor da Internet no Brasil). TIC Domicílios 2025, tabelas de indivíduos (proporção), indicator J5 - Indivíduos que usaram a Internet no telefone celular nos últimos três meses. Published 2025-12-09. Accessed 2026-10-11.Used for: br-cetic-2025-internet-on-mobile-phone-60plus
- [22]Observatorio del Envejecimiento, Pontificia Universidad Católica de Chile (UC) and Confuturo. Observatorio del Envejecimiento UC-Confuturo, 'Población mayor: ¿Hacia la superación de la brecha digital?' (Año 5, v 30, 2024). Published 2024-06. Accessed 2026-10-11.Used for: cl-ucobs-2022-smartphone-ownership-60plus, cl-ucobs-2022-internet-use-60plus-by-age, cl-ucobs-2022-home-internet-older-living-alone
- [23]Afrobarometer. Afrobarometer Policy Paper No. 95, 'Africa's digital divide is closing, but participation in digitalised economy still uneven' (2025), Figure 5. Published 2025-08-23. Accessed 2026-10-11.Used for: afrobarometer-2021-2023-smartphone-ownership-56plus, afrobarometer-2021-2023-regular-internet-use-56plus
- [24]AARP Research. 2026 Tech Trends and Adults 50-Plus (DOI 10.26419/res.01020.001). Published 2025-12. Accessed 2026-10-08.Used for: aarp-2026-smartphone-ownership-50plus-90pct
- [25]Pew Research Center. Share of those 65 and older who are tech users has grown in the past decade. Published 2022-01-13. Accessed 2026-10-11.Used for: us-pew-2021-smartphone-65plus, us-pew-2021-youtube-use-65plus, us-pew-2021-social-media-use-65plus, us-pew-2021-tablet-ownership-65plus
- [26]National Telecommunications and Information Administration (NTIA), US Department of Commerce. NTIA Data Explorer, full dataset ntia-analyze-table.csv (Internet Use Survey, CPS Computer and Internet Use Supplement 1994-2023). Published 2024-06-06. Accessed 2026-10-11.Used for: us-ntia-2021-mobile-internet-phone-65plus, us-ntia-2023-mobile-internet-phone-65plus, us-ntia-2011-mobile-internet-phone-65plus, us-ntia-2013-mobile-internet-phone-65plus, us-ntia-2015-mobile-internet-phone-65plus, us-ntia-2017-mobile-internet-phone-65plus, us-ntia-2019-mobile-internet-phone-65plus, us-ntia-2023-internet-use-65plus, us-ntia-2023-texting-im-65plus-internet-users, us-ntia-2023-video-voice-calls-65plus-internet-users, us-ntia-2023-online-finance-65plus-internet-users, us-ntia-2015-texting-im-65plus-internet-users, us-ntia-2023-no-home-internet-reason-no-need-65plus, us-ntia-2023-wearable-use-65plus
- [27]NTT Docomo Mobile Society Research Institute (モバイル社会研究所). スマホの所有率はさらに上昇し60代は95%、70代は86%、80代前半でも69%(2026年3月23日). Published 2026-03-23. Accessed 2026-10-11.Used for: jp-mobaken-2026-smartphone-ownership-70-79, jp-mobaken-2026-smartphone-ownership-60-69, jp-mobaken-2026-smartphone-ownership-80-84
- [28]Ofcom. Ofcom Adults' Media Literacy Tracker 2025: data tables. Published 2026-04. Accessed 2026-10-11.Used for: uk-ofcom-amlt-2025-smartphone-75plus, uk-ofcom-amlt-2025-no-home-internet-75plus, uk-ofcom-amlt-2025-basic-mobile-75plus, uk-ofcom-amlt-2025-no-mobile-75plus, uk-ofcom-amlt-2025-smartphone-65-74
- [29]Instituto Brasileiro de Geografia e Estatística (IBGE). IBGE SIDRA Tabela 7331, Percentual de pessoas que utilizaram a Internet no período de referência dos últimos três meses na população de 10 anos ou mais de idade, por sexo e grupo de idade (PNAD Contínua, módulo TIC). Published 2026-07-02. Accessed 2026-10-11.Used for: br-ibge-2025-internet-use-60plus, br-ibge-2025-internet-use-60plus-by-sex, br-ibge-2016-internet-use-60plus, br-ibge-2017-internet-use-60plus, br-ibge-2018-internet-use-60plus, br-ibge-2019-internet-use-60plus, br-ibge-2021-internet-use-60plus, br-ibge-2022-internet-use-60plus, br-ibge-2023-internet-use-60plus, br-ibge-2024-internet-use-60plus
- [30]Cetic.br / NIC.br (Comitê Gestor da Internet no Brasil). TIC Domicílios 2025, tabelas de indivíduos (proporção), indicator C2 - Indivíduos, por último acesso à Internet. Published 2025-12-09. Accessed 2026-10-11.Used for: br-cetic-2025-internet-users-60plus, br-cetic-2025-never-used-internet-60plus
- [31]Central Statistics Office (CSO) Ireland. Internet Coverage and Usage in Ireland 2025 (CSO statistical release, 7 November 2025). Published 2025-11-07. Accessed 2026-10-11.Used for: ie-cso-2025-internet-use-75plus
- [32]Eurostat. Individuals - internet use (isoc_ci_ifp_iu), Eurostat survey on ICT usage in households and by individuals. Published 2026-04-17. Accessed 2026-10-11.Used for: ie-eurostat-2025-internet-use-75-89, eu-eurostat-2025-internet-use-65-74, eu-eurostat-2025-internet-use-55-64, eu-eurostat-2025-internet-use-16-74, eu-eurostat-2015-2025-pseudo-cohort-internet-55-64-to-65-74, eu-eurostat-2015-internet-use-gap-55-64-vs-65-74, eu-eurostat-2025-internet-use-75-89, dk-eurostat-2025-internet-use-65-74, no-eurostat-2025-internet-use-65-74, nl-eurostat-2025-internet-use-65-74, ie-eurostat-2025-internet-use-65-74, ch-eurostat-2025-internet-use-65-74, se-eurostat-2025-internet-use-65-74, lu-eurostat-2025-internet-use-65-74, fi-eurostat-2025-internet-use-65-74, xk-eurostat-2025-internet-use-65-74, be-eurostat-2025-internet-use-65-74, de-eurostat-2025-internet-use-65-74, es-eurostat-2025-internet-use-65-74, me-eurostat-2025-internet-use-65-74, fr-eurostat-2025-internet-use-65-74, at-eurostat-2025-internet-use-65-74, lv-eurostat-2025-internet-use-65-74, ro-eurostat-2025-internet-use-65-74, mt-eurostat-2025-internet-use-65-74, ee-eurostat-2025-internet-use-65-74, cz-eurostat-2025-internet-use-65-74, hu-eurostat-2025-internet-use-65-74, sk-eurostat-2025-internet-use-65-74, it-eurostat-2025-internet-use-65-74, si-eurostat-2025-internet-use-65-74, cy-eurostat-2025-internet-use-65-74, ba-eurostat-2025-internet-use-65-74, mk-eurostat-2025-internet-use-65-74, rs-eurostat-2025-internet-use-65-74, lt-eurostat-2025-internet-use-65-74, al-eurostat-2025-internet-use-65-74, pt-eurostat-2025-internet-use-65-74, bg-eurostat-2025-internet-use-65-74, pl-eurostat-2025-internet-use-65-74, hr-eurostat-2025-internet-use-65-74, tr-eurostat-2025-internet-use-65-74, gr-eurostat-2025-internet-use-65-74, nl-eurostat-2025-internet-use-75-89, se-eurostat-2025-internet-use-75-89, lv-eurostat-2025-internet-use-75-89, fi-eurostat-2025-internet-use-75-89, be-eurostat-2025-internet-use-75-89, at-eurostat-2025-internet-use-75-89, fr-eurostat-2025-internet-use-75-89, es-eurostat-2025-internet-use-75-89, hu-eurostat-2025-internet-use-75-89, cz-eurostat-2025-internet-use-75-89, cy-eurostat-2025-internet-use-75-89, si-eurostat-2025-internet-use-75-89, sk-eurostat-2025-internet-use-75-89, it-eurostat-2025-internet-use-75-89, pl-eurostat-2025-internet-use-75-89, bg-eurostat-2025-internet-use-75-89, eu-eurostat-2025-internet-use-75-89-low-education, eu-eurostat-2025-internet-use-75-89-medium-education, eu-eurostat-2025-internet-use-75-89-high-education, eu-eurostat-2025-internet-use-55-74-low-education, eu-eurostat-2025-internet-use-55-74-high-education, eu-eurostat-2025-internet-use-75-89-men, eu-eurostat-2025-internet-use-75-89-women, eu-eurostat-2025-internet-use-65-74-men, eu-eurostat-2025-internet-use-65-74-women, eu-eurostat-2025-never-used-internet-75-89, eu-eurostat-2025-never-used-internet-65-74, eu-eurostat-2007-never-used-internet-65-74, eu-eurostat-2010-never-used-internet-65-74, eu-eurostat-2013-never-used-internet-65-74, eu-eurostat-2016-never-used-internet-65-74, eu-eurostat-2019-never-used-internet-65-74, eu-eurostat-2022-never-used-internet-65-74, eu-eurostat-2007-internet-use-65-74, eu-eurostat-2008-internet-use-65-74, eu-eurostat-2009-internet-use-65-74, eu-eurostat-2010-internet-use-65-74, eu-eurostat-2011-internet-use-65-74, eu-eurostat-2012-internet-use-65-74, eu-eurostat-2013-internet-use-65-74, eu-eurostat-2014-internet-use-65-74, eu-eurostat-2015-internet-use-65-74, eu-eurostat-2016-internet-use-65-74, eu-eurostat-2017-internet-use-65-74, eu-eurostat-2018-internet-use-65-74, eu-eurostat-2019-internet-use-65-74, eu-eurostat-2020-internet-use-65-74, eu-eurostat-2021-internet-use-65-74, eu-eurostat-2022-internet-use-65-74, eu-eurostat-2023-internet-use-65-74, eu-eurostat-2024-internet-use-65-74, eu-eurostat-2007-internet-use-16-74, eu-eurostat-2010-internet-use-16-74, eu-eurostat-2013-internet-use-16-74, eu-eurostat-2016-internet-use-16-74, eu-eurostat-2019-internet-use-16-74, eu-eurostat-2022-internet-use-16-74, es-eurostat-2007-internet-use-75plus, es-eurostat-2013-internet-use-75plus, es-eurostat-2019-internet-use-75plus, es-eurostat-2024-internet-use-75plus, it-eurostat-2004-internet-use-75plus, it-eurostat-2012-internet-use-75plus, it-eurostat-2020-internet-use-75plus, it-eurostat-2024-internet-use-75plus, eu-eurostat-2007-internet-use-55-64, eu-eurostat-2008-internet-use-55-64, eu-eurostat-2009-internet-use-55-64, eu-eurostat-2010-internet-use-55-64, eu-eurostat-2011-internet-use-55-64, eu-eurostat-2012-internet-use-55-64, eu-eurostat-2013-internet-use-55-64, eu-eurostat-2014-internet-use-55-64, eu-eurostat-2015-internet-use-55-64, eu-eurostat-2016-internet-use-55-64, eu-eurostat-2017-internet-use-55-64, eu-eurostat-2018-internet-use-55-64, eu-eurostat-2019-internet-use-55-64, eu-eurostat-2020-internet-use-55-64, eu-eurostat-2021-internet-use-55-64, eu-eurostat-2022-internet-use-55-64, eu-eurostat-2023-internet-use-55-64, eu-eurostat-2024-internet-use-55-64
- [33]AARP Research. Getting Connected: Older Americans Embrace Technology to Enhance Their Lives. Published 2018-02-23. Accessed 2026-10-11.Used for: us-aarp-2017-smartphone-50plus
- [34]AARP Research. Older Adults Keep Pace on Tech Usage: 2020 Tech Trends of the 50+. Published 2020-01-15. Accessed 2026-10-11.Used for: us-aarp-2019-smartphone-50plus, us-aarp-2019-smartphone-by-age-50plus
- [35]AARP Research. 2025 Tech Trends and Adults 50-Plus. Published 2025-01-01. Accessed 2026-10-11.Used for: us-aarp-2020-smartphone-50plus, us-aarp-2021-smartphone-50plus, us-aarp-2022-smartphone-50plus, us-aarp-2023-smartphone-50plus, us-aarp-2024-smartphone-50plus
- [36]Pew Research Center. Mobile Fact Sheet (November 13, 2024 edition, Internet Archive capture of 2 July 2025). Published 2024-11-13. Accessed 2026-10-11.Used for: us-pew-2024-smartphone-65plus, us-pew-2024-cellphone-65plus, us-pew-2024-smartphone-50-64
- [37]AARP Research. 2026 Tech Trends and Adults 50-Plus. Published 2025-12-01. Accessed 2026-10-11.Used for: us-aarp-2025-smartphone-18-49, us-aarp-2025-generative-ai-use-80plus, us-aarp-2025-texting-to-stay-connected-50plus, us-aarp-2025-video-chat-to-stay-connected-50plus, us-aarp-2025-online-banking-finance-50plus, us-aarp-2025-medical-digital-services-50plus, us-aarp-2025-daily-smartphone-use-50plus-owners, us-aarp-2025-digital-skills-confidence-80plus, us-aarp-2025-tech-not-designed-for-age-80plus, us-aarp-2025-regular-cellphone-50plus, aarp-2026-wearable-ownership-50plus-36pct, us-aarp-2025-home-health-safety-device-50plus, us-aarp-2025-caregivers-50plus-gps-location-detectors-26pct, us-aarp-2025-caregivers-50plus-emergency-response-systems-12pct, us-aarp-2025-50plus-worry-ai-voice-scam-calls-57pct
- [38]Pew Research Center. Internet, Broadband Fact Sheet. Published 2025-11-20. Accessed 2026-10-11.Used for: us-pew-2025-internet-use-65plus, us-pew-2025-smartphone-dependent-65plus, us-pew-2025-home-broadband-65plus, us-pew-2013-smartphone-dependent-65plus, us-pew-2016-smartphone-dependent-65plus, us-pew-2019-smartphone-dependent-65plus, us-pew-2021-smartphone-dependent-65plus, us-pew-2023-smartphone-dependent-65plus, us-pew-2000-internet-use-65plus, us-pew-2001-internet-use-65plus, us-pew-2002-internet-use-65plus, us-pew-2003-internet-use-65plus, us-pew-2004-internet-use-65plus, us-pew-2005-internet-use-65plus, us-pew-2006-internet-use-65plus, us-pew-2007-internet-use-65plus, us-pew-2008-internet-use-65plus, us-pew-2009-internet-use-65plus, us-pew-2010-internet-use-65plus, us-pew-2011-internet-use-65plus, us-pew-2012-internet-use-65plus, us-pew-2013-internet-use-65plus, us-pew-2014-internet-use-65plus, us-pew-2015-internet-use-65plus, us-pew-2016-internet-use-65plus, us-pew-2018-internet-use-65plus, us-pew-2019-internet-use-65plus, us-pew-2021-internet-use-65plus, us-pew-2023-internet-use-65plus, us-pew-2024-internet-use-65plus
- [39]US Census Bureau. American Community Survey 2024 1-year estimates, Table S2802: Types of Internet Subscriptions by Selected Characteristics. Published 2025-09-11. Accessed 2026-10-11.Used for: us-census-acs-2024-broadband-65plus-persons, us-census-acs-2024-no-computer-65plus-persons
- [40]Ministry of Internal Affairs and Communications, Japan (総務省). 平成25年通信利用動向調査 世帯構成員編 構8表 問1(1)保有する情報通信機器(M). Published 2014-06-27. Accessed 2026-10-11.Used for: jp-mic-2013-smartphone-ownership-65plus, jp-mic-2013-smartphone-ownership-80plus, jp-mic-2013-smartphone-ownership-50-59, jp-mic-2013-smartphone-ownership-70-79
- [41]Ministry of Internal Affairs and Communications, Japan (総務省). 平成26年通信利用動向調査 世帯構成員編 表番号8 問1(1)保有する情報通信機器(M)(対象:全員). Published 2015-07-17. Accessed 2026-10-11.Used for: jp-mic-2014-smartphone-ownership-65plus, jp-mic-2014-smartphone-ownership-80plus, jp-mic-2014-smartphone-ownership-50-59, jp-mic-2014-smartphone-ownership-60-69, jp-mic-2014-smartphone-ownership-70-79
- [42]Ministry of Internal Affairs and Communications, Japan (総務省). 平成27年通信利用動向調査 世帯構成員編 表番号7 問1(1)保有する情報通信機器(M)(対象:全員). Published 2016-08-18. Accessed 2026-10-11.Used for: jp-mic-2015-smartphone-ownership-65plus, jp-mic-2015-smartphone-gap-60-69-vs-70-79, jp-mic-2015-smartphone-ownership-80plus, jp-mic-2015-smartphone-ownership-50-59, jp-mic-2015-smartphone-ownership-60-69, jp-mic-2015-smartphone-ownership-70-79
- [43]Ministry of Internal Affairs and Communications, Japan (総務省). 平成28年通信利用動向調査 世帯構成員編 表番号7 問1 保有するモバイル端末(M)(対象:全員). Published 2017-06-15. Accessed 2026-10-11.Used for: jp-mic-2016-smartphone-ownership-65plus, jp-mic-2016-smartphone-ownership-80plus, jp-mic-2016-smartphone-ownership-50-59, jp-mic-2016-smartphone-ownership-60-69, jp-mic-2016-smartphone-ownership-70-79
- [44]Ministry of Internal Affairs and Communications, Japan (総務省). 平成29年通信利用動向調査 世帯構成員編 表番号8 問1(1)保有するモバイル端末(M). Published 2018-06-22. Accessed 2026-10-11.Used for: jp-mic-2017-smartphone-ownership-65plus, jp-mic-2017-smartphone-ownership-80plus, jp-mic-2017-smartphone-ownership-50-59, jp-mic-2017-smartphone-ownership-60-69, jp-mic-2017-smartphone-ownership-70-79
- [45]Ministry of Internal Affairs and Communications, Japan (総務省). 平成30年通信利用動向調査 世帯構成員編 表番号18 問4(1) 保有するモバイル端末. Published 2019-05-31. Accessed 2026-10-11.Used for: jp-mic-2018-smartphone-ownership-65plus, jp-mic-2018-smartphone-ownership-elderly-only-households, jp-mic-2018-smartphone-ownership-80plus, jp-mic-2018-smartphone-ownership-50-59, jp-mic-2018-smartphone-ownership-60-69, jp-mic-2018-smartphone-ownership-70-79
- [46]Ministry of Internal Affairs and Communications, Japan (総務省). 令和元年通信利用動向調査 世帯構成員編 表番号23 問7(1)保有するモバイル端末. Published 2020-05-29. Accessed 2026-10-11.Used for: jp-mic-2019-smartphone-ownership-65plus, jp-mic-2019-smartphone-ownership-elderly-only-households, jp-mic-2019-smartphone-ownership-80plus, jp-mic-2019-smartphone-ownership-50-59, jp-mic-2019-smartphone-ownership-60-69, jp-mic-2019-smartphone-ownership-70-79
- [47]Ministry of Internal Affairs and Communications, Japan (総務省). 令和3年通信利用動向調査 世帯構成員編 表番号22 問7(1) 保有するモバイル端末. Published 2022-05-27. Accessed 2026-10-11.Used for: jp-mic-2021-smartphone-ownership-65plus, jp-mic-2021-smartphone-ownership-elderly-only-households, jp-mic-2021-smartphone-ownership-80plus, jp-mic-2021-smartphone-ownership-50-59, jp-mic-2021-smartphone-ownership-60-69, jp-mic-2021-smartphone-ownership-70-79
- [48]Ministry of Internal Affairs and Communications, Japan (総務省). 令和4年通信利用動向調査 世帯構成員編 表番号24 問7(1) 保有するモバイル端末. Published 2023-05-29. Accessed 2026-10-11.Used for: jp-mic-2022-smartphone-ownership-65plus, jp-mic-2022-smartphone-ownership-elderly-only-households, jp-mic-2022-smartphone-ownership-80plus, jp-mic-2022-smartphone-ownership-50-59, jp-mic-2022-smartphone-ownership-60-69, jp-mic-2022-smartphone-ownership-70-79
- [49]Ministry of Internal Affairs and Communications, Japan (総務省). 令和5年通信利用動向調査 世帯構成員編 表番号24 問7(1) 保有するモバイル端末. Published 2024-06-07. Accessed 2026-10-11.Used for: jp-mic-2023-smartphone-ownership-65plus, jp-mic-2023-smartphone-ownership-elderly-only-households, jp-mic-2023-smartphone-ownership-80plus, jp-mic-2023-smartphone-ownership-50-59, jp-mic-2023-smartphone-ownership-60-69, jp-mic-2023-smartphone-ownership-70-79
- [50]Ministry of Internal Affairs and Communications, Japan (総務省). 令和6年通信利用動向調査 世帯構成員編 表番号24 問7(1) 保有するモバイル端末. Published 2025-05-30. Accessed 2026-10-11.Used for: jp-mic-2024-smartphone-ownership-65plus, jp-mic-2024-smartphone-ownership-elderly-only-households, jp-mic-2024-smartphone-ownership-80plus, jp-mic-2024-smartphone-ownership-50-59, jp-mic-2024-smartphone-ownership-60-69, jp-mic-2024-smartphone-ownership-70-79
- [51]Ofcom. Ofcom Technology Tracker 2025: core data tables (PDF). Published 2025. Accessed 2026-10-11.Used for: uk-ofcom-2025-smartphone-personal-use-55-64-derived, uk-ofcom-2025-smartphone-personal-use-65plus, uk-ofcom-2025-mobile-phone-personal-use-75plus, uk-ofcom-2025-smartphone-personal-use-75plus, uk-ofcom-2025-smartphone-personal-use-65-74-derived
- [52]Office for National Statistics (ONS). Internet access - households and individuals: reference tables 2020, Table 22 (Smartphone security, by age group, sex and disability status). Published 2020-08-07. Accessed 2026-10-11.Used for: gb-ons-2020-smartphone-private-use-65plus
- [53]Ofcom. Ofcom Technology Tracker Wave 2 2013: Digital Participation Consortium subset data tables (CSV). Published 2013-09. Accessed 2026-10-11.Used for: uk-ofcom-2013-smartphone-personal-use-65plus, uk-ofcom-2013-smartphone-personal-use-55-64, uk-ofcom-2013-smartphone-personal-use-65-74, uk-ofcom-2013-smartphone-personal-use-75plus
- [54]Ofcom. Ofcom Technology Tracker Wave 2 2014: Digital Participation Consortium subset data tables (CSV). Published 2014-09. Accessed 2026-10-11.Used for: uk-ofcom-2014-smartphone-personal-use-65plus, uk-ofcom-2014-smartphone-gap-55-64-vs-65-74, uk-ofcom-2014-smartphone-personal-use-55-64, uk-ofcom-2014-smartphone-personal-use-65-74, uk-ofcom-2014-smartphone-personal-use-75plus
- [55]Ofcom. Ofcom Technology Tracker H1 2017: Digital Participation Consortium subset data tables (CSV). Published 2017. Accessed 2026-10-11.Used for: uk-ofcom-2017-smartphone-personal-use-65plus, uk-ofcom-2017-smartphone-personal-use-55-64, uk-ofcom-2017-smartphone-personal-use-65-74, uk-ofcom-2017-smartphone-personal-use-75plus
- [56]Ofcom. Ofcom Technology Tracker H1 2018: Digital Participation Consortium subset data tables (CSV). Published 2018. Accessed 2026-10-11.Used for: uk-ofcom-2018-smartphone-personal-use-65plus, uk-ofcom-2018-smartphone-personal-use-55-64, uk-ofcom-2018-smartphone-personal-use-65-74, uk-ofcom-2018-smartphone-personal-use-75plus
- [57]Ofcom. Ofcom Technology Tracker 2019: Digital Participation Consortium subset data tables (CSV). Published 2019. Accessed 2026-10-11.Used for: uk-ofcom-2019-smartphone-personal-use-65plus, uk-ofcom-2019-smartphone-personal-use-55-64, uk-ofcom-2019-smartphone-personal-use-65-74, uk-ofcom-2019-smartphone-personal-use-75plus
- [58]Ofcom. Ofcom Technology Tracker 2020: Digital Participation Consortium subset data tables (xlsx). Published 2020. Accessed 2026-10-11.Used for: uk-ofcom-2020-smartphone-personal-use-65plus, uk-ofcom-2020-smartphone-personal-use-55-64, uk-ofcom-2020-smartphone-personal-use-65-74, uk-ofcom-2020-smartphone-personal-use-75plus
- [59]Ofcom. Ofcom Technology Tracker 2024: subset data tables (PDF). Published 2024-07. Accessed 2026-10-11.Used for: uk-ofcom-2024-smartphone-personal-use-65plus, uk-ofcom-pseudo-cohort-2014-55-64-to-2024-65-74, uk-ofcom-2024-smartphone-personal-use-55-64, uk-ofcom-2024-smartphone-personal-use-65-74, uk-ofcom-2024-smartphone-personal-use-75plus
- [60]Ministry of Science and ICT / National Information Society Agency, Korea (과학기술정보통신부 / 한국지능정보사회진흥원). 2025 Survey on the Internet Usage, Statistical Table (English). Published 2026-06-25. Accessed 2026-10-11.Used for: kr-msit-2025-smartphone-ownership-60-69, kr-msit-2025-smartphone-ownership-70plus, kr-msit-2025-internet-use-70plus, kr-msit-2025-internet-users-60plus-count, kr-msit-2025-internet-use-70plus-by-sex, kr-msit-2025-non-users-share-70plus
- [61]Centers for Medicare & Medicaid Services (CMS), Medicare Current Beneficiary Survey. 2024 Internet Access and Use Among Medicare Beneficiaries Preliminary Estimates PUF (xlsx, Table 1 "Internet Access"). Published 2025-08-14. Accessed 2026-10-11.Used for: us-cms-mcbs-2024-smartphone-85plus, us-cms-mcbs-2024-smartphone-75-84, us-cms-mcbs-2024-smartphone-65-74, us-cms-mcbs-2024-internet-access-85plus
- [62]Centers for Medicare & Medicaid Services (CMS), Medicare Current Beneficiary Survey. 2023 MCBS Early PUF on Internet Access and Use Among Medicare Beneficiaries (xlsx, Table 1 "Internet Access"). Published 2025-03-07. Accessed 2026-10-11.Used for: us-cms-mcbs-2023-internet-access-85plus
- [63]Pew Research Center. Record shares of Americans now own smartphones, have home broadband (short read). Published 2017-01-12. Accessed 2026-10-11.Used for: us-pew-2016-smartphone-65plus-change-since-2015, us-pew-2016-smartphone-50-64-change-since-2015, us-pew-2016-smartphone-50-64
- [64]Pew Research Center. Nearly Half of American Adults are Smartphone Owners (report PDF). Published 2012-03-01. Accessed 2026-10-11.Used for: us-pew-2012-smartphone-65plus-change-since-2011, us-pew-2012-smartphone-50-64
- [65]US Census Bureau. Older People Projected to Outnumber Children for First Time in U.S. History (press release CB18-41). Published 2018-03-13. Accessed 2026-10-11.Used for: us-census-2018-all-baby-boomers-65plus-by-2030
- [66]Eurostat. Population structure and ageing (Statistics Explained). Published 2026-09-28. Accessed 2026-10-11.Used for: eu-eurostat-2025-population-share-65plus
- [67]Cabinet Office, Japan (内閣府). 令和8年版高齢社会白書(全体版) 第1章第1節1 高齢化の現状と将来像. Published 2026. Accessed 2026-10-11.Used for: jp-cao-2026-population-share-65plus
- [68]United Nations, Department of Economic and Social Affairs, Population Division. World Population Prospects 2024: Summary of Results. Published 2024-07-11. Accessed 2026-10-11.Used for: un-desa-2024-wpp-65plus-outnumber-children-late-2070s
- [69]Centers for Medicare & Medicaid Services (CMS), Medicare Current Beneficiary Survey. 2025 Internet Access and Use Among Medicare Beneficiaries Preliminary Estimates PUF (xlsx, Table 1 "Internet Access"). Published 2026-09-30. Accessed 2026-10-11.Used for: us-cms-mcbs-2025-smartphone-85plus, us-cms-mcbs-2025-smartphone-65-74, us-cms-mcbs-2025-smartphone-75-84, us-cms-mcbs-2025-any-device-85plus, us-cms-mcbs-2025-internet-access-85plus, us-cms-mcbs-2025-smartphone-living-alone, us-cms-mcbs-2025-internet-access-living-alone, us-cms-mcbs-2025-smartphone-income, us-cms-mcbs-2025-smartphone-education, us-cms-mcbs-2025-smartphone-nonmetro, us-cms-mcbs-2025-smartphone-disability, us-cms-mcbs-2025-smartphone-race
- [70]Cabinet Office, Japan (内閣府). 令和7年度 高齢社会対策総合調査(高齢者の生活と意識に関する国際比較調査)(第10回) 図表2-7-8-3 所有している情報通信機器(年代別). Published 2026. Accessed 2026-10-11.Used for: jp-cao-2025-smartphone-ownership-60plus-by-age, jp-cao-2025-smartphone-ownership-60plus
- [71]Pew Research Center. Mobile Technology and Home Broadband 2021. Published 2021-06-03. Accessed 2026-10-11.Used for: us-pew-2021-smartphone-75plus
- [72]Pew Research Center. Mobile Technology and Home Broadband 2019. Published 2019-06-13. Accessed 2026-10-11.Used for: us-pew-2019-smartphone-75plus
- [73]Ministry of Digital Affairs, Taiwan (數位發展部). 114年數位近用調查報告 表A2-2 個人上網率及最近三個月上網情形. Published 2026-01-13. Accessed 2026-10-11.Used for: tw-moda-2025-internet-use-65-69, tw-moda-2025-internet-use-70-74, tw-moda-2025-internet-use-75plus, tw-moda-2025-internet-use-65plus, tw-moda-2020-internet-use-65plus, tw-moda-2022-internet-use-65plus, tw-moda-2023-internet-use-65plus, tw-moda-2024-internet-use-65plus, tw-moda-2025-internet-use-70plus-sex-gap, tw-moda-2025-household-internet-65plus
- [74]Instituto Nacional de Estadística (INE). Encuesta sobre Equipamiento y Uso de TIC en los Hogares (TIC-H) 2025: Uso de Internet, por características demográficas y frecuencia de uso (personas de 75 y más años). Published 2025-11-20. Accessed 2026-10-11.Used for: es-ine-2025-internet-use-75-84, es-ine-2025-internet-use-85plus, es-ine-2025-internet-use-75plus, es-ine-2025-internet-use-75plus-living-alone, es-ine-2025-internet-use-75plus-couple-no-children, es-ine-2025-internet-use-75plus-men, es-ine-2025-internet-use-75plus-women, es-ine-2025-internet-use-75plus-cities-100k-plus, es-ine-2025-internet-use-75plus-municipalities-under-10k, es-ine-2025-never-used-internet-75plus-derived
- [75]Statistics Sweden (SCB). SCB LE0108T12N2: Last use of the internet by sex and study domain, 2021-2026. Published 2026-10-05. Accessed 2026-10-11.Used for: se-scb-2026-internet-use-75-84, se-scb-2026-internet-use-85plus, se-scb-2026-internet-use-65-74, se-scb-2026-internet-use-16plus, se-scb-2024-internet-use-85plus, se-scb-2025-internet-use-85plus, se-scb-2022-internet-use-75-84, se-scb-2026-internet-use-85plus-men, se-scb-2026-internet-use-85plus-women, se-scb-2026-never-used-internet-85plus
- [76]Ældre Sagen (data: Statistics Denmark). Ældre i tal: Ældres anvendelse af IT i 2025 (Ældre Sagen, February 2026). Published 2026-02. Accessed 2026-10-11.Used for: dk-aeldresagen-2025-internet-use-12m-80-84, dk-aeldresagen-2025-internet-use-12m-85-89
- [77]Statistics Denmark (Danmarks Statistik). It-anvendelse i befolkningen 2024 (Danmarks Statistik). Published 2024-12. Accessed 2026-10-11.Used for: dk-dst-2024-internet-use-75-89, dk-dst-2024-mobile-internet-75-89-users
- [78]Statistics Canada. Evolving Internet Use Among Canadian Seniors (Davidson and Schimmele), Analytical Studies Branch Research Paper Series 11F0019M No. 427. Published 2019-07-10. Accessed 2026-10-11.Used for: ca-statcan-gss-2016-internet-use-by-age-ladder, ca-statcan-gss-2016-no-internet-past-month-80plus, ca-statcan-gss-2016-internet-use-65plus, ca-statcan-gss-2013-internet-use-65plus, ca-statcan-gss-2010-internet-use-65plus, ca-statcan-gss-2007-internet-use-65plus, ca-statcan-gss-2013-internet-use-80plus, ca-statcan-gss-2010-internet-use-80plus, ca-statcan-gss-2007-internet-use-80plus, ca-statcan-gss-2016-internet-use-seniors-living-alone, ca-statcan-gss-2016-internet-use-seniors-by-income
- [79]Kenya National Bureau of Statistics (KNBS). 2019 Kenya Population and Housing Census, Volume IV: Distribution of Population by Socio-Economic Characteristics, Table 2.35 'Distribution of Population Age 3 years and Above who owned and used Selected ICT Equipment and Service by Age, Area of Residence and County'. Published 2020. Accessed 2026-10-11.Used for: ke-knbs-2019-mobile-phone-ownership-75plus, ke-knbs-2019-internet-use-75plus
- [80]Ministry of Health and Welfare, Korea (보건복지부) / Korea Institute for Health and Social Affairs. 2023년도 노인실태조사 보고서 〈표 9-39〉 스마트폰 보유 및 사용시간. Published 2024-10-17. Accessed 2026-10-11.Used for: kr-mohw-2023-smartphone-ownership-90plus, kr-mohw-2023-smartphone-ownership-65plus-by-education, kr-mohw-2023-smartphone-ownership-living-alone, kr-mohw-2023-smartphone-use-65plus, kr-mohw-2023-smartphone-ownership-65plus-by-income, kr-mohw-2023-smartphone-ownership-65plus-by-sex, kr-mohw-2023-smartphone-ownership-65plus-urban-rural, kr-mohw-2023-smartphone-ownership-65plus-functional-limitation, kr-mohw-2023-smartphone-ownership-80-84, kr-mohw-2023-smartphone-ownership-65-69, kr-mohw-2023-smartphone-ownership-70-74, kr-mohw-2023-smartphone-ownership-75-79, kr-mohw-2023-smartphone-ownership-85-89
- [81]National Health and Aging Trends Study (NHATS), Johns Hopkins / University of Michigan, funded by the National Institute on Aging. National Health and Aging Trends Study Trends Chart Book 2011-2023: Key Trends, Measures and Detailed Tables (Freedman VA, Cornman JC, 2026). Published 2026-08-01. Accessed 2026-10-11.Used for: us-nhats-2023-online-90plus, us-nhats-2023-online-72plus-living-alone, us-nhats-2023-online-72plus-education, us-nhats-2023-online-72plus-sex, us-nhats-2023-online-72plus-nonmetro, us-nhats-2023-online-72plus-race, us-nhats-2011-online-72plus, us-nhats-2012-online-72plus, us-nhats-2013-online-72plus, us-nhats-2014-online-72plus, us-nhats-2015-online-72plus, us-nhats-2016-online-72plus, us-nhats-2017-online-72plus, us-nhats-2018-online-72plus, us-nhats-2019-online-72plus, us-nhats-2020-online-72plus, us-nhats-2021-online-72plus, us-nhats-2022-online-72plus, us-nhats-2023-online-72plus, us-nhats-2023-online-72-74, us-nhats-2023-online-75-79, us-nhats-2023-online-80-84, us-nhats-2023-online-85-89, us-nhats-2011-online-72plus-living-alone, us-nhats-2012-online-72plus-living-alone, us-nhats-2013-online-72plus-living-alone, us-nhats-2014-online-72plus-living-alone, us-nhats-2015-online-72plus-living-alone, us-nhats-2016-online-72plus-living-alone, us-nhats-2017-online-72plus-living-alone, us-nhats-2018-online-72plus-living-alone, us-nhats-2019-online-72plus-living-alone, us-nhats-2020-online-72plus-living-alone, us-nhats-2021-online-72plus-living-alone, us-nhats-2022-online-72plus-living-alone
- [82]Statistics Canada. The Daily, Canadian Internet Use Survey, 2022 (released 2023-07-20); StatsCAN Plus, 'Canadian seniors more connected than ever' (2023-08-14). Published 2023-07-20. Accessed 2026-10-11.Used for: ca-statcan-2022-internet-use-75plus
- [83]Instituto Nacional de Estadística y Geografía (INEGI). ENDUTIH 2025, Resultados principales (presentation), slide 'Personas usuarias de internet según grupos de edad 2015 y 2022-2025'. Published 2026-06-16. Accessed 2026-10-11.Used for: mx-inegi-2025-internet-use-75plus, mx-inegi-2025-internet-use-65-74, mx-inegi-2015-internet-use-65-74, mx-inegi-2022-internet-use-65-74, mx-inegi-2023-internet-use-65-74, mx-inegi-2024-internet-use-65-74, mx-inegi-2015-internet-use-75plus, mx-inegi-2022-internet-use-75plus, mx-inegi-2023-internet-use-75plus, mx-inegi-2024-internet-use-75plus
- [84]Pew Research Center. Tech Adoption Climbs Among Older Adults, chapter 1: Technology use among seniors. Published 2017-05-17. Accessed 2026-10-11.Used for: us-pew-2016-smartphone-65-69, us-pew-2016-smartphone-70-74, us-pew-2016-smartphone-75-79, us-pew-2016-smartphone-80plus, us-pew-2016-smartphone-income-65plus, us-pew-2016-smartphone-education-65plus
- [85]Pew Research Center. Tech Adoption Climbs Among Older Adults (report PDF). Published 2017-05-17. Accessed 2026-10-11.Used for: us-pew-2016-cellphone-by-age-65plus, us-pew-2016-internet-by-age-65plus, us-pew-2016-broadband-by-age-65plus, us-pew-2016-cellphone-65plus
- [86]Pew Research Center. Older Adults and Technology Use (report PDF). Published 2014-04-03. Accessed 2026-10-11.Used for: us-pew-2013-smartphone-by-age-65plus, us-pew-2013-smartphone-sex-65plus, us-pew-2013-smartphone-rural-65plus, us-pew-2013-smartphone-65plus, us-pew-2013-cellphone-65plus
- [87]AARP Research. 2016 Technology Trends Among Mid-Life and Older Americans. Published 2016-11-29. Accessed 2026-10-11.Used for: us-aarp-2016-smartphone-by-age-50plus, us-aarp-2016-smartphone-sex-50plus
- [88]AARP Research. Technology Use and Attitudes among Mid-Life and Older Americans. Published 2017-12-01. Accessed 2026-10-11.Used for: us-aarp-2017-smartphone-by-age-50plus, us-aarp-2017-feature-phone-70plus
- [89]OECD Directorate for Science, Technology and Innovation (OECD.STI.DEP). OECD, ICT Access and Usage by Individuals database (DSD_ICT_HH_IND@DF_IND v1.1), measure C5B_I 'Individuals using the internet - last 3 m'. Published 2026. Accessed 2026-10-11.Used for: oecd-2024-internet-use-75plus-nor, oecd-2025-internet-use-75plus-che, oecd-2022-internet-use-75plus-can, oecd-2023-internet-use-75plus-usa, oecd-2024-internet-use-75plus-chl, oecd-2024-internet-use-75plus-bel, oecd-2024-internet-use-75plus-kor, oecd-2023-internet-use-75plus-lva, oecd-2023-internet-use-75plus-aut, oecd-2024-internet-use-75plus-irl, oecd-2023-internet-use-75plus-hrv, oecd-2024-internet-use-75plus-cri, oecd-2024-internet-use-75plus-esp, oecd-2024-internet-use-75plus-bra, oecd-2024-internet-use-75plus-ita, oecd-2024-internet-use-75plus-mex, oecd-2022-internet-use-75plus-egy, oecd-2021-internet-use-75plus-isr, oecd-2024-internet-use-55-74-kor, oecd-2022-internet-use-55-74-can, oecd-2024-internet-use-55-74-chl, oecd-2025-internet-use-55-74-oecd, oecd-2025-internet-use-55-74-eu27, oecd-2021-internet-use-55-74-isr, oecd-2024-internet-use-55-74-cri, oecd-2023-internet-use-55-74-usa, oecd-2024-internet-use-55-74-bra, oecd-2025-internet-use-55-74-tur, oecd-2024-internet-use-55-74-mex, oecd-2022-internet-use-55-74-egy
- [90]China Internet Network Information Center (CNNIC, 中国互联网络信息中心). 第56次中国互联网络发展状况统计报告. Published 2025-07-21. Accessed 2026-10-11.Used for: cn-cnnic-2025-06-internet-penetration-60plus, cn-cnnic-2025-06-internet-users-60plus, cn-cnnic-2025-06-share-of-users-60plus, cn-cnnic-2025-06-non-users-share-60plus
- [91]Ministry of Internal Affairs and Communications, Japan (総務省). 令和7年通信利用動向調査 世帯構成員編 表番号9 問1 過去1年間のインターネット利用経験(対象:無回答除く). Published 2026-05-29. Accessed 2026-10-11.Used for: jp-mic-2025-internet-use-65plus, jp-mic-2025-internet-use-elderly-only-households, jp-mic-2025-internet-use-80plus-by-sex, jp-mic-2025-internet-use-80plus
- [92]Statistics Canada. Statistics Canada, Table 22-10-0135-01, Internet use by province and age group (Canadian Internet Use Survey). Published 2023-07-20. Accessed 2026-10-11.Used for: ca-statcan-2022-internet-use-65plus, ca-statcan-2020-internet-use-65plus, ca-statcan-2018-internet-use-65plus, ca-statcan-2022-internet-use-65plus-by-province
- [93]Instituto Nacional de Estadística y Censos (INDEC), Argentina. INDEC, Cuadros del Módulo de Acceso y uso de Tecnologías de la Información y Comunicación (MAUTIC), Cuarto trimestre de 2024, Cuadro 3 (población de 4 años y más por uso de TIC según sexo y grupos de edad). Published 2025-05-15. Accessed 2026-10-11.Used for: ar-indec-2024-internet-use-65plus, ar-indec-2024-mobile-phone-use-65plus
- [94]Departamento Administrativo Nacional de Estadística (DANE), Colombia. DANE, Indicadores básicos de tenencia y uso de TIC en hogares y personas de 5 y más años de edad 2025, anexo, Cuadro C.14. Published 2026-09-30. Accessed 2026-10-11.Used for: co-dane-2025-internet-use-55plus, co-dane-2025-own-mobile-phone-55plus, co-dane-2025-internet-use-55plus-urban-rural
- [95]Instituto Nacional de Estadística e Informática (INEI), Peru. INEI, Informe Técnico N° 01 Marzo 2026, 'Estadísticas de las tecnologías de información y comunicación en los hogares, IV Trimestre 2025', Cuadro Nº 2.1. Published 2026-03. Accessed 2026-10-11.Used for: pe-inei-2025q4-internet-use-60plus, pe-inei-2025q4-mobile-phone-use-60plus, pe-inei-2014-internet-use-60plus, pe-inei-2016-internet-use-60plus, pe-inei-2018-internet-use-60plus, pe-inei-2020-internet-use-60plus, pe-inei-2022-internet-use-60plus, pe-inei-2023-internet-use-60plus, pe-inei-2024-internet-use-60plus
- [96]Agencia de Gobierno Electrónico y Sociedad de la Información y del Conocimiento (AGESIC) and Instituto Nacional de Estadística (INE), Uruguay. EUTIC 2022, Encuesta de Usos de Tecnologías de la Información y la Comunicación (AGESIC, INE, with Antel), Gráfico 9. Published 2023-06. Accessed 2026-10-11.Used for: uy-agesic-ine-2022-internet-use-65plus, uy-agesic-ine-2019-internet-use-65plus
- [97]Instituto Nacional de Estadística y Geografía (INEGI). ENDUTIH 2024, Reporte de resultados 9/25. Published 2025-05-06. Accessed 2026-10-11.Used for: mx-inegi-2024-internet-use-65plus
- [98]Insee. Insee BDM series 010594694: Part des individus s'étant connectés à internet au cours des trois derniers mois - 75 ans ou plus. Published 2026-05-27. Accessed 2026-10-11.Used for: fr-insee-2025-internet-use-75plus, fr-insee-2010-internet-use-75plus, fr-insee-2013-internet-use-75plus, fr-insee-2016-internet-use-75plus, fr-insee-2019-internet-use-75plus, fr-insee-2021-internet-use-75plus, fr-insee-2023-internet-use-75plus
- [99]Istat. Cittadini e ICT, anno 2025 (Istat statistical report, testo integrale e nota metodologica). Published 2026-04-22. Accessed 2026-10-11.Used for: it-istat-2025-internet-use-75plus, it-istat-2025-older-only-households-internet-access, it-istat-2025-internet-use-75plus-men, it-istat-2025-internet-use-75plus-women
- [100]Office for National Statistics (ONS). Internet users, UK: 2020 (bulletin and dataset internetusers2020.xlsx). Published 2021-04-06. Accessed 2026-10-11.Used for: uk-ons-2020-internet-use-75plus
- [101]China Internet Network Information Center (CNNIC, 中国互联网络信息中心). 第57次中国互联网络发展状况统计报告. Published 2026-02-05. Accessed 2026-10-11.Used for: cn-cnnic-2025-12-internet-users-60plus-derived, cn-cnnic-2025-12-share-of-users-60plus, cn-cnnic-2025-12-non-users-share-60plus
- [102]China Internet Network Information Center (CNNIC, 中国互联网络信息中心). 第49次中国互联网络发展状况统计报告. Published 2022-02-25. Accessed 2026-10-11.Used for: cn-cnnic-2021-12-internet-users-60plus, cn-cnnic-2021-12-internet-penetration-60plus, cn-cnnic-2021-12-share-of-users-60plus, cn-cnnic-2021-12-non-users-share-60plus
- [103]China Internet Network Information Center (CNNIC, 中国互联网络信息中心). 第55次中国互联网络发展状况统计报告. Published 2025-01-17. Accessed 2026-10-11.Used for: cn-cnnic-2024-12-internet-penetration-60plus, cn-cnnic-2024-12-share-of-users-60plus, cn-cnnic-2024-12-non-users-share-60plus
- [104]Ministry of Science and ICT / National Information Society Agency, Korea. 2025 디지털정보격차 실태조사 보고서. Published 2026-03-27. Accessed 2026-10-11.Used for: kr-nia-2025-smartphone-ownership-55plus
- [105]Taiwan Network Information Center (TWNIC, 財團法人台灣網路資訊中心). 2025年台灣網路報告 表四-2 台灣民眾上網率在年齡方面的分布. Published 2025-12-17. Accessed 2026-10-11.Used for: tw-twnic-2025-internet-use-70plus, tw-twnic-2024-internet-use-70plus, tw-twnic-2025-mobile-broadband-70plus
- [106]Ministry of Digital Affairs, Taiwan (數位發展部). 111年資深公民數位發展調查報告. Published 2023-01. Accessed 2026-10-11.Used for: tw-moda-2022-smartphone-60plus-eight-counties
- [107]NTT Docomo Mobile Society Research Institute (モバイル社会研究所). シニア調査開始から10年 スマホ所有率は4倍の89%(2025年3月24日). Published 2025-03-24. Accessed 2026-10-11.Used for: jp-mobaken-2025-smartphone-ownership-kanto-60s70s-ten-year
- [108]Instituto Brasileiro de Geografia e Estatística (IBGE). IBGE SIDRA Tabela 7361, Percentual de pessoas que tinham telefone móvel celular para uso pessoal na população de 10 anos ou mais de idade, por sexo e grupo de idade (PNAD Contínua, módulo TIC). Published 2026-07-02. Accessed 2026-10-11.Used for: br-ibge-2025-mobile-phone-ownership-60plus, br-ibge-2016-mobile-phone-ownership-60plus, br-ibge-2017-mobile-phone-ownership-60plus, br-ibge-2018-mobile-phone-ownership-60plus, br-ibge-2019-mobile-phone-ownership-60plus, br-ibge-2021-mobile-phone-ownership-60plus, br-ibge-2022-mobile-phone-ownership-60plus, br-ibge-2023-mobile-phone-ownership-60plus, br-ibge-2024-mobile-phone-ownership-60plus, br-ibge-2025-mobile-phone-ownership-60plus-by-sex
- [109]Cetic.br / NIC.br (Comitê Gestor da Internet no Brasil). TIC Domicílios 2025, tabelas de indivíduos (proporção), indicator J2 - Indivíduos que possuem telefone celular. Published 2025-12-09. Accessed 2026-10-11.Used for: br-cetic-2025-own-mobile-phone-60plus
- [110]Departamento Administrativo Nacional de Estadística (DANE), Colombia. DANE, Indicadores básicos de tenencia y uso de TIC en hogares y personas de 5 y más años de edad 2018, anexo, Cuadro C.15. Published 2019-07-12. Accessed 2026-10-11.Used for: co-dane-2018-own-mobile-phone-55plus, co-dane-2018-internet-use-55plus
- [111]International Institute for Population Sciences (IIPS), Ministry of Health and Family Welfare, Harvard T.H. Chan School of Public Health, University of Southern California. Longitudinal Ageing Study in India (LASI) Wave 1, 2017-18, India Report, Table 4.16. Published 2020. Accessed 2026-10-11.Used for: in-lasi-2017-18-household-mobile-phone
- [112]Afrobarometer. Afrobarometer Dispatch No. 582, 'Digital divide: Who in Africa is connected and who is not' (2022). Published 2022-12-12. Accessed 2026-10-11.Used for: afrobarometer-2019-2021-mobile-phone-ownership-over60
- [113]Pew Research Center. Social Media Seen as Mostly Good for Democracy Across Many Nations, But U.S. is a Major Outlier (Pew Research Center, 2022). Published 2022-12-06. Accessed 2026-10-11.Used for: pew-2022-smartphone-ownership-50plus-canada, pew-2022-internet-or-smartphone-50plus-canada, pew-2022-internet-or-smartphone-50plus-israel, pew-2022-internet-or-smartphone-50plus-range-18-economies
- [114]Statistics Canada. The Daily, Canadian Internet Use Survey, 2020 (released 2021-06-22). Published 2021-06-22. Accessed 2026-10-11.Used for: ca-statcan-2020-internet-use-75plus
- [115]Office for National Statistics (ONS). Internet users, UK: 2020 (bulletin and dataset internetusers2020.xlsx). Published 2021-04-06. Accessed 2026-10-11.Used for: uk-ons-2020-internet-use-65-74, uk-ons-2013-internet-use-65-74, uk-ons-2020-internet-use-all-adults, uk-ons-2013-internet-use-75plus, uk-ons-2014-internet-use-75plus, uk-ons-2015-internet-use-75plus, uk-ons-2016-internet-use-75plus, uk-ons-2017-internet-use-75plus, uk-ons-2018-internet-use-75plus, uk-ons-2019-internet-use-75plus, uk-ons-2020-internet-use-75plus-men, uk-ons-2020-internet-use-75plus-women, uk-ons-2020-never-used-internet-75plus, uk-ons-2013-never-used-internet-75plus
- [116]Insee. Insee BDM series 010594693. Published 2026. Accessed 2026-10-11.Used for: fr-insee-2025-internet-use-60-74
- [117]Insee. Insee BDM series 010594687. Published 2026. Accessed 2026-10-11.Used for: fr-insee-2025-internet-use-15plus
- [118]Central Statistics Office (CSO) Ireland. Internet Coverage and Usage in Ireland 2025 (CSO statistical release, 7 November 2025). Published 2025-11-07. Accessed 2026-10-11.Used for: ie-cso-2024-internet-use-75plus, ie-cso-2025-never-used-internet-75plus
- [119]Statistik Austria. Internetnutzung der Altersgruppe 65+ steigt stark (Statistik Austria press release 14 023-216/25, IKT-Einsatz in Haushalten 2025). Published 2025-10-23. Accessed 2026-10-11.Used for: at-statistik-austria-2025-internet-use-75-84, at-statistik-austria-2023-internet-use-75-84, at-statistik-austria-2025-internet-use-65-84-living-alone, at-statistik-austria-2025-internet-use-65-84-multi-person-household, at-statistik-austria-2025-internet-use-65-84, at-statistik-austria-2025-internet-use-65-84-compulsory-school, at-statistik-austria-2025-internet-use-65-84-university, at-statistik-austria-2025-internet-use-65-84-men, at-statistik-austria-2025-internet-use-65-84-women, at-statistik-austria-2025-internet-use-65-84-cities, at-statistik-austria-2025-internet-use-65-84-rural
- [120]Statistics Denmark (Danmarks Statistik). StatBank BEBRIT02: Latest use of internet - per cent of the population (16-74 years). Published 2026-08-31. Accessed 2026-10-11.Used for: dk-dst-2026-internet-use-60-74, dk-dst-2008-internet-use-60-74
- [121]Statistics Norway (SSB). SSB table 06995: Use of computers and Internet, the last three months, by sex and age (per cent) 2003-2026. Published 2026-09-25. Accessed 2026-10-11.Used for: no-ssb-2026-internet-use-75-79, no-ssb-2006-internet-use-75-79
- [122]Ministry of Internal Affairs and Communications, Japan (総務省). 令和元年通信利用動向調査 世帯構成員編 表番号9 問1 過去1年間のインターネット利用経験. Published 2020-05-29. Accessed 2026-10-11.Used for: jp-mic-2019-internet-use-65plus, jp-mic-2019-internet-use-80plus
- [123]Census and Statistics Department, Hong Kong SAR. Thematic Household Survey Report No. 62 published (press release, 18 April 2017). Published 2017-04-18. Accessed 2026-10-11.Used for: hk-csd-2014-internet-use-65plus, hk-csd-2016-internet-use-65plus
- [124]Census and Statistics Department, Hong Kong SAR. Thematic Household Survey Report No. 64 published (press release, 22 March 2018). Published 2018-03-22. Accessed 2026-10-11.Used for: hk-csd-2017-internet-use-65plus
- [125]Census and Statistics Department, Hong Kong SAR. Thematic Household Survey Report No. 67 published (press release, 27 June 2019). Published 2019-06-27. Accessed 2026-10-11.Used for: hk-csd-2018-internet-use-65plus
- [126]Census and Statistics Department, Hong Kong SAR. Thematic Household Survey Report No. 69 published (press release, 26 March 2020). Published 2020-03-26. Accessed 2026-10-11.Used for: hk-csd-2019-internet-use-65plus
- [127]Census and Statistics Department, Hong Kong SAR. Thematic Household Survey Report No. 73 published (press release, 15 April 2021). Published 2021-04-15. Accessed 2026-10-11.Used for: hk-csd-2020-internet-use-65plus
- [128]Census and Statistics Department, Hong Kong SAR. Thematic Household Survey Report No. 75 published (press release, 26 May 2022). Published 2022-05-26. Accessed 2026-10-11.Used for: hk-csd-2021-internet-use-65plus, hk-csd-2020-smartphone-ownership-65plus, hk-csd-2021-smartphone-ownership-65plus
- [129]Census and Statistics Department, Hong Kong SAR. Thematic Household Survey Report No. 77 published (press release, 30 May 2023). Published 2023-05-30. Accessed 2026-10-11.Used for: hk-csd-2022-internet-use-65plus, hk-csd-2022-smartphone-ownership-65plus
- [130]Census and Statistics Department, Hong Kong SAR. Thematic Household Survey Report No. 80 published (press release, 27 June 2024). Published 2024-06-27. Accessed 2026-10-11.Used for: hk-csd-2023-internet-use-65plus
- [131]Ministry of Science and ICT / National Information Society Agency, Korea (과학기술정보통신부 / 한국지능정보사회진흥원). 2021 Survey on the Internet Usage, Statistical Table (English). Published 2022-05-02. Accessed 2026-10-11.Used for: kr-msit-2021-internet-use-70plus, kr-msit-2021-smartphone-ownership-70plus, kr-msit-2021-smartphone-ownership-60-69
- [132]Ministry of Science and ICT / National Information Society Agency, Korea (과학기술정보통신부 / 한국지능정보사회진흥원). 2022 Survey on the Internet Usage, Statistical Table (English). Published 2023-06-01. Accessed 2026-10-11.Used for: kr-msit-2022-internet-use-70plus, kr-msit-2022-smartphone-ownership-70plus, kr-msit-2022-smartphone-ownership-60-69
- [133]Ministry of Science and ICT / National Information Society Agency, Korea (과학기술정보통신부 / 한국지능정보사회진흥원). 2023 Survey on the Internet Usage, Statistical Table (English). Published 2024-05-16. Accessed 2026-10-11.Used for: kr-msit-2023-internet-use-70plus, kr-msit-2023-smartphone-ownership-70plus, kr-msit-2023-smartphone-ownership-60-69
- [134]Ministry of Science and ICT / National Information Society Agency, Korea (과학기술정보통신부 / 한국지능정보사회진흥원). 2024 Survey on the Internet Usage, Statistical Table (English). Published 2025-07-08. Accessed 2026-10-11.Used for: kr-msit-2024-internet-use-70plus, kr-msit-2024-smartphone-ownership-70plus, kr-msit-2024-smartphone-ownership-60-69
- [135]China Internet Network Information Center (CNNIC, 中国互联网络信息中心). 第45次中国互联网络发展状况统计报告. Published 2020-04-28. Accessed 2026-10-11.Used for: cn-cnnic-2020-03-share-of-users-60plus
- [136]China Internet Network Information Center (CNNIC, 中国互联网络信息中心). 第47次中国互联网络发展状况统计报告. Published 2021-02-03. Accessed 2026-10-11.Used for: cn-cnnic-2020-12-share-of-users-60plus
- [137]Instituto Nacional de Estadística y Censos (INDEC), Argentina. INDEC, Cuadros del Módulo de Acceso y uso de Tecnologías de la Información y Comunicación (MAUTIC), Cuarto trimestre de 2017, Cuadro 3 (población de 4 años y más por uso de TIC según sexo y grupos de edad). Published 2018-05. Accessed 2026-10-11.Used for: ar-indec-2017-mobile-phone-use-65plus, ar-indec-2017-internet-use-65plus
- [138]Instituto Nacional de Estadística y Censos (INDEC), Argentina. INDEC, Cuadros del Módulo de Acceso y uso de Tecnologías de la Información y Comunicación (MAUTIC), Cuarto trimestre de 2018, Cuadro 3 (población de 4 años y más por uso de TIC según sexo y grupos de edad). Published 2019-05. Accessed 2026-10-11.Used for: ar-indec-2018-mobile-phone-use-65plus, ar-indec-2018-internet-use-65plus
- [139]Instituto Nacional de Estadística y Censos (INDEC), Argentina. INDEC, Cuadros del Módulo de Acceso y uso de Tecnologías de la Información y Comunicación (MAUTIC), Cuarto trimestre de 2019, Cuadro 3 (población de 4 años y más por uso de TIC según sexo y grupos de edad). Published 2020-05. Accessed 2026-10-11.Used for: ar-indec-2019-mobile-phone-use-65plus, ar-indec-2019-internet-use-65plus
- [140]Instituto Nacional de Estadística y Censos (INDEC), Argentina. INDEC, Cuadros del Módulo de Acceso y uso de Tecnologías de la Información y Comunicación (MAUTIC), Cuarto trimestre de 2020, Cuadro 3 (población de 4 años y más por uso de TIC según sexo y grupos de edad). Published 2021-05. Accessed 2026-10-11.Used for: ar-indec-2020-mobile-phone-use-65plus, ar-indec-2020-internet-use-65plus
- [141]Instituto Nacional de Estadística y Censos (INDEC), Argentina. INDEC, Cuadros del Módulo de Acceso y uso de Tecnologías de la Información y Comunicación (MAUTIC), Cuarto trimestre de 2021, Cuadro 3 (población de 4 años y más por uso de TIC según sexo y grupos de edad). Published 2022-05. Accessed 2026-10-11.Used for: ar-indec-2021-mobile-phone-use-65plus, ar-indec-2021-internet-use-65plus
- [142]Instituto Nacional de Estadística y Censos (INDEC), Argentina. INDEC, Cuadros del Módulo de Acceso y uso de Tecnologías de la Información y Comunicación (MAUTIC), Cuarto trimestre de 2022, Cuadro 3 (población de 4 años y más por uso de TIC según sexo y grupos de edad). Published 2023-05. Accessed 2026-10-11.Used for: ar-indec-2022-mobile-phone-use-65plus, ar-indec-2022-internet-use-65plus
- [143]Instituto Nacional de Estadística y Censos (INDEC), Argentina. INDEC, Cuadros del Módulo de Acceso y uso de Tecnologías de la Información y Comunicación (MAUTIC), Cuarto trimestre de 2023, Cuadro 3 (población de 4 años y más por uso de TIC según sexo y grupos de edad). Published 2024-05. Accessed 2026-10-11.Used for: ar-indec-2023-mobile-phone-use-65plus, ar-indec-2023-internet-use-65plus
- [144]Cetic.br / NIC.br (Comitê Gestor da Internet no Brasil). TIC Domicílios 2008, indicator C2 (último acesso à Internet), tabelas de indivíduos. Published 2008. Accessed 2026-10-11.Used for: br-cetic-2008-internet-users-60plus
- [145]Cetic.br / NIC.br (Comitê Gestor da Internet no Brasil). TIC Domicílios 2015, indicator C2 (último acesso à Internet), tabelas de indivíduos. Published 2015. Accessed 2026-10-11.Used for: br-cetic-2015-internet-users-60plus
- [146]Cetic.br / NIC.br (Comitê Gestor da Internet no Brasil). TIC Domicílios 2019, indicator C2 (último acesso à Internet), tabelas de indivíduos. Published 2019. Accessed 2026-10-11.Used for: br-cetic-2019-internet-users-60plus
- [147]Cetic.br / NIC.br (Comitê Gestor da Internet no Brasil). TIC Domicílios 2024, indicator C2 (último acesso à Internet), tabelas de indivíduos. Published 2024. Accessed 2026-10-11.Used for: br-cetic-2024-internet-users-60plus
- [148]Pew Research Center. Smartphone Ownership Is Growing Rapidly Around the World, but Not Always Equally (Taylor and Silver, Pew Research Center, 2019), table 'Younger, better-educated more likely to own smartphones'. Published 2019-02-05. Accessed 2026-10-11.Used for: pew-2018-smartphone-ownership-50plus-kr, pew-2018-smartphone-ownership-50plus-israel, pew-2018-smartphone-ownership-50plus-sweden, pew-2018-smartphone-ownership-50plus-netherlands, pew-2018-smartphone-ownership-50plus-australia, pew-2018-smartphone-ownership-50plus-us, pew-2018-smartphone-ownership-50plus-germany, pew-2018-smartphone-ownership-50plus-spain, pew-2018-smartphone-ownership-50plus-uk, pew-2018-smartphone-ownership-50plus-france, pew-2018-smartphone-ownership-50plus-italy, pew-2018-smartphone-ownership-50plus-japan, pew-2018-smartphone-ownership-50plus-canada, pew-2018-smartphone-ownership-50plus-argentina, pew-2018-smartphone-ownership-50plus-hungary, pew-2018-smartphone-ownership-50plus-poland, pew-2018-smartphone-ownership-50plus-za, pew-2018-smartphone-ownership-50plus-brazil, pew-2018-smartphone-ownership-50plus-mexico, pew-2018-smartphone-ownership-50plus-greece, pew-2018-smartphone-ownership-50plus-philippines, pew-2018-smartphone-ownership-50plus-russia, pew-2018-smartphone-ownership-50plus-nigeria, pew-2018-smartphone-ownership-50plus-tunisia, pew-2018-smartphone-ownership-50plus-kenya, pew-2018-smartphone-ownership-50plus-indonesia, pew-2018-smartphone-ownership-50plus-india
- [149]Ministry of Internal Affairs and Communications, Japan (総務省). 令和7年通信利用動向調査報告書(世帯編) 図表1-3 スマートフォンの保有状況(時系列). Published 2026-05-29. Accessed 2026-10-11.Used for: jp-mic-2025-household-smartphone-householder-65plus
- [150]Subsecretaría de Telecomunicaciones (SUBTEL), Chile. SUBTEL, Informe Final 'Estudio Undécima Encuesta sobre acceso, usos y usuarios de Internet en Chile' (fieldwork by Cadem). Published 2024-11-16. Accessed 2026-10-11.Used for: cl-subtel-2024-internet-access-older-only-households, cl-subtel-2024-daily-smartphone-use-60plus
- [151]Cabinet Office, Japan (内閣府). 令和3年度 高齢者の日常生活・地域社会への参加に関する調査 第2章5 日常生活を行ううえで必要な情報 図表2-5-2-2 情報機器の利用状況(問18). Published 2022. Accessed 2026-10-11.Used for: jp-cao-2021-no-information-device-use-living-alone, jp-cao-2021-no-information-device-use-80plus-women
- [152]Older Adults Technology Services (OATS) and the Humana Foundation. Aging Connected: Exposing the Hidden Connectivity Crisis for Older Adults (2021). Published 2021-01-27. Accessed 2026-10-11.Used for: us-oats-nshap-2011-single-offline-odds-62plus, us-oats-2018-no-wireline-broadband-65plus
- [153]Statistics Canada. Statistics Canada, Table 22-10-0144-01, Internet access locations by age group and family income quartile (Canadian Internet Use Survey). Published 2023-11-02. Accessed 2026-10-11.Used for: ca-statcan-2022-home-internet-65plus-by-income
- [154]Statistics Canada. Statistics Canada, Table 22-10-0136-01, Intensity of use of Internet, video streaming services and video gaming services by gender, age group and highest certificate, diploma or degree completed. Published 2023-07-20. Accessed 2026-10-11.Used for: ca-statcan-2022-internet-use-65plus-by-education, ca-statcan-2022-internet-use-65plus-by-gender
- [155]Instituto Nacional de Estadística y Censos (INDEC), Argentina. INDEC, Acceso y uso de tecnologías de la información y la comunicación. EPH. Cuarto trimestre de 2024 (Informes técnicos vol. 9 no. 113), Cuadro 4. Published 2025-05-15. Accessed 2026-10-11.Used for: ar-indec-2024-internet-use-65plus-by-education
- [156]Instituto Nacional de Estadística (INE). Encuesta sobre Equipamiento y Uso de TIC en los Hogares (TIC-H) 2025: Uso de Internet, por características socioeconómicas y frecuencia de uso (personas de 75 y más años). Published 2025-11-20. Accessed 2026-10-11.Used for: es-ine-2025-internet-use-75plus-income-under-1400, es-ine-2025-internet-use-75plus-income-4400-plus, es-ine-2025-internet-use-75plus-less-than-primary, es-ine-2025-internet-use-75plus-university-degree
- [157]Pew Research Center. Tech Adoption Climbs Among Older Adults. Published 2017-05-17. Accessed 2026-10-11.Used for: us-pew-2016-broadband-income-65plus, us-pew-2016-smartphone-65plus
- [158]Statistisches Bundesamt (Destatis). Gut 3 % der Bevölkerung im Alter von 16 bis 74 Jahren in Deutschland sind offline (Zahl der Woche Nr. 09). Published 2026-02-24. Accessed 2026-10-11.Used for: de-destatis-2025-never-used-internet-65-74
- [159]Ofcom. Adults' Media Use and Attitudes Report 2026 (published 2 April 2026). Published 2026-04-02. Accessed 2026-10-11.Used for: uk-ofcom-2025-offline-adults-share-aged-75plus, uk-ofcom-2025-social-media-use-75plus-internet-users, uk-ofcom-2025-facebook-75plus-social-media-users, uk-ofcom-2025-whatsapp-75plus-social-media-users, uk-ofcom-2025-screen-time-too-high-75plus, uk-ofcom-2025-offline-reasons-no-need-all-ages, uk-ofcom-2025-offline-asked-someone-to-go-online, uk-ofcom-2025-offline-75plus-physical-disability, uk-ofcom-2025-not-confident-personal-data-75plus
- [160]Ofcom. A demographic deep dive into internet use: analysis using Ofcom's Technology Tracker 2025. Published 2025. Accessed 2026-10-11.Used for: uk-ofcom-2025-no-home-internet-75plus
- [161]UK Parliament, House of Lords Communications and Digital Committee. Digital exclusion (House of Lords Communications and Digital Committee, 3rd Report of Session 2022-23, HL Paper 219). Published 2023-06-29. Accessed 2026-10-11.Used for: uk-hol-2023-over-65s-not-using-internet-at-home-3-9-million, uk-hol-2023-zero-basic-digital-skills-more-than-half-over-75
- [162]Instituto Brasileiro de Geografia e Estatística (IBGE). PNAD Contínua: Acesso à Internet e à televisão e posse de telefone móvel celular para uso pessoal 2024 (Informativo). Published 2025-07-24. Accessed 2026-10-11.Used for: br-ibge-2024-internet-non-users-share-aged-60plus, br-ibge-2024-no-mobile-phone-share-aged-60plus
- [163]Internetstiftelsen (Swedish Internet Foundation). Svenskarna och internet 2026: Användning av internet och e-tjänster. Published 2026. Accessed 2026-10-11.Used for: se-internetstiftelsen-2026-non-users-76plus, se-internetstiftelsen-2021-non-users-76plus
- [164]Innovation in Aging (Gerontological Society of America), conference abstract. Patterns and associated factors of technology use in US community-dwelling older adults (Innov Aging 2024;8(Suppl 1):790, doi:10.1093/geroni/igae098.2564). Published 2024-12-31. Accessed 2026-10-11.Used for: innovaging-2024-nhats-2022-no-ict-device-65plus
- [165]Australian Digital Inclusion Index (RMIT University, ARC Centre of Excellence for Automated Decision-Making and Society, Swinburne University of Technology, with Telstra). The 2025 findings: Australian Digital Inclusion Index. Published 2025. Accessed 2026-10-11.Used for: au-adii-2025-digitally-excluded-75plus
- [166]Economic Commission for Latin America and the Caribbean (ECLAC / CEPAL). CEPAL, 'Envejecimiento en América Latina y el Caribe: inclusión y derechos de las personas mayores' (2022), chapter III section 3. Published 2022-12. Accessed 2026-10-11.Used for: cepal-2018-no-home-internet-65plus-latin-america
- [167]Department for Science, Innovation and Technology (citing the Centre for Social Justice). Digital Inclusion Action Plan: First Steps. Published 2025-02. Accessed 2026-10-11.Used for: uk-dsit-2025-offline-consumers-pay-up-to-25pct-more
- [168]China Internet Network Information Center (CNNIC, 中国互联网络信息中心). 第51次中国互联网络发展状况统计报告. Published 2023-03-02. Accessed 2026-10-11.Used for: cn-cnnic-2022-12-non-users-share-60plus
- [169]China Internet Network Information Center (CNNIC, 中国互联网络信息中心). 第53次中国互联网络发展状况统计报告. Published 2024-03-22. Accessed 2026-10-11.Used for: cn-cnnic-2023-12-non-users-share-60plus
- [170]Eurostat. Eurostat database: Individuals - internet activities (isoc_ci_ac_i), community survey on ICT usage in households and by individuals. Published 2026-04-17. Accessed 2026-10-11.Used for: eu-eurostat-2025-instant-messaging-65-74
- [171]Eurostat. Eurostat database: Individuals - internet activities (isoc_ci_ac_i), community survey on ICT usage in households and by individuals. Published 2026-04-17. Accessed 2026-10-11.Used for: eu-eurostat-2025-email-65-74
- [172]Eurostat. Eurostat database: Individuals - internet activities (isoc_ci_ac_i), community survey on ICT usage in households and by individuals. Published 2026-04-17. Accessed 2026-10-11.Used for: eu-eurostat-2025-internet-calls-video-calls-65-74
- [173]Eurostat. Eurostat database: Individuals - internet activities (isoc_ci_ac_i), community survey on ICT usage in households and by individuals. Published 2026-04-17. Accessed 2026-10-11.Used for: eu-eurostat-2025-online-news-65-74
- [174]Eurostat. Eurostat database: Individuals - internet activities (isoc_ci_ac_i), community survey on ICT usage in households and by individuals. Published 2026-04-17. Accessed 2026-10-11.Used for: eu-eurostat-2025-internet-banking-65-74
- [175]Eurostat. Eurostat database: Individuals - internet activities (isoc_ci_ac_i), community survey on ICT usage in households and by individuals. Published 2026-04-17. Accessed 2026-10-11.Used for: eu-eurostat-2025-health-information-65-74
- [176]Eurostat. Eurostat database: Internet purchases by individuals (2020 onwards) (isoc_ec_ib20), community survey on ICT usage in households and by individuals. Published 2026-04-17. Accessed 2026-10-11.Used for: eu-eurostat-2025-online-shopping-12m-65-74
- [177]Eurostat. Eurostat database: E-government activities of individuals via websites (isoc_ciegi_ac), community survey on ICT usage in households and by individuals. Published 2026-04-17. Accessed 2026-10-11.Used for: eu-eurostat-2025-egovernment-65-74
- [178]Eurostat. Eurostat database: Individuals - internet activities (isoc_ci_ac_i), community survey on ICT usage in households and by individuals. Published 2026-04-17. Accessed 2026-10-11.Used for: eu-eurostat-2025-social-networks-65-74
- [179]Eurostat. Eurostat database: Individuals - internet activities (isoc_ci_ac_i), community survey on ICT usage in households and by individuals. Published 2026-04-17. Accessed 2026-10-11.Used for: eu-eurostat-2024-video-sharing-65-74
- [180]Eurostat. Eurostat database: Individuals - internet activities (isoc_ci_ac_i), community survey on ICT usage in households and by individuals. Published 2026-04-17. Accessed 2026-10-11.Used for: eu-eurostat-2024-online-doctor-appointment-65-74
- [181]Eurostat. Eurostat database: Individuals - internet activities (isoc_ci_ac_i), community survey on ICT usage in households and by individuals. Published 2026-04-17. Accessed 2026-10-11.Used for: eu-eurostat-2024-online-health-records-65-74
- [182]Eurostat. Eurostat database: Individuals - internet activities (isoc_ci_ac_i), community survey on ICT usage in households and by individuals. Published 2026-04-17. Accessed 2026-10-11.Used for: eu-eurostat-2020-internet-calls-video-calls-65-74
- [183]Eurostat. Eurostat database: Individuals - internet activities (isoc_ci_ac_i), community survey on ICT usage in households and by individuals. Published 2026-04-17. Accessed 2026-10-11.Used for: eu-eurostat-2019-internet-calls-video-calls-65-74
- [184]Eurostat. Eurostat database: Individuals - internet activities (isoc_ci_ac_i), community survey on ICT usage in households and by individuals. Published 2026-04-17. Accessed 2026-10-11.Used for: eu-eurostat-2008-internet-calls-video-calls-65-74
- [185]Eurostat. Eurostat database: Individuals - internet activities (isoc_ci_ac_i), community survey on ICT usage in households and by individuals. Published 2026-04-17. Accessed 2026-10-11.Used for: dk-eurostat-2025-internet-banking-65-74-highest-eu
- [186]Eurostat. Eurostat database: Individuals - internet activities (isoc_ci_ac_i), community survey on ICT usage in households and by individuals. Published 2026-04-17. Accessed 2026-10-11.Used for: bg-eurostat-2025-internet-banking-65-74-lowest-eu
- [187]Pew Research Center. Social Media Fact Sheet (and Americans' Social Media Use 2025). Published 2025-11-20. Accessed 2026-10-11.Used for: us-pew-2025-youtube-use-65plus, us-pew-2025-facebook-use-65plus, us-pew-2025-whatsapp-use-65plus, us-pew-2025-instagram-use-65plus, us-pew-2025-tiktok-use-65plus
- [188]Pew Research Center. Americans' Social Media Use 2025 (report PDF). Published 2025-11-20. Accessed 2026-10-11.Used for: us-pew-2025-daily-facebook-use-65plus, us-pew-2025-daily-youtube-use-65plus
- [189]Pew Research Center. How Americans' opinions and use of AI differ by age (Americans and AI 2026). Published 2026-06-17. Accessed 2026-10-11.Used for: us-pew-2026-ai-chatbot-use-65plus, us-pew-2026-smartwatch-65plus, us-pew-2026-smart-speaker-65plus
- [190]Statistics Canada. Table 22-10-0137-01 Selected online activities by gender, age group and highest certificate, diploma or degree completed (CIUS). Published 2023-07-20. Accessed 2026-10-11.Used for: ca-statcan-2022-instant-messaging-65plus, ca-statcan-2022-video-calls-65plus, ca-statcan-2022-online-banking-65plus, ca-statcan-2022-government-online-services-65plus, ca-statcan-2022-booked-appointments-65plus
- [191]Ministry of Internal Affairs and Communications (MIC), Japan. 令和7年度 情報通信メディアの利用時間と情報行動に関する調査報告書(概要)(Survey on media use time and information behaviour FY2025, summary; MIC Institute for Information and Communications Policy). Published 2026-06-26. Accessed 2026-10-11.Used for: jp-mic-2025-line-use-70s, jp-mic-2025-youtube-use-70s, jp-mic-2025-weekday-internet-minutes-70s, jp-mic-2024-weekday-internet-minutes-70s, jp-mic-2025-feature-phone-use-70s
- [192]Ministry of Internal Affairs and Communications (MIC), Japan. 令和7年通信利用動向調査の結果 (Communications Usage Trend Survey 2025, results released 29 May 2026). Published 2026-05-29. Accessed 2026-10-11.Used for: jp-mic-2025-sns-80plus-internet-users, jp-mic-2025-email-80plus-internet-users, jp-mic-2025-egov-80plus-internet-users, jp-mic-2025-pc-internet-70-79, jp-mic-2025-feature-phone-holding-80plus, jp-mic-2025-feature-phone-holding-70-79
- [193]Ministry of Internal Affairs and Communications, Japan (総務省). 令和7年通信利用動向調査 世帯構成員編 表番号10 問2(1) インターネットの利用機器(対象:全員). Published 2026-05-29. Accessed 2026-10-11.Used for: jp-mic-2025-smartphone-internet-use-65plus
- [194]Australian Communications and Media Authority (ACMA). Communications and media in Australia: How we communicate, executive summary and key findings (December 2024). Published 2024-12-01. Accessed 2026-10-11.Used for: au-acma-2024-messaging-calling-app-75plus, au-acma-2024-landline-calls-75plus
- [195]Australian Communications and Media Authority (ACMA). Communications and media in Australia: How we use the internet, executive summary and key findings (December 2024). Published 2024-12-01. Accessed 2026-10-11.Used for: au-acma-2024-video-calling-75plus, au-acma-2024-mobile-online-multiple-times-day-75plus, au-acma-2024-wearable-75plus
- [196]Pew Research Center. About half of Americans say they spend too much time on their smartphone (short read). Published 2026-09-01. Accessed 2026-10-11.Used for: us-pew-2026-smartphone-almost-constantly-65plus, us-pew-2026-too-much-smartphone-time-65plus
- [197]Pew Research Center. Internet use, smartphone ownership, digital divides in the U.S.: What we know (short read). Published 2026-01-08. Accessed 2026-10-11.Used for: us-pew-2025-online-almost-constantly-65plus
- [198]Pew Research Center. About three-in-ten U.S. adults say they are 'almost constantly' online (short read, Perrin A., Atske S.). Published 2021-03-26. Accessed 2026-10-11.Used for: us-pew-2021-online-almost-constantly-65plus
- [199]Ofcom. Online Nation 2023 report (published 28 November 2023). Published 2023-11-28. Accessed 2026-10-11.Used for: uk-ofcom-2023-daily-time-online-65plus
- [200]Eurostat. Eurostat database: Individuals - frequency of internet use (isoc_ci_ifp_fu), community survey on ICT usage in households and by individuals. Published 2026-04-17. Accessed 2026-10-11.Used for: eu-eurostat-2025-daily-internet-use-65-74
- [201]Eurostat. Eurostat database: Individuals - frequency of internet use (isoc_ci_ifp_fu), community survey on ICT usage in households and by individuals. Published 2026-04-17. Accessed 2026-10-11.Used for: ie-eurostat-2025-daily-internet-use-65-74-highest-eu
- [202]Eurostat. Eurostat database: Individuals - frequency of internet use (isoc_ci_ifp_fu), community survey on ICT usage in households and by individuals. Published 2026-04-17. Accessed 2026-10-11.Used for: el-eurostat-2025-daily-internet-use-65-74-lowest-eu
- [203]Eurostat. Eurostat database: Individuals - frequency of internet use (isoc_ci_ifp_fu), community survey on ICT usage in households and by individuals. Published 2026-04-17. Accessed 2026-10-11.Used for: es-eurostat-2024-daily-internet-use-75plus
- [204]Eurostat. Eurostat database: Individuals - frequency of internet use (isoc_ci_ifp_fu), community survey on ICT usage in households and by individuals. Published 2026-04-17. Accessed 2026-10-11.Used for: it-eurostat-2024-daily-internet-use-75plus
- [205]Subsecretaría de Telecomunicaciones (SUBTEL), Chile. SUBTEL, Informe Final 'Estudio Décima Encuesta sobre acceso, usos y usuarios de Internet en Chile' (fieldwork by Cadem). Published 2023-12-15. Accessed 2026-10-11.Used for: cl-subtel-2023-habitual-smartphone-use-60plus
- [206]Gallup. Most U.S. Smartphone Owners Check Phone at Least Hourly (Newport F.). Published 2015-07-09. Accessed 2026-10-11.Used for: us-gallup-2015-check-phone-few-times-hour-65plus
- [207]Pew Research Center. Tech Adoption Climbs Among Older Adults, ch. 2 'Barriers to adoption and attitudes towards technology' (Anderson M., Perrin A.). Published 2017-05-17. Accessed 2026-10-11.Used for: us-pew-2016-daily-internet-use-65plus-internet-users, us-pew-2016-need-help-new-device-65plus, us-pew-2015-very-confident-devices-65plus
- [208]Ministry of Science and ICT (MSIT), Korea. 2025년 디지털 정보격차·웹 접근성·스마트폰 과의존 실태조사 결과 발표 (press release, 26 March 2026). Published 2026-03-26. Accessed 2026-10-11.Used for: kr-msit-2025-smartphone-overdependence-60s
- [209]Cabinet Office, Government of Japan (Government Public Relations Office). 情報通信機器の利活用に関する世論調査(令和7年7月調査)(Public opinion survey on the use of ICT devices, July 2025). Published 2025-11-25. Accessed 2026-10-11.Used for: jp-cao-2025-smartphone-nonuse-reason-dont-know-how-70plus, jp-cao-2025-smartphone-nonuse-reason-no-need-70plus, jp-cao-2025-smartphone-nonuse-reason-leave-to-family-70plus, jp-cao-2025-smartphone-nonuse-reason-fear-of-fraud-leaks-70plus
- [210]Pew Research Center. Older Adults and Technology Use, section 'Attitudes, impacts, and barriers to adoption' (Smith A.). Published 2014-04-03. Accessed 2026-10-11.Used for: us-pew-2013-reading-difficulty-condition-65plus, us-pew-2013-need-help-learning-new-device-65plus
- [211]The Gerontologist (Oxford University Press). Patterns of technology use among older adults with and without disabilities. Published 2013-12-30. Accessed 2026-10-11.Used for: gell-2015-nhats-vision-impairment-email-texting-pr-0-69
- [212]Eurostat. Eurostat database: Individuals' level of digital skills (from 2021 onwards) (isoc_sk_dskl_i21), community survey on ICT usage in households and by individuals. Published 2026-04-17. Accessed 2026-10-11.Used for: eu-eurostat-2025-basic-digital-skills-65-74
- [213]Eurostat. Eurostat database: Individuals' level of digital skills (from 2021 onwards) (isoc_sk_dskl_i21), community survey on ICT usage in households and by individuals. Published 2026-04-17. Accessed 2026-10-11.Used for: eu-eurostat-2023-basic-digital-skills-65-74
- [214]Eurostat. Eurostat database: Individuals' level of digital skills (from 2021 onwards) (isoc_sk_dskl_i21), community survey on ICT usage in households and by individuals. Published 2026-04-17. Accessed 2026-10-11.Used for: eu-eurostat-2021-basic-digital-skills-65-74
- [215]Eurostat. Eurostat database: Individuals' level of digital skills (from 2021 onwards) (isoc_sk_dskl_i21), community survey on ICT usage in households and by individuals. Published 2026-04-17. Accessed 2026-10-11.Used for: eu-eurostat-2025-above-basic-digital-skills-65-74
- [216]Eurostat. Eurostat database: Individuals' level of digital skills (from 2021 onwards) (isoc_sk_dskl_i21), community survey on ICT usage in households and by individuals. Published 2026-04-17. Accessed 2026-10-11.Used for: eu-eurostat-2025-digital-skills-not-assessable-65-74
- [217]National Information Society Agency (NIA), Korea. 2025 디지털정보격차 실태조사 보고서 (2025 Report on the Digital Divide Survey, National Information Society Agency / Ministry of Science and ICT). Published 2026-03-26. Accessed 2026-10-11.Used for: kr-nia-2025-digital-capability-70plus, kr-nia-2025-digital-level-55plus, kr-nia-2025-install-apps-70plus, kr-nia-2025-internet-device-pc-70plus
- [218]University of Michigan Institute for Healthcare Policy and Innovation (National Poll on Healthy Aging). Logging in: Using Patient Portals to Access Health Information (NPHA report, May 2018). Published 2018-05-01. Accessed 2026-10-11.Used for: us-npha-2018-portal-not-comfortable-tech-65-80, us-npha-2018-patient-portal-setup-65-80
- [219]Eurostat. Eurostat database: Individuals' level of digital skills (from 2021 onwards) (isoc_sk_dskl_i21), community survey on ICT usage in households and by individuals. Published 2026-04-17. Accessed 2026-10-11.Used for: ie-eurostat-2025-basic-digital-skills-65-74
- [220]Eurostat. Eurostat database: Individuals' level of digital skills (from 2021 onwards) (isoc_sk_dskl_i21), community survey on ICT usage in households and by individuals. Published 2026-04-17. Accessed 2026-10-11.Used for: nl-eurostat-2025-basic-digital-skills-65-74
- [221]Eurostat. Eurostat database: Individuals' level of digital skills (from 2021 onwards) (isoc_sk_dskl_i21), community survey on ICT usage in households and by individuals. Published 2026-04-17. Accessed 2026-10-11.Used for: fr-eurostat-2025-basic-digital-skills-65-74
- [222]Eurostat. Eurostat database: Individuals' level of digital skills (from 2021 onwards) (isoc_sk_dskl_i21), community survey on ICT usage in households and by individuals. Published 2026-04-17. Accessed 2026-10-11.Used for: de-eurostat-2025-basic-digital-skills-65-74
- [223]Eurostat. Eurostat database: Individuals' level of digital skills (from 2021 onwards) (isoc_sk_dskl_i21), community survey on ICT usage in households and by individuals. Published 2026-04-17. Accessed 2026-10-11.Used for: es-eurostat-2025-basic-digital-skills-65-74
- [224]Eurostat. Eurostat database: Individuals' level of digital skills (from 2021 onwards) (isoc_sk_dskl_i21), community survey on ICT usage in households and by individuals. Published 2026-04-17. Accessed 2026-10-11.Used for: it-eurostat-2025-basic-digital-skills-65-74
- [225]Eurostat. Eurostat database: Individuals' level of digital skills (from 2021 onwards) (isoc_sk_dskl_i21), community survey on ICT usage in households and by individuals. Published 2026-04-17. Accessed 2026-10-11.Used for: pl-eurostat-2025-basic-digital-skills-65-74
- [226]Eurostat. Eurostat database: Individuals' level of digital skills (from 2021 onwards) (isoc_sk_dskl_i21), community survey on ICT usage in households and by individuals. Published 2026-04-17. Accessed 2026-10-11.Used for: ro-eurostat-2025-basic-digital-skills-65-74
- [227]Eurostat. Eurostat database: Individuals - devices used to access the internet (isoc_ci_dev_i), community survey on ICT usage in households and by individuals. Published 2026-04-17. Accessed 2026-10-11.Used for: eu-eurostat-2025-device-mobile-phone-internet-users-65-74
- [228]Eurostat. Eurostat database: Individuals - devices used to access the internet (isoc_ci_dev_i), community survey on ICT usage in households and by individuals. Published 2026-04-17. Accessed 2026-10-11.Used for: eu-eurostat-2025-device-computer-only-internet-users-65-74
- [229]Eurostat. Eurostat database: Individuals - devices used to access the internet (isoc_ci_dev_i), community survey on ICT usage in households and by individuals. Published 2026-04-17. Accessed 2026-10-11.Used for: eu-eurostat-2025-device-laptop-internet-users-65-74
- [230]Eurostat. Eurostat database: Individuals - devices used to access the internet (isoc_ci_dev_i), community survey on ICT usage in households and by individuals. Published 2026-04-17. Accessed 2026-10-11.Used for: eu-eurostat-2025-device-tablet-internet-users-65-74
- [231]Eurostat. Eurostat database: Individuals - devices used to access the internet (isoc_ci_dev_i), community survey on ICT usage in households and by individuals. Published 2026-04-17. Accessed 2026-10-11.Used for: eu-eurostat-2025-device-desktop-internet-users-65-74
- [232]Eurostat. Eurostat database: Individuals - devices used to access the internet (isoc_ci_dev_i), community survey on ICT usage in households and by individuals. Published 2026-04-17. Accessed 2026-10-11.Used for: eu-eurostat-2025-device-other-devices-internet-users-65-74
- [233]US Census Bureau. American Community Survey 2024 1-year estimates, Table S2802: Types of Internet Subscriptions by Selected Characteristics (all states). Published 2025-09-11. Accessed 2026-10-11.Used for: us-census-acs-2024-broadband-65plus-highest-state, us-census-acs-2024-broadband-65plus-lowest-state
- [234]Gell NM, Rosenberg DE, Demiris G, LaCroix AZ, Patel KV (The Gerontologist). Patterns of technology use among older adults with and without disabilities (The Gerontologist, 2015;55(3):412-421; NHATS 2011). Published 2013-12-30. Accessed 2026-10-11.Used for: gell-2015-nhats-2011-cellphone-65plus, gell-2015-nhats-2011-computer-access-65plus
- [235]Eurostat. Eurostat database: Individuals - devices used to access the internet (isoc_ci_dev_i), community survey on ICT usage in households and by individuals. Published 2026-04-17. Accessed 2026-10-11.Used for: eu-eurostat-2016-device-mobile-phone-internet-users-65-74
- [236]Eurostat. Eurostat database: Individuals - devices used to access the internet (isoc_ci_dev_i), community survey on ICT usage in households and by individuals. Published 2026-04-17. Accessed 2026-10-11.Used for: eu-eurostat-2018-device-mobile-phone-internet-users-65-74
- [237]Eurostat. Eurostat database: Individuals - devices used to access the internet (isoc_ci_dev_i), community survey on ICT usage in households and by individuals. Published 2026-04-17. Accessed 2026-10-11.Used for: eu-eurostat-2021-device-mobile-phone-internet-users-65-74
- [238]Eurostat. Eurostat database: Individuals - devices used to access the internet (isoc_ci_dev_i), community survey on ICT usage in households and by individuals. Published 2026-04-17. Accessed 2026-10-11.Used for: eu-eurostat-2023-device-mobile-phone-internet-users-65-74
- [239]US Census Bureau. American Community Survey 2015 1-year estimates, Table S2802: Types of Internet Subscriptions by Selected Characteristics. Published 2016-09-15. Accessed 2026-10-11.Used for: us-census-acs-2015-broadband-65plus-persons
- [240]US Census Bureau. American Community Survey 2016 1-year estimates, Table S2802: Types of Internet Subscriptions by Selected Characteristics. Published 2017-09-14. Accessed 2026-10-11.Used for: us-census-acs-2016-broadband-65plus-persons
- [241]US Census Bureau. American Community Survey 2017 1-year estimates, Table S2802: Types of Internet Subscriptions by Selected Characteristics. Published 2018-09-13. Accessed 2026-10-11.Used for: us-census-acs-2017-broadband-65plus-persons
- [242]US Census Bureau. American Community Survey 2018 1-year estimates, Table S2802: Types of Internet Subscriptions by Selected Characteristics. Published 2019-09-26. Accessed 2026-10-11.Used for: us-census-acs-2018-broadband-65plus-persons
- [243]US Census Bureau. American Community Survey 2019 1-year estimates, Table S2802: Types of Internet Subscriptions by Selected Characteristics. Published 2020-09-17. Accessed 2026-10-11.Used for: us-census-acs-2019-broadband-65plus-persons
- [244]US Census Bureau. American Community Survey 2021 1-year estimates, Table S2802: Types of Internet Subscriptions by Selected Characteristics. Published 2022-09-15. Accessed 2026-10-11.Used for: us-census-acs-2021-broadband-65plus-persons
- [245]US Census Bureau. American Community Survey 2022 1-year estimates, Table S2802: Types of Internet Subscriptions by Selected Characteristics. Published 2023-09-14. Accessed 2026-10-11.Used for: us-census-acs-2022-broadband-65plus-persons
- [246]US Census Bureau. American Community Survey 2023 1-year estimates, Table S2802: Types of Internet Subscriptions by Selected Characteristics. Published 2024-09-12. Accessed 2026-10-11.Used for: us-census-acs-2023-broadband-65plus-persons
- [247]International Journal of Environmental Research and Public Health (MDPI). Health Emergencies, Falls, and Use of Communication Technologies by Older People with Functional and Social Frailty: Ageing in Place in Deprived Areas of Italy (Socci M, Clarke D, Principi A, et al., IJERPH 2022;19(22):14775, doi:10.3390/ijerph192214775). Published 2022-11-10. Accessed 2026-10-11.Used for: socci-2022-frail-living-alone-phone-type-italy
- [248]Rock Health. Screenagers to Silver Surfers: How each generation clicks with care (Knowles M, Krasniansky A, Kaganoff S). Published 2025-03-17. Accessed 2026-10-11.Used for: rockhealth-2024-boomers-65-74-smartwatch-or-connected-device-36pct
- [249]Nature Human Behaviour (Springer Nature). A meta-analysis of technology use and cognitive aging. Published 2025-04-14. Accessed 2026-10-11.Used for: benge-2025-digital-technology-use-cognitive-impairment-or-0-42, benge-2025-digital-technology-use-cognitive-decline-hr-0-74
- [250]Journal of the American Geriatrics Society (Wiley). Internet usage and the prospective risk of dementia: A population-based cohort study. Published 2023-05-19. Accessed 2026-10-11. (abstract only)Used for: cho-2023-hrs-regular-internet-use-dementia-hr-0-57
- [251]Aging & Mental Health (Taylor & Francis). Is use of the internet in midlife associated with lower dementia incidence? Results from the English Longitudinal Study of Ageing. Published 2017-08-10. Accessed 2026-10-11.Used for: dorsi-2018-elsa-internet-use-dementia-hr-0-60
- [252]PLOS ONE (Public Library of Science). Older men who use computers have lower risk of dementia. Published 2012-08-28. Accessed 2026-10-11.Used for: almeida-2012-hims-computer-use-dementia-hr-0-62
- [253]Proceedings of the National Academy of Sciences (PNAS). Leisure-time sedentary behaviors are differentially associated with all-cause dementia regardless of engagement in physical activity. Published 2022-08-22. Accessed 2026-10-11.Used for: raichlen-2022-uk-biobank-computer-time-dementia-hr-0-85
- [254]Globalization and Health (BMC, Springer Nature). Internet use, cardiometabolic multimorbidity, and death in older adults: a multi-cohort study spanning developing and developed countries. Published 2023-11-06. Accessed 2026-10-11.Used for: ren-2023-internet-use-mortality-shr-0-67
- [255]BMC Public Health (Springer Nature). Association between digital smart device use and depression among older adults: systematic review and meta-analysis. Published 2026-05-09. Accessed 2026-10-11.Used for: gu-2026-smart-device-use-depression-or-0-68
- [256]Nature Human Behaviour (Springer Nature). Positive association between Internet use and mental health among adults aged >=50 years in 23 countries. Published 2024-11-18. Accessed 2026-10-11. (abstract only)Used for: luo-2025-internet-use-depressive-symptoms-23-countries
- [257]Journals of Gerontology Series B (Oxford University Press). Internet use and depression among retired older adults in the United States: a longitudinal analysis. Published 2014-03-26. Accessed 2026-10-11. (abstract only)Used for: cotten-2014-hrs-internet-use-depression-one-third-lower
- [258]eClinicalMedicine (The Lancet). Association between internet exclusion and depressive symptoms among older adults: panel data analysis of five longitudinal cohort studies. Published 2024-08-02. Accessed 2026-10-11.Used for: yan-2024-internet-exclusion-depressive-symptoms-five-cohorts
- [259]Medicine (Wolters Kluwer). The impact of social isolation and digital exclusion on mental and physical health in older adults: A meta-analysis. Published 2026-01. Accessed 2026-10-11.Used for: byeon-2026-isolation-digital-exclusion-depression-or-1-60, byeon-2026-digital-exclusion-cognitive-decline-or-1-03-not-significant
- [260]American Journal of Geriatric Psychiatry (Elsevier). Using Skype to Beat the Blues: Longitudinal Data from a National Representative Sample. Published 2018-10-29. Accessed 2026-10-11. (abstract only)Used for: teo-2019-hrs-video-chat-users-depressive-symptoms-6-9pct
- [261]Journal of the American Geriatrics Society (Wiley). Does Mode of Contact with Different Types of Social Relationships Predict Depression in Older Adults? Evidence from a Nationally Representative Survey. Published 2015-10-06. Accessed 2026-10-11.Used for: teo-2015-hrs-in-person-contact-depression-11-5pct-phone-contact-no-link
- [262]Journals of Gerontology Series B (Oxford University Press). Internet Use and Loneliness of Older Adults Over Time: The Mediating Effect of Social Contact. Published 2021-02. Accessed 2026-10-11. (abstract only)Used for: yu-2021-hrs-internet-use-loneliness-total-effect
- [263]Cochrane Database of Systematic Reviews (Cochrane/Wiley). Video calls for reducing social isolation and loneliness in older people: a rapid review. Published 2020-05-21. Accessed 2026-10-11.Used for: noone-2020-cochrane-video-calls-loneliness-little-or-no-difference
- [264]Journal of Medical Internet Research (JMIR Publications). Evaluation of the Effectiveness of Digital Technology Interventions to Reduce Loneliness in Older Adults: Systematic Review and Meta-analysis. Published 2021-06-04. Accessed 2026-10-11.Used for: shah-2021-digital-interventions-loneliness-no-significant-effect
- [265]National Center for Health Statistics (CDC). Telemedicine Use Among Adults: United States, 2021 (NCHS Data Brief No. 445). Published 2022-10. Accessed 2026-10-11.Used for: us-nchs-2021-telemedicine-use-65plus-43-3pct
- [266]National Center for Health Statistics (CDC). Declines in Telemedicine Use Among Adults: United States, 2021 and 2022 (National Health Statistics Reports No. 205). Published 2024-06-20. Accessed 2026-10-11.Used for: us-nchs-2022-telemedicine-use-65plus-30-6pct
- [267]Centers for Medicare & Medicaid Services (CMS). Medicare Telehealth Trends (CMS dataset, release of 14 September 2026, data through Q1 2026). Published 2026-09-14. Accessed 2026-10-11.Used for: us-cms-2025-medicare-telehealth-use-85plus, us-cms-2020-medicare-telehealth-use-85plus, us-cms-2021-medicare-telehealth-use-85plus, us-cms-2022-medicare-telehealth-use-85plus, us-cms-2023-medicare-telehealth-use-85plus, us-cms-2024-medicare-telehealth-use-85plus
- [268]University of Michigan Institute for Healthcare Policy and Innovation (National Poll on Healthy Aging); Innovation in Aging (GSA). Use of and experiences with telehealth visits and patient portals in a nationally representative sample of older adults (GSA 2024 abstract). Published 2024-12. Accessed 2026-10-11.Used for: us-npha-2019-telehealth-visit-past-year-50-80-4pct
- [269]University of Michigan National Poll on Healthy Aging; Innovation in Aging (GSA). Poll Findings on Social Connection and Technology Use During the COVID-19 Pandemic (GSA 2021 abstract). Published 2021. Accessed 2026-10-11.Used for: us-npha-2020-telehealth-visit-march-june-50-80-26pct
- [270]JAMA Internal Medicine (American Medical Association). Assessing Telemedicine Unreadiness Among Older Adults in the United States During the COVID-19 Pandemic. Published 2020-08-03. Accessed 2026-10-11.Used for: lam-2020-nhats-video-visit-unready-65plus-38pct, lam-2020-nhats-video-visit-unready-85plus-72pct, lam-2020-nhats-telephone-visit-unready-65plus-20pct
- [271]Journals of Gerontology Series B (Oxford University Press). Changes in Older Adults' Social Contact During the COVID-19 Pandemic. Published 2021-09-16. Accessed 2026-10-11.Used for: freedman-2022-nhats-weekly-phone-contact-70plus-86-6pct, freedman-2022-nhats-weekly-video-contact-70plus-26pct, freedman-2022-nhats-weekly-in-person-contact-70plus-39pct
- [272]Pew Research Center. Americans' Views on Mobile Etiquette, ch. 1 'Always on connectivity' (Rainie L., Zickuhr K.). Published 2015-08-26. Accessed 2026-10-11.Used for: us-pew-2014-carry-phone-frequently-65plus
- [273]International Journal of Environmental Research and Public Health (MDPI). Health Emergencies, Falls, and Use of Communication Technologies by Older People with Functional and Social Frailty: Ageing in Place in Deprived Areas of Italy. Published 2022-11-10. Accessed 2026-10-11.Used for: melchiorre-2022-in-age-mobile-phone-used-to-call-help-40-of-88
- [274]British Medical Journal. How dangerous are falls in old people at home?. Published 1981-01-24. Accessed 2026-10-11.Used for: wild-1981-no-faller-used-telephone-after-falling
- [275]Ageing & Society (Cambridge University Press). Use of personal call alarms among community-dwelling older people (Nyman SR, Victor CR). Published 2014-01. Accessed 2026-10-11. (abstract only)Used for: nyman-victor-2014-elsa-personal-call-alarm-use-6pct
- [276]TheSeniorList.com (consumer review site). 2026 Medical Alert Device Usage Report. Published 2026-06-22. Accessed 2026-10-11.Used for: seniorlist-2026-pers-ownership-65plus-9pct
- [277]Public Health Scotland. Technology enabled care: support provided or funded by local authorities in Scotland (5 May 2026). Published 2026-05-05. Accessed 2026-10-11.Used for: uk-phs-2025-scotland-technology-enabled-care-65plus-86-9pct
- [278]Public Health Scotland. Technology enabled care: support provided or funded by health and social care partnerships in Scotland (20 February 2024). Published 2024-02-20. Accessed 2026-10-11.Used for: uk-phs-2024-scotland-technology-enabled-care-85plus-37pct
- [279]Department of Health and Social Care; Department for Science, Innovation and Technology (UK Government). Telecare National Action Plan: protecting telecare users throughout the digital phone switchover. Published 2025-02-11. Accessed 2026-10-11.Used for: uk-dhsc-dsit-2025-telecare-users-2-million
- [280]Federal Trade Commission. False alarm, real scam: how scammers are stealing older adults' life savings (Consumer Protection Data Spotlight). Published 2025-08-07. Accessed 2026-10-11.Used for: us-ftc-2024-impersonation-10k-losses-60plus-phone-call-first-contact-41pct, us-ftc-2024-impersonation-scam-loss-10k-plus-reports-60plus, us-ftc-2024-impersonation-10k-losses-60plus-crypto-payment-33pct, us-ftc-2020-impersonation-scam-loss-10k-plus-reports-60plus, us-ftc-2021-impersonation-scam-loss-10k-plus-reports-60plus, us-ftc-2022-impersonation-scam-loss-10k-plus-reports-60plus, us-ftc-2023-impersonation-scam-loss-10k-plus-reports-60plus
- [281]Federal Trade Commission. Protecting Older Consumers 2024-2025: A Report of the Federal Trade Commission. Published 2025-12-01. Accessed 2026-10-11.Used for: us-ftc-2024-older-adults-phone-fraud-median-loss-2210, us-ftc-2024-older-adults-text-scam-losses-more-than-eightfold, us-ftc-2024-older-adults-reported-fraud-losses-2-4-billion, us-ftc-2024-estimated-fraud-cost-older-adults-up-to-81-5-billion, us-ftc-2024-older-adults-six-figure-losses-68pct-of-losses, us-ftc-2024-older-adults-over-100k-loss-reports-5125, us-ftc-2024-older-adults-tech-support-scam-loss-400pct-more-likely, us-ftc-2024-fraud-reports-filed-for-80plus-by-others-15-8pct, us-ftc-2024-older-adults-fraud-reports-without-loss-74pct
- [282]Federal Trade Commission. Consumer Sentinel Network Data Book 2024. Published 2025-03. Accessed 2026-10-11.Used for: us-ftc-2024-median-fraud-loss-80plus-1650, us-ftc-2024-fraud-losses-reported-80plus, us-ftc-2024-fraud-losses-by-age-60-69-1-18-billion, us-ftc-2024-fraud-reports-with-loss-80plus-21pct
- [283]Federal Trade Commission. Protecting Older Consumers 2023-2024: A Report of the Federal Trade Commission. Published 2024-10-18. Accessed 2026-10-11.Used for: us-ftc-2023-estimated-fraud-cost-older-adults-up-to-61-5-billion
- [284]Federal Trade Commission. FTC Data Show a More Than Four-Fold Increase in Reports of Impersonation Scammers Stealing Tens and Even Hundreds of Thousands from Older Adults (press release). Published 2025-08-07. Accessed 2026-10-11.Used for: us-ftc-2024-impersonation-losses-over-100k-60plus-445-million
- [285]Financial Crimes Enforcement Network (US Treasury). Financial Trend Analysis: Elder Financial Exploitation, Threat Pattern & Trend Information, June 2022 to June 2023. Published 2024-04. Accessed 2026-10-11.Used for: us-fincen-2024-elder-financial-exploitation-suspicious-activity-27-billion
- [286]Federal Trade Commission. Consumer Sentinel Network Data Book 2018. Published 2019-02. Accessed 2026-10-11.Used for: us-ftc-2018-fraud-losses-reported-80plus
- [287]Federal Trade Commission. Consumer Sentinel Network Data Book 2019. Published 2020-01. Accessed 2026-10-11.Used for: us-ftc-2019-fraud-losses-reported-80plus
- [288]Federal Trade Commission. Consumer Sentinel Network Data Book 2020. Published 2021-02. Accessed 2026-10-11.Used for: us-ftc-2020-fraud-losses-reported-80plus
- [289]Federal Trade Commission. Consumer Sentinel Network Data Book 2021. Published 2022-02. Accessed 2026-10-11.Used for: us-ftc-2021-fraud-losses-reported-80plus
- [290]Federal Trade Commission. Consumer Sentinel Network Data Book 2022. Published 2023-02. Accessed 2026-10-11.Used for: us-ftc-2022-fraud-losses-reported-80plus
- [291]Federal Trade Commission. Consumer Sentinel Network Data Book 2023. Published 2024-02. Accessed 2026-10-11.Used for: us-ftc-2023-fraud-losses-reported-80plus
- [292]National Police Agency (Japan). 令和7年における特殊詐欺及びSNS型投資・ロマンス詐欺の認知・検挙状況等について(確定値) [Special fraud and social-media investment/romance fraud in 2025: final figures]. Published 2026-05-22. Accessed 2026-10-11.Used for: jp-npa-2025-special-fraud-losses-65plus-84-1-billion-yen, jp-npa-2025-special-fraud-cases-65plus-share, jp-npa-2025-special-fraud-first-contact-phone-call, jp-npa-2025-ore-ore-fraud-victims-80plus-3235-cases, jp-npa-2025-suspicious-precursor-calls-331653
- [293]Financial Supervisory Service (Korea). 2023년 보이스피싱 피해현황 분석 [Analysis of voice phishing damage in 2023] (press release, 7 March 2024). Published 2024-03-07. Accessed 2026-10-11.Used for: kr-fss-2023-voice-phishing-losses-60plus-share, kr-fss-2022-voice-phishing-losses-60plus-share, kr-fss-2021-voice-phishing-losses-60plus-share, kr-fss-2023-voice-phishing-victims-60plus-messenger-phishing-75-6pct
- [294]National Anti-Scam Centre (ACCC). Targeting scams: Report of the National Anti-Scam Centre on scams data and activity 2025. Published 2026-03. Accessed 2026-10-11.Used for: au-nasc-2025-scam-losses-65plus-88-8-million, au-nasc-2025-median-scam-loss-65plus-716
- [295]Canadian Anti-Fraud Centre (RCMP, OPP, Competition Bureau). Canadian Anti-Fraud Centre Annual Statistics Report 2024. Published 2025-10-23. Accessed 2026-10-11.Used for: ca-cafc-2024-fraud-losses-60plus-share-27-9pct, ca-cafc-2024-investment-scam-losses-60plus-share-36pct
- [296]Office for National Statistics. Fraud and computer misuse in England and Wales: appendix tables, year ending March 2025. Published 2026-03-26. Accessed 2026-10-11.Used for: uk-ons-2025-fraud-victims-75plus-5-4pct, uk-ons-2025-phishing-messages-received-75plus-28pct
- [297]National Police Agency (Japan). 令和6年における特殊詐欺及びSNS型投資・ロマンス詐欺の認知・検挙状況等について(確定値版) [Special fraud in 2024: final figures]. Published 2025-05-23. Accessed 2026-10-11.Used for: jp-npa-2024-special-fraud-first-contact-phone-call, jp-npa-2024-special-fraud-cases-65plus-share
- [298]National Police Agency (Japan). 令和5年における特殊詐欺の認知・検挙状況等について(確定値版) [Special fraud in 2023: final figures]. Published 2024-05-27. Accessed 2026-10-11.Used for: jp-npa-2023-special-fraud-first-contact-phone-call, jp-npa-2023-special-fraud-cases-65plus-share
- [299]National Police Agency (Japan). 令和元年における特殊詐欺認知・検挙状況等について(確定値版) [Special fraud in 2019: final figures]. Accessed 2026-10-11.Used for: jp-npa-2019-special-fraud-cases-65plus-share-83-7pct
- [300]National Anti-Scam Centre (ACCC). Targeting scams: Report of the National Anti-Scam Centre on scams data and activity 2024. Published 2025-03. Accessed 2026-10-11.Used for: au-nasc-2024-scam-losses-65plus-99-6-million, au-nasc-2023-scam-losses-65plus-121-million
- [301]PLOS ONE (Public Library of Science). Cybercrime victimisation among older adults: A probability sample survey in England and Wales. Published 2024-12-18. Accessed 2026-10-11.Used for: havers-2024-csew-75plus-cybercrime-financial-loss-or-4-25
- [302]Pew Research Center. Older Adults and Technology Use. Published 2014-04-03. Accessed 2026-10-11.Used for: us-pew-2011-smartphone-65plus
- [303]Departamento Administrativo Nacional de Estadística (DANE), Colombia. DANE, Indicadores básicos de tenencia y uso de TIC en hogares y personas de 5 y más años de edad 2019, anexo, Cuadro C.15. Published 2021-09-02. Accessed 2026-10-11.Used for: co-dane-2019-internet-use-55plus
- [304]Departamento Administrativo Nacional de Estadística (DANE), Colombia. DANE, Indicadores básicos de tenencia y uso de TIC en hogares y personas de 5 y más años de edad 2022, anexo, Cuadro C.14. Published 2023-07-26. Accessed 2026-10-11.Used for: co-dane-2022-internet-use-55plus
- [305]Departamento Administrativo Nacional de Estadística (DANE), Colombia. DANE, Indicadores básicos de tenencia y uso de TIC en hogares y personas de 5 y más años de edad 2023, anexo, Cuadro C.14. Published 2024-08-09. Accessed 2026-10-11.Used for: co-dane-2023-internet-use-55plus
- [306]Departamento Administrativo Nacional de Estadística (DANE), Colombia. DANE, Boletín técnico, Indicadores básicos de tenencia y uso de TIC en hogares y personas de 5 y más años de edad 2025, Gráfico 30. Published 2026-09-30. Accessed 2026-10-11.Used for: co-dane-2024-internet-use-55plus
- [307]Ministry of Internal Affairs and Communications, Japan (総務省). 平成25年通信利用動向調査 世帯構成員編 構12表 問1(2)過去1年間のインターネット利用経験(無回答除く). Published 2014-06-27. Accessed 2026-10-11.Used for: jp-mic-2013-internet-use-65plus, jp-mic-2013-internet-use-80plus
- [308]Ministry of Internal Affairs and Communications, Japan (総務省). 平成26年通信利用動向調査 世帯構成員編 表番号12 問1(2)過去1年間のインターネット利用経験(S)(対象:無回答除く全員). Published 2015-07-17. Accessed 2026-10-11.Used for: jp-mic-2014-internet-use-65plus, jp-mic-2014-internet-use-80plus
- [309]Ministry of Internal Affairs and Communications, Japan (総務省). 平成27年通信利用動向調査 世帯構成員編 表番号11 問1(2)過去1年間のインターネット利用経験(S)(対象:無回答除く全員). Published 2016-08-18. Accessed 2026-10-11.Used for: jp-mic-2015-internet-use-65plus, jp-mic-2015-internet-use-80plus
- [310]Ministry of Internal Affairs and Communications, Japan (総務省). 平成28年通信利用動向調査 世帯構成員編 表番号9 問2(1)過去1年間のインターネット利用経験(S)(対象:無回答除く全員). Published 2017-06-15. Accessed 2026-10-11.Used for: jp-mic-2016-internet-use-65plus, jp-mic-2016-internet-use-80plus
- [311]Ministry of Internal Affairs and Communications, Japan (総務省). 平成29年通信利用動向調査 世帯構成員編 表番号21 問3(1)過去1年間のインターネット利用経験(S)(無回答を除く). Published 2018-06-22. Accessed 2026-10-11.Used for: jp-mic-2017-internet-use-65plus, jp-mic-2017-internet-use-80plus
- [312]Ministry of Internal Affairs and Communications, Japan (総務省). 平成30年通信利用動向調査 世帯構成員編 表番号9 問1 過去1年間のインターネット利用経験. Published 2019-05-31. Accessed 2026-10-11.Used for: jp-mic-2018-internet-use-65plus, jp-mic-2018-internet-use-80plus
- [313]Ministry of Internal Affairs and Communications, Japan (総務省). 令和2年通信利用動向調査 世帯構成員編 表番号9 問1 過去1年間のインターネット利用経験. Published 2021-06-18. Accessed 2026-10-11.Used for: jp-mic-2020-internet-use-65plus, jp-mic-2020-internet-use-80plus
- [314]Ministry of Internal Affairs and Communications, Japan (総務省). 令和3年通信利用動向調査 世帯構成員編 表番号9 問1 過去1年間のインターネット利用経験. Published 2022-05-27. Accessed 2026-10-11.Used for: jp-mic-2021-internet-use-65plus, jp-mic-2021-internet-use-80plus
- [315]Ministry of Internal Affairs and Communications, Japan (総務省). 令和4年通信利用動向調査 世帯構成員編 表番号9 問1 過去1年間のインターネット利用経験(対象:無回答除く). Published 2023-05-29. Accessed 2026-10-11.Used for: jp-mic-2022-internet-use-65plus, jp-mic-2022-internet-use-80plus
- [316]Ministry of Internal Affairs and Communications, Japan (総務省). 令和5年通信利用動向調査 世帯構成員編 表番号9 問1 過去1年間のインターネット利用経験(対象:無回答除く). Published 2024-06-07. Accessed 2026-10-11.Used for: jp-mic-2023-internet-use-65plus, jp-mic-2023-internet-use-80plus
- [317]Ministry of Internal Affairs and Communications, Japan (総務省). 令和6年通信利用動向調査 世帯構成員編 表番号9 問1 過去1年間のインターネット利用経験(対象:無回答除く). Published 2025-05-30. Accessed 2026-10-11.Used for: jp-mic-2024-internet-use-65plus, jp-mic-2024-internet-use-80plus
- [318]Census and Statistics Department, Hong Kong SAR. Thematic Household Survey Report No. 62 (key indicators). Published 2017-04-18. Accessed 2026-10-11.Used for: hk-csd-2014-smartphone-ownership-65plus, hk-csd-2016-smartphone-ownership-65plus, hk-csd-2016-smartphone-ownership-55-64
- [319]Infocomm Media Development Authority, Singapore (IMDA). Singapore Digital Society Report 2023, Chart 3: Percentage of residents with smartphone ownership (2017-2022). Published 2023. Accessed 2026-10-11.Used for: sg-imda-2017-smartphone-ownership-60plus, sg-imda-2018-smartphone-ownership-60plus, sg-imda-2019-smartphone-ownership-60plus, sg-imda-2020-smartphone-ownership-60plus, sg-imda-2021-smartphone-ownership-60plus, sg-imda-2022-smartphone-ownership-60plus, sg-imda-2017-smartphone-ownership-40-59, sg-imda-2018-smartphone-ownership-40-59, sg-imda-2019-smartphone-ownership-40-59
- [320]Federal Bureau of Investigation, Internet Crime Complaint Center (IC3). 2018 Internet Crime Report. Published 2019-04-23. Accessed 2026-10-11.Used for: us-fbi-ic3-2018-elder-fraud-losses-60plus
- [321]Federal Bureau of Investigation, Internet Crime Complaint Center (IC3). 2019 Internet Crime Report. Published 2020-02-10. Accessed 2026-10-11.Used for: us-fbi-ic3-2019-elder-fraud-losses-60plus
- [322]Federal Bureau of Investigation, Internet Crime Complaint Center (IC3). 2020 Elder Fraud Report. Published 2021-06-10. Accessed 2026-10-11.Used for: us-fbi-ic3-2020-elder-fraud-losses-60plus
- [323]Federal Bureau of Investigation, Internet Crime Complaint Center (IC3). 2021 Elder Fraud Report. Published 2022-04-05. Accessed 2026-10-11.Used for: us-fbi-ic3-2021-elder-fraud-losses-60plus
- [324]Federal Bureau of Investigation, Internet Crime Complaint Center (IC3). 2022 Elder Fraud Report. Published 2023-04-13. Accessed 2026-10-11.Used for: us-fbi-ic3-2022-elder-fraud-losses-60plus
- [325]Federal Bureau of Investigation, Internet Crime Complaint Center (IC3). 2023 Elder Fraud Report. Published 2024-04-30. Accessed 2026-10-11.Used for: us-fbi-ic3-2023-elder-fraud-losses-60plus
- [326]Federal Bureau of Investigation, Internet Crime Complaint Center (IC3). 2024 IC3 Annual Report. Published 2025-04. Accessed 2026-10-11.Used for: us-fbi-ic3-2024-elder-fraud-losses-60plus
- [327]Eurostat. Eurostat database: Individuals - frequency of internet use (isoc_ci_ifp_fu), community survey on ICT usage in households and by individuals. Published 2026-04-17. Accessed 2026-10-11.Used for: eu-eurostat-2007-daily-internet-use-65-74
- [328]Eurostat. Eurostat database: Individuals - frequency of internet use (isoc_ci_ifp_fu), community survey on ICT usage in households and by individuals. Published 2026-04-17. Accessed 2026-10-11.Used for: eu-eurostat-2010-daily-internet-use-65-74
- [329]Eurostat. Eurostat database: Individuals - frequency of internet use (isoc_ci_ifp_fu), community survey on ICT usage in households and by individuals. Published 2026-04-17. Accessed 2026-10-11.Used for: eu-eurostat-2013-daily-internet-use-65-74
- [330]Eurostat. Eurostat database: Individuals - frequency of internet use (isoc_ci_ifp_fu), community survey on ICT usage in households and by individuals. Published 2026-04-17. Accessed 2026-10-11.Used for: eu-eurostat-2016-daily-internet-use-65-74
- [331]Eurostat. Eurostat database: Individuals - frequency of internet use (isoc_ci_ifp_fu), community survey on ICT usage in households and by individuals. Published 2026-04-17. Accessed 2026-10-11.Used for: eu-eurostat-2019-daily-internet-use-65-74
- [332]Eurostat. Eurostat database: Individuals - frequency of internet use (isoc_ci_ifp_fu), community survey on ICT usage in households and by individuals. Published 2026-04-17. Accessed 2026-10-11.Used for: eu-eurostat-2022-daily-internet-use-65-74
- [333]National Center for Health Statistics (CDC/NCHS). Wireless Substitution: Early Release of Estimates From the National Health Interview Survey (report released 2008-05). Published 2008-05-13. Accessed 2026-10-11.Used for: us-nchs-2004-wireless-only-household-65plus, us-nchs-2005-wireless-only-household-65plus, us-nchs-2006-wireless-only-household-65plus, us-nchs-2007-wireless-only-household-65plus
- [334]National Center for Health Statistics (CDC/NCHS). Wireless Substitution: Early Release of Estimates From the National Health Interview Survey (report released 2010-05). Published 2010-05-12. Accessed 2026-10-11.Used for: us-nchs-2008-wireless-only-household-65plus, us-nchs-2009-wireless-only-household-65plus
- [335]National Center for Health Statistics (CDC/NCHS). Wireless Substitution: Early Release of Estimates From the National Health Interview Survey (report released 2012-06). Published 2012-06-01. Accessed 2026-10-11.Used for: us-nchs-2010-wireless-only-household-65plus, us-nchs-2011-wireless-only-household-65plus
- [336]National Center for Health Statistics (CDC/NCHS). Wireless Substitution: Early Release of Estimates From the National Health Interview Survey (report released 2014-07). Published 2014-07-01. Accessed 2026-10-11.Used for: us-nchs-2012-wireless-only-household-65plus, us-nchs-2013-wireless-only-household-65plus
- [337]National Center for Health Statistics (CDC/NCHS). Wireless Substitution: Early Release of Estimates From the National Health Interview Survey (report released 2017-05). Published 2017-05-01. Accessed 2026-10-11.Used for: us-nchs-2014-wireless-only-household-65plus, us-nchs-2015-wireless-only-household-65plus, us-nchs-2016-wireless-only-household-65plus
- [338]National Center for Health Statistics (CDC/NCHS). Wireless Substitution: Early Release of Estimates From the National Health Interview Survey (report released 2018-06). Published 2018-06-01. Accessed 2026-10-11.Used for: us-nchs-2017-wireless-only-household-65plus
- [339]National Center for Health Statistics (CDC/NCHS). Wireless Substitution: Early Release of Estimates From the National Health Interview Survey (report released 2019-06). Published 2019-06-01. Accessed 2026-10-11.Used for: us-nchs-2018-wireless-only-household-65plus
- [340]National Center for Health Statistics (CDC/NCHS). Wireless Substitution: Early Release of Estimates from the National Health Interview Survey, July-December 2019. Published 2020-09-01. Accessed 2026-10-11.Used for: us-nchs-2019-wireless-only-adults-65plus, us-nchs-2019-landline-only-adults-65plus
- [341]National Center for Health Statistics (CDC/NCHS). Wireless Substitution: Early Release of Estimates from the National Health Interview Survey, July-December 2020. Published 2021-08-01. Accessed 2026-10-11.Used for: us-nchs-2020-wireless-only-adults-65plus, us-nchs-2020-landline-only-adults-65plus
- [342]National Center for Health Statistics (CDC/NCHS). Wireless Substitution: Early Release of Estimates from the National Health Interview Survey, July-December 2021. Published 2022-05-01. Accessed 2026-10-11.Used for: us-nchs-2021-wireless-only-adults-65plus, us-nchs-2021-landline-only-adults-65plus
- [343]National Center for Health Statistics (CDC/NCHS). Wireless Substitution: Early Release of Estimates from the National Health Interview Survey, July-December 2022. Published 2023-05-01. Accessed 2026-10-11.Used for: us-nchs-2022-wireless-only-adults-65plus, us-nchs-2022-landline-only-adults-65plus
- [344]National Center for Health Statistics (CDC/NCHS). Wireless Substitution: Early Release of Estimates from the National Health Interview Survey, July-December 2023. Published 2024-06-01. Accessed 2026-10-11.Used for: us-nchs-2023-wireless-only-adults-65plus, us-nchs-2023-landline-only-adults-65plus
- [345]National Center for Health Statistics (CDC/NCHS). Wireless Substitution: Early Release of Estimates from the National Health Interview Survey, July-December 2024. Published 2025-06-01. Accessed 2026-10-11.Used for: us-nchs-2024-wireless-only-adults-65plus, us-nchs-2024-landline-only-adults-65plus
- [346]Insee. L'usage des technologies de l'information et de la communication par les ménages entre 2009 et 2024 (Insee Résultats). Published 2024-11-26. Accessed 2026-10-11.Used for: fr-insee-2024-internet-use-75plus
- [347]Statistics Netherlands (CBS). CBS StatLine 83429NED. Published 2019-10-08. Accessed 2026-10-11.Used for: nl-cbs-2012-internet-use-75plus, nl-cbs-2015-internet-use-75plus, nl-cbs-2017-internet-use-75plus, nl-cbs-2019-internet-use-75plus
- [348]Pew Research Center. Smartphone Ownership 2013. Published 2013-06-05. Accessed 2026-10-11.Used for: us-pew-2012-smartphone-65plus
- [349]Pew Research Center. Technology Device Ownership: 2015 (chapter: The Demographics of Device Ownership). Published 2015-10-29. Accessed 2026-10-11.Used for: us-pew-2015-smartphone-65plus, us-pew-2015-cellphone-65plus
- [350]Pew Research Center. Mobile Fact Sheet (February 5, 2018 edition, Internet Archive capture of 30 May 2018). Published 2018-02-05. Accessed 2026-10-11.Used for: us-pew-2018-smartphone-65plus, us-pew-2018-cellphone-65plus, us-pew-2018-smartphone-50-64
- [351]Pew Research Center. Mobile Fact Sheet (June 12, 2019 edition, Internet Archive capture of 31 May 2020). Published 2019-06-12. Accessed 2026-10-11.Used for: us-pew-2019-smartphone-65plus, us-pew-2019-cellphone-65plus, us-pew-2019-smartphone-50-64
- [352]Pew Research Center. Mobile Fact Sheet (January 31, 2024 edition, Internet Archive capture of 15 June 2024). Published 2024-01-31. Accessed 2026-10-11.Used for: us-pew-2023-smartphone-65plus, us-pew-2023-cellphone-65plus, us-pew-2023-smartphone-50-64
- [353]Pew Research Center. Older adults and internet use. Published 2012-06-06. Accessed 2026-10-11.Used for: us-pew-2010-cellphone-65plus, us-pew-2012-cellphone-65plus
- [354]Pew Research Center. Mobile Fact Sheet (April 7, 2021 edition, Internet Archive capture of 31 May 2022). Published 2021-04-07. Accessed 2026-10-11.Used for: us-pew-2021-cellphone-65plus, us-pew-2021-smartphone-50-64
- [355]Pew Research Center. Smartphone Adoption and Usage (report PDF). Published 2011-07-11. Accessed 2026-10-11.Used for: us-pew-2011-smartphone-50-64
- [356]Pew Research Center. Mobile Technology Fact Sheet (December 27, 2013 edition, Internet Archive capture of 1 March 2014): table 'Cell phone and smartphone ownership'. Published 2013-12-27. Accessed 2026-10-11.Used for: us-pew-2013-smartphone-50-64
- [357]Pew Research Center. Technology Device Ownership: 2015 (report PDF). Published 2015-10-29. Accessed 2026-10-11.Used for: us-pew-2015-smartphone-50-64
- [358]Census and Statistics Department, Hong Kong SAR. Thematic Household Survey Report No. 54: Information technology usage and penetration. Published 2015-04. Accessed 2026-10-11.Used for: hk-csd-2014-smartphone-ownership-55-64
- [359]Census and Statistics Department, Hong Kong SAR. Thematic Household Survey Report No. 64: Pattern of smoking; Personal computer and Internet penetration. Published 2018-03-22. Accessed 2026-10-11.Used for: hk-csd-2017-smartphone-ownership-55-64, hk-csd-2017-smartphone-ownership-65plus
- [360]Census and Statistics Department, Hong Kong SAR. Thematic Household Survey Report No. 67: Information technology usage and penetration. Published 2019-06-27. Accessed 2026-10-11.Used for: hk-csd-2018-smartphone-ownership-55-64, hk-csd-2018-smartphone-ownership-65plus
- [361]Census and Statistics Department, Hong Kong SAR. Thematic Household Survey Report No. 69: Personal computer and Internet penetration. Published 2020-03-26. Accessed 2026-10-11.Used for: hk-csd-2019-smartphone-ownership-55-64, hk-csd-2019-smartphone-ownership-65plus
- [362]Census and Statistics Department, Hong Kong SAR. Thematic Household Survey Report No. 73: Information technology usage and penetration. Published 2021-04-15. Accessed 2026-10-11.Used for: hk-csd-2020-smartphone-ownership-55-64
- [363]Census and Statistics Department, Hong Kong SAR. Thematic Household Survey Report No. 75: Internet and personal computer penetration; Pattern of smoking. Published 2022-05-26. Accessed 2026-10-11.Used for: hk-csd-2021-smartphone-ownership-55-64
- [364]Census and Statistics Department, Hong Kong SAR. Thematic Household Survey Report No. 77: Information technology usage and penetration. Published 2023-05-30. Accessed 2026-10-11.Used for: hk-csd-2022-smartphone-ownership-55-64
- [365]Ministry of Science and ICT / Korea Internet & Security Agency, Korea (과학기술정보통신부 / 한국인터넷진흥원). 2018 Survey on the Internet Usage, Statistical Tables (English). Published 2019-05-03. Accessed 2026-10-11.Used for: kr-msit-2018-smartphone-ownership-60-69, kr-msit-2018-smartphone-ownership-70plus
- [366]Ministry of Science and ICT / National Information Society Agency, Korea (과학기술정보통신부 / 한국지능정보사회진흥원). 2019 Survey on the Internet Use, Statistical Table (English). Published 2020-04-23. Accessed 2026-10-11.Used for: kr-msit-2019-smartphone-ownership-60-69, kr-msit-2019-smartphone-ownership-70plus
- [367]Ministry of Science and ICT / National Information Society Agency, Korea (과학기술정보통신부 / 한국지능정보사회진흥원). 2020 Survey on the Internet Use, Statistical Table (English). Published 2021-04-20. Accessed 2026-10-11.Used for: kr-msit-2020-smartphone-ownership-60-69, kr-msit-2020-smartphone-ownership-70plus